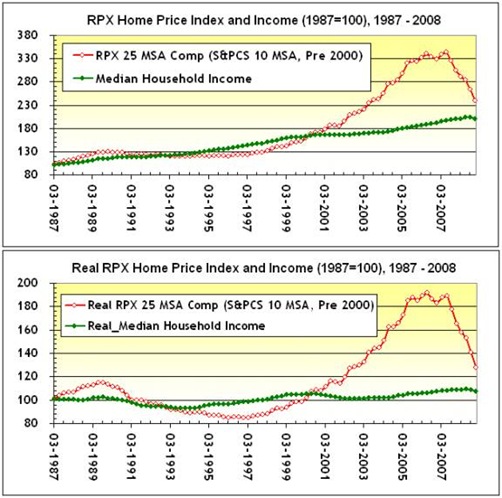
Home Prices and Income, 1987 – 2008, Nominal [top] and Real [bottom]
As the bottom chart of inflation-adjusted home prices and income demonstrates, even as real household income meandered along a relatively flat path, home prices exploded after 2001. This was due, in part, to:
- A steep yield curve;
- The widespread use of ARMS;
- Flexible mortgage underwriting standards; and
- Mortgage product innovations (subprime, Alt-A, Option ARMs).
All of the above encouraged home ownership. By 2006, prices had peaked, and began to correct.
No comments:
Post a Comment