A. Analyse Growth
Step 1: Historical Sales
Historical sales growth is the first of four indicators BetterInvesting uses to identify well managed growth companies.
It is desirable to invest in companies whose sales growth is strong and consistent and generally growing faster than the overall economy and inflation combined. *
Is the company's historical sales growth rate acceptable for a company its size?
Check growth rate % - have sales grown faster than the competition and the economy?
Check growth rate trend - have sales figures changed direction recently? If sales are up or down do you know why? Are the forces that caused growth in the past the same ones that will create growth in the future?
Does the company deserve further study?
Compare your candidate company to:
Others in the same industry
Peer group average
Industry average
* Review background economic and inflation data
Gross Domestic Product Data
Inflation Data
Step 2: Historical Earnings Per Share
Historical earnings per share (EPS) growth is the second indicator BetterInvesting uses to identify well managed growth companies.
It is desirable to invest in companies whose EPS growth rate is strong and consistent and generally growing faster than the overall economy and inflation combined.
Is the company's historical EPS growth rate acceptable for a company its size?
Check growth rate % - have earnings grown faster than the competition and the economy?
Have EPS figures changed direction recently? If so, do you know why?
Does the company deserve further study?
Compare your candidate company to:
Others in the same industry
Peer group average
Industry average
Step 3: Historical Stock Price Review
You've reviewed the company's historical sales and earnings growth. Both should be growing
1. Faster than the economy and inflation combined
2. Faster than competitors
3. Consistently
If these conditions have been met then check that EPS is growing in line with sales.
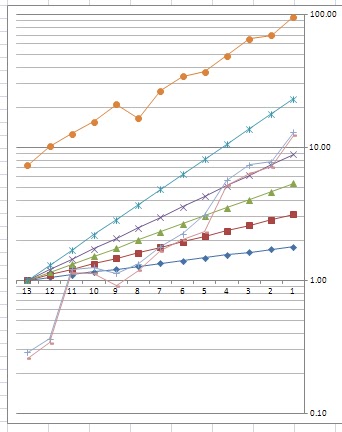
1. Check that the graph lines of sales and EPS are mostly straight and moving together in parallel toward the upper right-hand portion of the graph.
2. Compare the growth rates of both sales and EPS using the rates given in the data grid.
Next, determine whether the company's stock price has tracked the growth rates of Sales and EPS. A company's stock price will typically follow the earnings growth rate -- price follows earnings. Looking at the graph you can see the relationship of stock price to EPS.
Steady growth in stock price is an indicator of management's ability to grow sales and EPS and that the market has confidence in the company.
It is desirable to invest in companies whose share price increases as its sales and earnings increase. Price bars show how much movement up and down there is in the stock price each year. Skilled management can control the variables in the company so that the high and low prices travel smoothly upward. More up and down movement means more risk.
Check
Are earnings growing in line with sales?
Has the company's stock price moved in line with EPS?
Does this company deserve further study?
B. Evaluate Management
Step 1: % Pre-Tax Profit on Sales
% Pre-tax Profit on Sales is the third indicator BetterInvesting uses to identify well managed growth companies. A good percent pre-tax profit margin shows a company is well managed.
It is desirable to invest in companies whose percent pre-tax profit is increasing or at least staying the same. Examining the most recent five year average helps us determine this.
Is the 5 year average percentage of pre-tax profit on sales increasing or at least staying the same?
Is the percentage of profit consistent over time?
Does this company deserve further study?
Compare your candidate company to
Others in the same industry
Peer group average
Industry average
Step 2: % Earned on Equity
% Earned on Equity (ROE) is the fourth indicator BetterInvesting uses to identify well managed growth companies. It tells how effectively company management is using the shareholders' money to make a profit.
It is desirable to invest in companies whose ROE percentage is increasing or at least staying the same. An exception is when a company is paying off debt, which is covered in the next section.
Is the percentage of ROE increasing or at least staying the same?
Is the percentage of ROE consistent over time?
Does this company deserve further study?
Compare your candidate company to
Others in the same industry
Peer group average
Industry average
Step 3: Total Debt
One indicator of management skill is how debt is employed.
Most companies borrow money to help them reach their goals. Companies go into debt to buy equipment, real estate, and many other things. Some industries use debt more than others. Borrowing some money can be very good because it helps the company do things it could not afford to do on an all cash basis. Borrowing too much money can be very bad because it increases risk in two ways:
1. Debt increases the risk to common shareholders because the company must pay the claims from debt and preferred stockholders before common shareholders receive anything.
2. High levels of debt are risky for a company because it has to pay its debt obligations whether it's doing well or not. If the company runs short of money during a recession, the debt obligations could force the company to go out of business.
Check:
Is the total debt increasing or decreasing?
Review the company web site and official reports to understand the reasons for significant changes in total debt.
Look at Total Debt and % Debt to Capital together to understand how the company is managing debt.
Step 4: % Debt to Capital
One indicator of management skill is how debt is employed. Look at Total Debt and % Debt to Capital together to understand how the company is managing debt.
The percent of total debt to capital helps you understand whether company management is using debt conservatively or liberally. The ratio enables you to make valuable comparisons between the company you are studying, peer companies and the industry.
Some industries such as banks, financial institutions, and utilities typically operate using higher levels of debt. Some successful companies in other industries have proven that they can carry high debt over many years. Younger companies often have relatively higher levels of debt, but because they are young they don't have a track record that shows they can manage it well over many years. This adds considerable risk as an investment.
Check:
Is percent of Debt to Capital increasing or decreasing markedly?
Review the company web site and official documents to understand the reasons for changes in debt levels (company expansion, acquisitions, divestiture, etc.)
Is the company on a "spending spree" financed by debt?
Is the company borrowing enough to help it stay competitive?
Compare to:
Historical trends
Peer Group
Industry averages
C. Forecast Sales Earnings
Step 1: Forecast Sales
If the company you are studying has not met any of the BetterInvesting standards you have studied so far, you should discard the company and begin the study of another.
If all preceding indicators have met the BetterInvesting standards then you have more than likely identified a quality growth company. You now need to consider its potential as an investment for your portfolio.
You must predict how well your investment candidate will perform in the future by estimating sales and earnings.
First, forecast the rate at which you believe sales will continue to grow in the future.
Forecast company sales by considering:
1. Historical results -- consistent strong growth
2. Competition
3. Changes in consumer or market preferences
4. Changes in products or services offered
Is your forecast moderate, meaning it does not rely on extreme conditions or situations?
Is your forecast sustainable, meaning it does not rely on events or circumstances that are not likely to occur regularly?
How does it compare to other companies you may have studied?
Step 2: Forecast Earnings
Forecast the rate you believe earnings will grow in the future. Your forecasted earnings growth rate will establish an estimate of how much money the company will be earning per share five years from now. This EPS forecast will help you establish an estimated high price the EPS would support.
D. Assess Risk and Reward
Step 1: Forecast High Price
How high is the price of the stock likely to go in the next five years?
The answer comes by multiplying the highest likely earnings per share by the average high price earnings ratio.
1. The default high EPS forecast is determined by your entries in the preceding screen.
2. The average high PE forecast is determined by reviewing historical data and current PE primarily, and competitive information as well.
Changing the numbers in the boxes changes the forecast.
Step 2: Forecast Low Price
How low is the price of the stock likely to go in the next five years?
The answer comes by multiplying the lowest likely earnings per share by the likely average low price earnings ratio.
The default values displayed are based on historical averages.
You need to decide whether or not they reflect the company in the next five years and adjust if necessary.
Step 3: Assess Stock Price
Now that you have estimated the high and low prices for the next five years, find the current price and determine where it falls within the high-low range.
The range between the high and low prices is divided into three zones: sell, hold and buy.
1. If the current price is in the top range, the stock is in the sell range.
2. If the current price is in the middle range, the stock is in the hold range.
3. If the current price is in the lower range, the stock is in the buying range.
Step 4: Determine Potential Gain vs. Loss
Even though well considered, forecasts are not certain.
By comparing the current price to
1. Your forecast high price and
2. Your forecast low price
you determine your potential gain and potential loss.
It is desirable to invest in companies offering a potential gain at least three times the potential loss.
E. Determine 5 Year Potential
Determine 5 Year Potential
Compounded Return is the projected annual price appreciation plus the projected average annual yield.
The Price Appreciation is the increase in the price of the stock, assuming you sold the stock at its projected high price.
The Yield is the projected average annual return on the price, paid as a dividend. Yield is calculated by dividing the dividend by the purchase price of the stock.
If the company performs as well as you expect, and you sell the stock at the forecast high price, this will be your financial return.
Better Investing - Core SSG
http://www.betterinvesting.org/public/default.htm
http://www.betterinvesting.org/NR/rdonlyres/CB93E207-7341-4225-B609-8197173DFBB9/0/P1JudgmentandtheSSG4pp.pdf
http://www.betterinvesting.org/Public/SingleTabs/Webinars/archives.htm
Stock Research Form
4.0 CONCLUDING DIALOGUE (STOCK SELECTION REPORT)
|
To complete, make selections from choices presented in each statement below.
1. The company is (well-established) (new) and operates (internationally) (nationally) (regionally).
2. The product line or service is (diversified) (limited) and sold to (consumers) (manufacturers) (other companies) (government(s)).
3. Business cycles affect sales and earnings (minimally) (moderately) (severely).
4. Interest rates for T-bills are historically (low) (average) (high) and seem to be (trending upward) (steady) (trending downward).
5. Current inflation rates are (low) (average) (high) and seem to be (trending upward) (steady) (trending downward).
6. In its industry the company is the (largest player) (in the top tier) (an average or smaller size company).
7. The company has a (continuous dividend record for ________ years) (an inconsistent dividend record) (no dividend record).
8. The business cycle seems to be (trending upward) (steady) (trending downward).
9. The current stage of the business cycle tends to (help) (not effect) (hurt) the profits of the company which suggests (no concern) (caution) (optimism) for the company under review.
4.1 YOUR PROJECTIONS ON THE SSG (SUMMARY)
|
|
Projection
|
Rationale
|
Sales Growth Rate (%)
|
|
|
EPS Growth Rate (%)
|
|
|
High P/E
|
|
|
Low P/E
|
|
|
Low Price
|
|
|
% Payout
|
|
|
4.2 YOUR FINAL RECOMMENDATION (BUY, SELL, HOLD)
|
|
• MYTH – Once a stock has doubled our investment it is time to sell.
• MYTH – Wait until a stock is back to even before selling.
purchase price.
not sell.
• MYTH – Don’t sell a stock until you have found a good replacement.
• MYTH – Sell everything when we are going into a bear market.
future gains are unlikely.
• When you find a better stock. Frequently this is
•Remember, stocks are a means to an end. The goal is to grow
your wealth. You aren’t being disloyal to a stock if you sell it.