Cash Flow Statement: Reviewing The Cash Flow From Operations
By Michael Schmidt |
Updated March 5, 2018
Operating cash flow is cash that is generated from the normal operating processes of a business. A company's ability to consistently generate positive cash flows from its daily business operations is highly valued by investors. In particular, operating cash flow can uncover a company's true profitability. It’s one of the purest measures of cash sources and uses.
The purpose of drawing up a cash flow statement is to see a company's sources of cash and uses of cash, over a specified time period. The cash flow statement is traditionally considered to be less important than the income statement and the balance sheet, but it can be used to understand the trends of a company's performance that can't be understood through the other two financial statements.
While the cash flow statement is considered the third most important of the three financial statements, investors find the cash flow statement to be the most transparent, so they rely on it more than the other financial statements when making investment decisions.
The Cash Flow Statement
Operating cash flow, or cash flow from operations (CFO), can be found in the cash flow statement, which reports the changes in cash versus its static counterparts: the income statement, balance sheet and shareholders’ equity statement. Specifically, the cash flow statement reports where cash is used and generated over specific time periods and ties the static statements together. By taking net income on the income statement and making adjustments to reflect changes in the working capital accounts on the balance sheet (receivables, payables, inventories), the operating cash flow section shows how cash was generated during the period. It is this translation process from accrual accounting to cash accounting that makes the operating cash flow statement so important.
The cash flow statement is broken down into three categories: cash flow from operating activities, cash flow from investing activities and cash flow from financing activities. In some cases, there is a supplemental activities category as well. These are segregated so that analysts develop a clear idea of all the cash flows generated by a company’s various activities.
1. Operating activities: records a company's operating cash movement, the net of which is where operating cash flow (OCF) is derived.
2. Investing activities: records changes in cash from the purchase or sale of property, plants, equipment or generally long-term investments.
3. Financing activities: reports cash level changes from the purchase of a company’s own stock or issue of bonds, and payments of interest and dividends to shareholders.
4. Supplemental information: basically everything that does not relate to the major categories.
Breakdown of Activities
Operating activities are normal and core activities within a business that generate cash inflows and outflows. They include:
- total sales of goods and services collected during a period;
- payments made to suppliers of goods and services used in production settled during a period;
- payments to employees or other expenses made during a period.
Cash flow from operating activities excludes money that is spent on capital expenditures, cash directed to long-term investments and any cash received from the sale of long-term assets. Also excluded is the amount that is paid out as dividends to stockholders, amounts received through the issuance of bonds and stock, and money used to redeem bonds.
Investing activities consist of payments made to purchase long-term assets, as well as cash received from the sale of long-term assets. Examples of investing activities are the purchase or sale of a fixed asset or property, plant, and equipment, and the purchase or sale of a security issued by another entity.
Financing activities consist of activities that will
alter the equity or borrowings of a company. Examples of financing activities include the sale of a company's shares or the repurchase of its shares.
Calculating Cash Flow
To see the importance of changes in operating cash flows, it’s important to understand how cash flow is calculated.
Two methods are used to calculate cash flow from operating activities: indirect and direct, which both produce the same result.
Direct Method: This method draws data from the income statement using cash receipts and cash disbursements from operating activities. The net of the two values is the OCF.
Indirect Method: This
method starts with net income and converts it to OCF by adjusting for items that were used to calculate net income but did not affect cash.
Direct vs. Indirect Method
The direct method adds up all the various types of cash payments and receipts, including cash paid to suppliers, cash receipts from customers and cash paid out in salaries. These figures are calculated by using the beginning and end balances of a variety of a business accounts and examining the net decrease or increase of the account.
The exact formula used to calculate the inflows and outflows of the various accounts differs based on the type of account. In the most commonly used formulas, accounts receivable are used only for credit sales and all sales are done on credit. If cash sales have also occurred, receipts from cash sales must also be included to develop an accurate figure of cash flow from operating activities. Since the direct method does not include net income, it must also provide a reconciliation of net income to the net cash provided by operations.
In contrast, under the
indirect method, cash flow from operating activities is
calculated by first taking the net income off of a company's income statement. Because a company’s income statement is prepared on an accrual basis, revenue is only recognized when it is earned and not when it is received. Net income is not a perfectly accurate representation of net cash flow from operating activities, so it becomes necessary to
adjust earnings before interest and taxes (EBIT) for items that affect net income, even though no actual cash has yet been received or paid against them. (See What is the difference between EBIT and cash flow from operating activities?) The indirect method also makes adjustments to add back non-operating activities that do not affect a company's operating cash flow.
The direct method for calculating a company's cash flow from operating activities is a more straightforward approach in that it reveals a company's operating cash receipts and payments, but is more challenging to prepare since the information is difficult to assemble. Still, whether you use the direct or indirect method for calculating cash from operations, the same result will be produced.
Operating Cash Flows
OCF is a prized measurement tool as it helps investors gauge what’s going on behind the scenes. For many investors and analysts, OCF is considered the cash version of net income, since it cleans the income statement of non-cash items and non-cash expenditures (depreciation, amortization, non-cash working capital and changes in current assets and liabilities).
OCF is a more important gauge of profitability than net income, as there is less opportunity to manipulate OCF to appear more or less profitable. With the passing of strict rules and regulations on how overly creative a company can be with its accounting practices, chronic earnings manipulation can easily be spotted, especially with the use of OCF. It is also a
good proxy of a company’s net income; for example, a reported OCF higher than NI is considered positive, as income is actually understated due to the reduction of non-cash items.
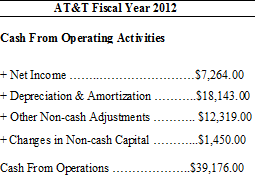
AT&T Cash Flow Statement showing cash from operating activities.
Above are the reported cash flow activities for AT&T (T
) for its fiscal year 2012 (in millions). Using the indirect method, each non-cash item is added back to net income to produce cash from operations. In this case,
cash from operations is over five times as much as reported net income, making it a valuable tool for investors in evaluating AT&T's financial strength.
The Bottom Line
Operating cash flow is just one component of a company’s cash flow story, but it is also one of the most valuable measures of strength, profitability and the long-term future outlook. It is derived either directly or indirectly and measures money flow in and out of a company over specific periods. Unlike net income, OCF excludes non-cash items like depreciation and amortization which can misrepresent a company's actual financial position.
It is a good sign when a company has strong operating cash flows with more cash coming in than going out. Companies with strong growth in OCF most likely have more stable net income, better abilities to pay and increase dividends, and more opportunities to expand and weather downturns in the general economy or their industry.
If you think “cash is king,” strong cash flow from operations is what you should watch for when analyzing a company.
Read more: Cash Flow Statement: Reviewing The Cash Flow From Operations | Investopedia https://www.investopedia.com/articles/investing/102413/cash-flow-statement-reviewing-cash-flow-operations.asp#ixzz5CkNk5dp4
Follow us: Investopedia on Facebook
https://www.investopedia.com/articles/investing/102413/cash-flow-statement-reviewing-cash-flow-operations.asp


![{\displaystyle FCFE=NI-[(1-b)(Capex-D\&A)+(1-b)(\Delta WC)]}](https://wikimedia.org/api/rest_v1/media/math/render/svg/13b79e03b9e2ed84404dcc77a21ef8bed0868d3d)