Saturday 17 October 2020

The Circle of Wealth

The Miser and his Lump of Gold

Aesop, twenty-six hundred years ago, told the story of the miser who sold all that he had and bought a lump of gold, which he buried in the ground.  He went to look at it every day.  One day, the lump of gold was stolen and the miser was distraught.  A neighbour, learning of his grief, suggested that he find a stone and bury it in the hole and imagine that the gold is still lying there.  

"It will do you the same service, for when the gold was there you didn't really have it because you didn't make the slightest use of it."  

The moral of the story is that the true value of wealth is not in its possession but in its use.  Wealth unused might as well not exist.


The Burdens of Wealth

The burdens of wealth are in 

  • the act of creating, 
  • the fear of keeping, 
  • the temptation of using, 
  • the guilt of abusing, 
  • the sorrow in losing and 
  • the responsibility of handing it over to a succeeding generation.  
Just like building a business, with wealth you need to create, build, sustain and pass the baton.


"Riches get their value from the mind of the possessor.  They are blessings to those who know how to use them and curses to those who do not."(Ancient Rome playwright Terence 190 B.C.)

"For a person to build a rich and rewarding life for himself, there are certain qualities and bits of knowledge that he needs to acquire.  There are also things, harmful attitudes, superstitions, and emotions that he needs to chip away.  A person needs to chip away everything that doesn't look like the person he or she most wants to become."  (Earl Nightingale)


The Importance of Integrity

Warren Buffett looks at three character traits in people who surround him:  integrity, energy and intelligence.  He says, if you don't have the first, the last two will kill you.  In fact, if they don't have integrity, he would rather his managers be lazy and dumb.

"Integrity is like oxygen.  If you don't have it, nothing else matters."

"Be honest.  Never lie under any circumstances.  Just basically lay it out as you see it.  Simply speak openly and frankly."

Integrity is also about principles, full disclosure and openness.

Integrity is a choice, and the lack of it most often leads to self destruction.


The Value of a Good Reputation

"Conduct all business way inside the lines. and if it is near the line or on the line don't do it."  This advice would keep you out of trouble.

"Never do anything in business that you wouldn't want printed on the front page of your local newspaper written by an intelligent but critical reporter."

Always be on the lookout for managers and business with excellent reputations as possible acquisitions.

"It takes twenty years to build a reputation and only five minutes to ruin it.  If you'd think about that, you'll do things differently."

"He that is of the opinion that money will do everything may well be suspected of doing everything for money." (Benjamin Franklin)


Respect Yourself and Others

Follow the rules of common courtesy and political politeness.  Answer all letters promptly with a lighthearted one-paragraph reply.

"Of the billionaires I have known, money just brings out the basic traits in them.  If they were jerks before they had money they are simply jerks with a billion dollars." (Warren Buffett)


Good Character, Strong Ethics

Business success and wealth creation can be achieved with the highest ethical standards and without shady, questionable practices.

Warren Buffett treats his shareholders like partners and has created wealth with them, not at their expense.  

Character is tested most in defeat or when you have great power or great wealth.  A powerful man in business has stood the test of time and power.

One of the most powerful messages Buffett delivers in his humorous style is this:  Make a list of all the traits you admire and respect in others.  Think of people close to you or even those who have passed away.  His point is that whatever character traits you put on your list, you can adopt those same qualities and be that person.  Warren Buffett also suggests to his student audiences to make another list of the character traits that they don't admire or respect in others.  If you think about it and put some effort to it, you too can avoid all of the negative characteristics of the person you don't want to be.

Character cannot be hidden or faked.  You can tell if someone is the type of person with whom you want to associate.

A German motto says this, "When wealth is lost, nothing is lost; when health is lost, something is lost; when character is lost, all is lost."


Money Can't Buy Happiness

"No matter how rich you become, how famous or powerful, when you die, the size of your funeral will still pretty much depend on the weather."

Most people agree that if you have created wealth at the expense of your relationships, health or ethics, then you have nothing.   Life is more than money and more than wealth.

"Happiness is not the mere possession of money; it lies in the joy of achievement, in the thrill of creative effort." (Franklin D. Roosevelt)

True happiness is doing what you were born to do, also known as self-actualization or following your bliss.  

Each person is born with a different genetic code.  The challenge for each of us, in order to find our happiness, is to figure out what our passion is, what our talents are and how best to express them.

Many people have found the attainment of wealth is without happiness if you fail to:

  • Give credit to others
  • Live with moderation
  • Select the right heroes and mentors
  • Give back and mentor others
  • Look after your health.
  • Earn the respect you deserve
  • Stay well within the laws (including paying taxes)
  • Be industrious
  • Be socially connected and have friends 
  • Have the love of those you want to love you
"Tell me who your heroes are and I'll tell you what kind of person you will become."

With the ability to buy most things, Warren chooses to enjoy few possessions and to keep the things he does have for a lifetime.  Warren finds happiness not in his vast fortune, but instead in delivering newspapers with his grandson and taking his family to the Dairy Queen on Sunday, talking with and mentoring college students, explaining that he lives no better than they do, he just travels better.

"Good managers never take credit for more than they do."

Warren carefully chooses those friends who, when they are around, bring out the best in him.  

Hang out with people who are bigger than you, bring out the best, and inspire you, and you will have a network of giants.

In the end, happiness does not come from Buffett's wealth, but rather from the number of people who love you. The most important thing is not how many or how large his assets are, but how his children feel about him.  Warren considers parenthood vital to happiness,  and unfortunately there is no rewind button on child development.

The more love you give, the more you get, and you can never give too much of it away.  It is inexhaustible.


Reference:  Warren Buffett's Lesson on Having a Rich Life

Thursday 8 October 2020

Is Inflation Good for Stocks?


Conclusions:  

Back-tested data does not show any significant relationship between inflation rates and stock market returns.

Stock valuations may be negatively impacted by higher-than-normal inflation (due to increase in the risk-free rate which makes short-term Treasuries more attractive relative to equities).

Stocks may not be as good a "hedge" against inflation as the theoretical argument may suggest, this may be limited to SHORTER-TERM stock market movements.   

LONG-TERM investors in the stock market should take comfort in the fact that the S&P 500 has steadily outpaced inflation with an annualised real (inflation adjusted) return of 3% between 1871 and 2009.


Notes:

1.  Deflationary fears amidst weak economic growth have led to much liquidity being injected into the financial system by various central banks around the world.

2.  Motto:  "Deflation:  Making sure "it" doesn't happen here."

3.  Fundamentally, there appears to be a strong case for stocks to perform under inflationary conditions.  
  • When raw material costs rise, companies can raise selling prices and pass on the increased costs to the consumer.  The goods and services produced by companies make up the composition of the CPI, and it is not unreasonable to expect selling prices to rise in tandem with the CPI.
  • Also, companies hold real assets like property and land which can rise in nominal value over time.  Thus, investors in such companies should benefit over an inflationary period as the underlying assets increase in nominal value.

4.  The threats of deflation to economic prosperity are perhaps more obvious to investors who look to the beleaguered Japanese economy as a prime example.  
  • An economy where consumers postpone spending as items become cheaper in the future is certainly not an ideal one, especially for stock investors whose companies suffer from declining revenue and shrinking asset values.


Back-Testing the S&P 500

Monthly historical inflation and stock market returns

1.  Inflation in the US has historically been represented by year-on-year changes in the CPI and this is reported on a monthly basis.  

2.  We looked at monthly stock market returns based on the S&P 500 and compared the historical stock market returns to different levels of inflation.

3.  The majority of monthly historical inflation data was below 4%, with a surprisingly huge number of periods where inflation was negative (14.4%).

4.  Instead of the expected poor returns in periods of deflation, the S&P 500 actually averaged a 1.1% monthly return where the CPI posted year-on-year declines.

5.  The best average monthly return was logged in months where inflation was between 7% and 8%, but this accounted for only 18 of the 1150 months, less than 2% of the data tested.

6.  On the other hand, inflation rates higher than 8% saw negative average monthly returns.

7.  Inflation between 1% and 4%, more moderate levels of inflation, saw an average return of 0.8%.


Extension of the study to annual inflation and stock market returns.

1.  A large proportion (61%) of the annual inflation rates fell between 0 and 5%.

2.  There appeared to be little correlation between high/low inflation rates and stock market returns.

3.  The high or low inflation rates resulted in both positive and negative stock market returns.


Theoretical Benefits of Inflation May Not be Reflected in Stock Returns

This evidently does not show up in back-tested data for the S&P 500, where our results indicate a lack of any observable correlation.

Why? 

1.  Both company specific and industry-specific factors can play a huge role in determining the ability of a company to raise prices.

2.   The uniqueness of a company's product or its extent of substitutability can determine whether the company is able to raise prices without hurting demand.  If there are many substitutes available, the company may be forced to keep prices low to remain competitive.

3.  Companies whose business models depend on being low-cost producers will find it difficult to do well in an environment where raw material prices rise without a corresponding increase in selling prices.

4.  In certain highly regulated industries like the utilities or fixed-line telecommunications sector, regulatory authorities may prevent companies from raising selling prices, resulting in a price ceiling which caps profits.  

5.  Ultimately, a higher input cost which cannot be passed on to the tend consumer means lower profit margins and smaller profits.

6.  Recognizing the inflationary pressures faced by companies, it would appear that the benefits of inflation (rising asset prices, higher nominal revenue and profits) may take a significant period of time to occur.

7.  Industry consolidation and technology breakthroughs may also take place to counter the short-term negative impact of inflation, with surviving companies reaping the benefits while others go out of business.


Impact of inflation on valuations

1.  Inflation between 2% and 3% saw a wider range of valuations over the past nine decades (1950s, 1960s, 1990s and 2000s).

2.  Valuations of the 1920s and 1930s are perhaps less meaningful, as they encompass the Great Depression where unprecedented corporate bankruptcies could have skewed market earnings and thus valuations.

3.  More noteworthy are the decades with higher average inflation (1940s, 1970s and 1980s) were met with lower valuations.  How can this anomaly be explained by the impact of inflation on valuation metrics for the stock market?    

-  Periods of high inflation are generally met with interest rate hikes (as a means to subdue inflationary pressure), which make short-term treasuries more attractive relative to equities.  
-  Inflation normally results in an increase in the risk-free rate, which raises the required return on equities.  
-  The resulting impact on the stock market lowered valuations.  


Thursday 1 October 2020

Hidden hands behind penny stock surge (The Edge)

Special Report: Hidden hands behind penny stock surge 

The Edge Malaysia September 30, 2020
This article first appeared in The Edge Malaysia Weekly, on September 21, 2020 - September 27, 2020.


ASTUTE market observers would have noticed on the local bourse a group of individuals, supposedly acting in concert, who have amassed shares in more than 20 publicly traded companies. These companies — linked via shareholding and directorships — are often on the most actively traded list, with huge, fluctuating share prices. “It (the companies) is all linked to the same person; usually, the most actively traded list on a daily basis involves these counters,” one source says when asked which are the companies that are linked. 


However, research by The Edge (see chart on the 21 companies) indicates that while other businessmen have surfaced, the individual said to be in control of the group of companies is not officially onboard or present as a shareholder.   “This [his not surfacing] could be due to several issues,” another source adds. 

It is also telling that nine of the 21 companies mentioned — 
  • AT Systemization Bhd, 
  • MLabs Systems Bhd, 
  • Focus Dynamics Group Bhd, 
  • mTouche Technology Bhd, 
  • Fintec Global Bhd, 
  • XOX Bhd, 
  • M3Technologies (Asia) Bhd and 
  • NetX Holdings Bhd 
— have their principal place of business, head office, business office or corporate office in Menara Lien Hoe, near Tropicana Golf Country Resort in Petaling Jaya. 

On its website, Lambo Group Bhd states that its address is at Menara Lien Hoe, even though the address in its annual report is in Old Klang Road in Kuala Lumpur. 

In 2006, Lien Hoe Corp Bhd sold Lien Hoe Tower Sdn Bhd, which owns Menara Lien Hoe, to privately held E-Globalfocus Sdn Bhd for RM1 and the assumption of RM43 million in debts. Meanwhile, E-Globalfocus was 68%-controlled by Cubes Innovative Sdn Bhd, a company 99%-controlled by Chuah Hock Soon. 

Chuah and businessman Datuk Kenneth Vun @ Vun Yun Lun were charged with four others in July 2014 for allegedly manipulating DVM Technology Bhd shares in March 2006. 

Vun has had several issues with the Securities Commission Malaysia and, in 2009, had to restitute RM2.496 million — being the amount of company funds that he had caused to be misused for his personal benefit, according to the regulator — to his then flagship FTEC Resources Bhd. Since FTEC — which morphed into Tecasia Bhd and later Mangotone Bhd — was delisted, 

Vun has had little direct presence in the market. However, Vun’s two sisters, Carol Vun On Nei and Grace Vun Siaw Nei, hold stakes of 3.64% and 0.67% respectively in Xidelang Holdings Ltd. 


Fragmented shareholding 

While Fintec Global seems to be a prominent company at the centre of the maze, its shareholding is fragmented, with several blocks of shares parked under Sanston Financial Group Ltd. In several of the 21 companies on the list, Sanston Financial is present in the shareholding list. Other companies that surface as shareholders in these list of companies include Global Prime Partners Ltd and Cita Realiti Sdn Bhd, a private company wholly-owned by one Kamarudin Khalil. Other shareholders, albeit usually holding small stakes, among the 21 companies include Datuk Jacky Pang Chow Huat — who, apart from a 11.84% stake in Sanichi Technology Bhd — has small stakes in DGB Asia Bhd, Focus Dynamics, MNC Wireless Bhd and Xidelang. Pang is also a director in Sanichi Technology.

Meanwhile, businessman Mak Siew Wei has 23.4% in AT Systemization, 17.07% in Green Ocean Corp Bhd and small stakes in Focus Dynamics and Xidelang. He is also a director at AT Systemization, Green Ocean and Saudee Group Bhd. Datuk Eddie Chai Woon Chet recently acquired a 62.37% stake in restaurant operator Oversea Enterprise Bhd, and has a 6.71% shareholding in Anzo Holdings Bhd, where he is managing director and has a board position in M3Technologies (Asia). Another name frequently seen is Datuk Kua Khai Shyuan, who, besides a 5.9% stake in mTouche Technology, has small shareholdings in Focus Dynamics, PDZ Holdings Bhd and Sanichi Technology, and has board seats on Trive Property Bhd, DGB Asia and MNC Wireless. Former Umno treasurer and former Bank Simpanan Nasional Bhd chairman Datuk Abdul Azim Mohd Zabidi surfaces as a director in four of the companies — Fintec Global, DGB Asia, Anzo and XOX. 

Most of the companies are loss-making and small in terms of market capitalisation, with the exception of Focus Dynamics, which has a market value exceeding RM5 billion. Nevertheless, Focus Dynamics, which is involved in operating food and beverage outlets, seems to be the star performer, with its stock price hitting a multiple-year high of RM2.64 recently on Sept 17, despite mustering a meagre RM3.08 million in net profit from RM20.72 million in revenue for its six months ended June this year. Year to date, Focus Dynamics stock has gained about 400%. 


Irrational exuberance 

Trading volume on most of the 21 companies is generally high, and many have shown unexplainable strong gains over the past few months. 

  • For instance, Saudee’s stock hit a low of eight sen on March 17, and picked up momentum in June to hit a 52-week high of 67 sen on Aug 13, gaining more than 300%. For its nine months ended April this year, Saudee, whose mainstay is in frozen food and poultry, suffered a net loss of RM27.78 million from RM57.61 million in revenue. Last Friday, Saudee closed at 48 sen, translating into a market capitalisation of RM77.3 million. 
  • If you are impressed with Saudee’s gains, Anzo — a loss-making company that has a business in timber products — gained more than 1,000% from mid-May to hit a high of 26 sen in July. Anzo closed at 11.5 sen last Friday, giving it a market capitalization of RM102.7 million. 

There are several companies on the list that have shown similar patterns. 

  • XOX, which is involved in cellular telecommunication services, gained more than 430% from mid-July to hit a high of 39.5 sen at end-August. In mid-March this year, XOX was trading at one sen. The stock closed last Friday at 19.5 sen, translating into a market value of RM562.8 million.
  • Ailing shipping company PDZ’s stock was trading at one sen in mid-March, but at end-June, it gained more than 500% to 32.5 sen in mid-July. For a company mired in law suits and a significant dearth of shipping assets, PDZ’s meteoric rise is surprising to many. PDZ ended last Friday at 10 sen, giving it a value of RM89.4 million. 
  • Similarly, Sanichi Technology, which is in precision moulding, saw a sudden surge in trading volume at end-May, with its stock spiking more than 150% to hit a high of 12.5 sen on June 2, after which it tapered off. 


While the peaks may be enticing to punters, the change in fortune, with counters falling to their troughs, can be a deterrent. 
  • mTouche Technology, which has a wireless network and mobile messaging business, saw its stock crash from a high of 20.5 sen on Feb 20 this year to a low of 5.5 sen on May 12
  • DGB Asia, a tracking solutions company, was trading at 19.5 sen in the early part of November last year, but by mid-March, it had shed most of its value to close at 1.5 sen on March 19. 

It is also noteworthy that companies such as Water Beaute World Bhd and WBW Global Sdn Bhd, have 1.02% and 0.42% respectively in Trive Property. These two companies were involved in get-rich-quick and fake online investment schemes. Both these companies were reported in the past to have stakes in XOX, while WBW Global also had a substantial stake in Anzo Holdings.

Comment:

Fine piece of investigative financial investigation and journalism.  Thanks to Edge.

Tuesday 29 September 2020

Strategies for Banks to Make a Profit in a Low Interest Rate Economy

By Steve Lander

Low interest rates don't have to eliminate a bank's profitability. 


A low interest rate economy can be challenging for the banking sector. After all, if banks earn profit by lending out money and they can't charge as much for the money they lend, it's harder to maintain the same level of profitability. However, low interest rate markets still offer opportunities for banks to do extremely well. These strategies are as open to small community and business banks as they are to the largest institutions. 


Fee Revenue 

Instead of earning money by borrowing and lending money, banks can turn to fees to boost profits. For example, banks can charge overdraft fees when customers try to draw money that they don't have from their accounts. One $35 overdraft fee per year generates as much revenue as lending out $1000 at 3.5 percent for the year. Banks can also charge ATM usage fees, account maintenance fees, statement copy fees and just about anything else they can imagine. 


Origination and Turnover 

Another option for banks is to continually recycle their money, such as in the mortgage market. Instead of making a traditional 30-year mortgage loan and tying up their income for a long period of time, banks can make and sell loans. When the bank makes the loan, it ties up a portion of its capital in the loan at a low interest rate. However, the bank can turn around and sell that loan to an investor and, hopefully, realize a profit on the sale. The bank then has the money back to lend again so that it can continue flipping the funds. 


Changing the Spread 

When the rate that a bank can charge plunges, it creates an opportunity for them to increase their profit by charging a little bit more relative to the market. For example, if mortgage rates should go from 8 percent to 4 percent, it's unlikely that a customer would complain or even notice if the bank dropped its rate to 4.25 percent instead. After all, the customer is still saving a great deal of money relative to previous rates. Doing this helps to cushion the blow of low rates and protect or even increase bank profits. 


Rates Don't Matter 

A low interest rate market cuts both ways. While banks can't charge as much for loans, they also don't have to pay as much to attract deposits. Historical data from the Federal Reserve comparing the prime rate to the rate on a three-month certificate of deposit shows that they trade in a relatively tight band. Between 1995 and 2012, the average difference between the two rates was 275 basis points, and the spread varied between 212 and 320 basis points. When you take out the highest and lowest spread years, the range narrows to 267 to 297 basis points -- which is just over a 10 percent difference during 16 years of the 18 year period. For comparison, during that same period, the prime rate fluctuated from 3.25 to 9.25 percent and CD rates fluctuated from 0.28 to 6.46 percent. In other words, while rates change, the bank's profit, which comes from the difference between the deposit and loan rates, remains roughly similar.


https://smallbusiness.chron.com/strategies-banks-make-profit-low-interest-rate-economy-68922.html

Thursday 20 August 2020

Financial Shenanigans: Concluding Thoughts

This third edition of Financial Shenanigans updates investors with lessons gleaned from examining many of the deceptive financial reporting practices employed during the last decade. Since we published the original edition of Financial Shenanigans in 1993, corporate management has continued to concoct new ways to manipulate its financial reports in order to inflate company stock prices and other compensation-related metrics. And, looking to the future, as management works to create newfangled tricks, diligent investors must continue to learn to detect new financial shenanigans. 

The preface of this book quoted a proverb from the Bible (Ecclesiastes 1:9): 

What has been will be again, what has been done will be done again; there is nothing new under the sun. 

Corporate financial scandals have been around as long as corporations and investors themselves. Dishonest management has preyed on unsuspecting investors, and it is time for such investors to redouble their efforts to be alert for such financial shenanigans so that they can protect themselves. 

Since shenanigans at their most basic level represent management’s attempt to put a positive spin on a company’s financial performance and economic health, our universal message is that investors should assume that the urge to exaggerate the positive and hide the negative will never disappear. And where temptation exists, shenanigans often will follow.


Reference:

Financial Shenanigans  Third Edition 

by Howard M. Schilit & Jeremy Perler


Key Metrics Shenanigans: Part 4.

Part 4 introduces readers to a group of shenanigans that stretches management’s creativity in deception to the limit. 

This section of the book shows Key Metrics (KM) Shenanigans used to distort an investor’s understanding of the economic performance and health of that company. The accompanying boxes summarize exactly how it is done and how investors can spot these devices. 


Warning Signs: Showcasing Misleading Metrics That Overstate Performance (KM Shenanigan No. 1) 

  • Changing the definition of a key metric 
  • Highlighting a misleading metric as a surrogate for revenue 
  • Unusual definition of organic growth
  • Divergence in trend between same-store sales and revenue per store 
  • Inconsistencies between the earnings release and the 10-Q 
  • Highlighting a misleading metric as a surrogate for earnings 
  • Pretending that recurring charges are nonrecurring in nature 
  • Pretending that one-time gains are recurring in nature 
  • Highlighting a misleading metric as a surrogate for cash flow 
  • Headlining a misleading metric on the earnings release


Warning Signs: Distorting Balance Sheet Metrics to Avoid Showing Deterioration (KM Shenanigan No. 2) 

  • Distorting accounts receivable metrics to hide revenue problems 
  • Failing to prominently disclose the sale of accounts receivable 
  • Converting accounts receivable into notes 
  • Increases in receivables other than accounts receivable 
  • A huge decline in DSO following several quarters of growing receivables 
  • Inappropriate or changing methods of calculating DSO 
  • Distorting inventory metrics to hide profitability problems 
  • Moving inventory to another part of the Balance Sheet 
  • Distorting financial asset metrics to hide impairment problems 
  • Stopping the reporting of certain key metrics 
  • Distorting debt metrics to hide liquidity problems

Cash Flow Shenanigans: Part 3.

This part expands the discussion to the Statement of Cash Flows. Since investors have started placing more emphasis on cash flow from operations (CFFO), not surprisingly, management has tried to perfect a new class of shenanigans—those that inflate the CFFO. 

Four general Cash Flow (CF) Shenanigans are used to inflate CFFO, and they are reflected in the accompanying boxes. 


Warning Signs: Shifting Financing Cash Inflows to the Operating Section (CF Shenanigan No. 1)

  • Recording bogus CFFO from a normal bank borrowing 
  • Boosting CFFO by selling receivables before the collection date 
  • Disclosures about selling receivables with recourse 
  • Inflating CFFO by faking the sale of receivables 
  • Changes in the wording of key disclosure items in the financial reports 
  • Providing less disclosure than in the prior period 
  • Big margin expansion shortly after an inventory write-off 


Warning Signs: Shifting Normal Operating Cash Outflows to the Investing Section (CF Shenanigan No. 2) 

  • Inflating operating cash flow with boomerang transactions Improperly capitalizing normal operating costs 
  • New or unusual asset accounts 
  • Jump in soft assets relative to sales 
  • Unexpected increase in capital expenditures 
  • Recording purchase of inventory as an investing outflow 
  • Investing outflows that sound like a normal cost of business 
  • Purchasing patents, contracts, and development-stage technologies 


Warning Signs: Inflating Operating Cash Flow Using Acquisitions or Disposals (CF Shenanigan No. 3) 

  • Inheriting Operating cash inflows in a normal business acquisition 
  • Companies that make numerous acquisitions 
  • Declining free cash flow while CFFO appears to be strong 
  • Acquiring contracts or customers rather than developing them internally 
  • Boosting CFFO by creatively structuring the sale of a business 
  • New categories appearing on the Statement of Cash Flows 
  • Selling a business, but keeping the related receivables 


Warning Signs: Boosting Operating Cash Flow Using Unsustainable Activities (CF Shenanigan No. 4) 

  • Boosting CFFO by paying vendors more slowly 
  • Accounts payable increasing faster than cost of goods sold Increases in other payables accounts 
  • Large positive swings on the Statement of Cash Flows 
  • Evidence of accounts payable financing 
  • New disclosure about prepayments 
  • Offering customers incentives to pay invoices early 
  • Boosting CFFO by purchasing less inventory 
  • Disclosure about the timing of inventory purchases 
  • Dramatic improvements in CFFO 
  • CFFO benefit from one-time items

Breeding Grounds for Shenanigans: Part 1.

The following box summarizes the key warning signs that investors should consider as creating a higher likelihood that shenanigans will be present. 


Warning Signs: Breeding Ground for Shenanigans 

  • Absence of checks and balances among senior management 
  • An extended streak of meeting or beating Wall Street expectations  
  • A single family dominating management, ownership, or the board of directors 
  • Presence of related-party transactions 
  • An inappropriate compensation structure that encourages aggressive financial reporting 
  • Inappropriate members placed on the board of directors 
  • Inappropriate business relationships between the company and board members 
  • An unqualified auditing firm 
  • An auditor lacking objectivity and the appearance of independence 
  • Attempts by management to avoid regulatory or legal scrutiny

Earnings Manipulation Shenanigans: Part 2.

This part introduced seven Earnings Manipulation (EM) Shenanigans used to trick investors. 

  • The first five inflate current period income, and
  • the last two inflate that of future periods. 

The boxes given here show various techniques that management uses for each of the seven shenanigans. 


Warning Signs: Recording Revenue Too Soon (EM Shenanigan No. 1) 

  • Recording revenue before completing any obligations under contract 
  • Recording revenue far in excess of work completed on a contract 
  • Up-front revenue recognition on long-term contracts 
  • Use of aggressive assumptions on long-term leases or percentage-of-completion accounting 
  • Recording revenue before the buyer’s final acceptance of the product 
  • Recording revenue when the buyer’s payment remains uncertain or unnecessary 
  • Cash flow from operations lagging behind net income 
  • Receivables (especially long-term and unbilled) growing faster than sales 
  • Accelerating sales by changing the revenue recognition policy 
  • Using an appropriate accounting method for an unintended purpose 
  • Inappropriate use of mark-to-market or bill-and-hold accounting 
  • Changes in revenue recognition assumptions or liberalizing customer collection terms 
  • Seller offering extremely generous extended payment terms 

Warning Signs: Recording Bogus Revenue (EM Shenanigan No. 2) 

  • Recording revenue from transactions that lack economic substance 
  • Recording revenue from transactions that lack a reasonable arm’s-length process 
  • Lack of risk transfer from seller to buyer 
  • Transactions involving sales to a related party, affiliated party, or joint venture partner 
  • Boomerang (two-way) transactions to nontraditional buyers 
  • Recording revenue on receipts from non-revenue-producing transactions 
  • Recording cash received from a lender, business partner, or vendor as revenue 
  • Use of an inappropriate or unusual revenue recognition approach 
  • Inappropriately using the gross rather than the net method of revenue recognition 
  • Receivables (especially long-term and unbilled) growing much faster than sales 
  • Revenue growing much faster than accounts receivable 
  • Unusual increases or decreases in liability reserve accounts


Warning Signs: Boosting Income Using One-Time or Unsustainable Activities (EM Shenanigan No. 3) 

  • Boosting income using one-time events 
  • Turning proceeds from the sale of a business into a recurring revenue stream 
  • Commingling future product sales with buying a business 
  • Shifting normal operating expenses below the line 
  • Routinely recording restructuring charges 
  • Shifting losses to discontinued operations Including proceeds received from selling a subsidiary as revenue 
  • Operating income growing much faster than sales 
  • Suspicious or frequent use of joint ventures when unwarranted 
  • Misclassification of income from joint ventures 
  • Using discretion regarding Balance Sheet classification to boost operating income


Warning Signs: Shifting Current Expenses to a Later Period (EM Shenanigan No. 4) 

  • Improperly capitalizing normal operating expenses 
  • Changes in capitalization policy or accelerated capitalization of costs 
  • New or unusual asset accounts 
  • Jump in soft assets relative to sales 
  • Unexpected increase in capital expenditures 
  • Amortizing or depreciating costs too slowly 
  • Stretching out depreciable asset life 
  • Improper amortization of costs associated with loans 
  • Failing to record expenses for impaired assets 
  • Jump in inventory relative to cost of goods sold 
  • Failure by lenders to adequately reserve for credit losses 
  • Decrease in loan loss reserve relative to bad loans 
  • Decline in bad debt expense or obsolescence expense 
  • Decrease in reserves related to bad debts or inventory obsolescence


Warning Signs: Employing Other Techniques to Hide Expenses or Losses (EM Shenanigan No. 5) 

  • Failing to record an expense from a current transaction 
  • Unusually large vendor credits or rebates 
  • Unusual transactions in which vendors send out cash Failing to record an expense for a necessary accrual or reversing a past expense
  • Unusual declines in reserve for warranty or warranty expense 
  • Declining accruals, reserves, or “soft liability” accounts 
  • Unexpected and unwarranted margin expansion 
  • Unusually “lucky” timing on the issuance of stock options 
  • Failing to accrue loss reserves 
  • Failing to highlight off-balance-sheet obligations 
  • Changing pension, lease, or self-insurance assumptions to reduce expenses 
  • Outsized pension income


Warning Signs: Shifting Current Income to a Later Period (EM Shenanigan No. 6) 


  • Creating reserves and releasing them into income in a later period 
  • Stretching out windfall gains over several years 
  • Improperly accounting for derivatives in order to smooth income 
  • Holding back revenue just before an acquisition closes 
  • Creating acquisition-related reserves and releasing them into income in a later period 
  • Recording current-period sales in a later period 
  • Sudden and unexplained declines in deferred revenue 
  • Changes in revenue recognition policy 
  • Unexpectedly consistent earnings during a volatile time 
  • Signs of revenue being held back by the target just before an acquisition closes 


Warning Signs: Shifting Future Expenses to an Earlier Period (EM Shenanigan No. 7) 

  • Improperly writing off assets in the current period to avoid expenses in a future period 
  • Improperly recording charges to establish reserves used to reduce future expenses 
  • Large write-offs accompanying the arrival of a new CEO 
  • Restructuring charges just before an acquisition closes 
  • Gross margin expansion shortly after an inventory write-off 
  • Repeated restructuring charges that serve to convert ordinary expenses to a one-time expense 
  • Unusually smooth earnings during volatile times

Financial Shenanigans: A Holistic Approach to Detecting Financial Shenanigans

What to look for when reviewing financial statements and searching for financial shenanigans. 


 A Holistic Approach to Detecting Financial Shenanigans 

Just as the three branches of government rein in bad behavior by government officials, the three financial statements help to protect investors from misbehaving corporate executives. 

  • Specifically, investors can sniff out Earnings Manipulation Shenanigans by scrutinizing the Balance Sheet and the Statement of Cash Flows. 
  • Similarly, they can detect signs of misleading operating cash flow by finding unusual or troubling changes on the Statement of Income and the Balance Sheet. 
  • Additionally, investors can use the supplementary disclosures and key metrics provided by management as another form of “checks and balances.”

Examples

Company 
Financial Shenanigan 
Warnings on Other Financial Statements 


Earnings Manipulation Shenanigans 

WorldCom 
Boosted income by capitalizing operating costs 
SCF: Capital expenditures surged 

Transaction Systems Architects 
Recorded revenue too soon 
BS: Rapid increase in long-term and unbilled receivables 

IBM 
Boosted income with one-time gain 
SCF: Gain on investment sale in Operating section 

AOL 
Boosted income by capitalizing operating costs 
BS: Deferred marketing costs exploded 


Cash Flow Shenanigans 

Tyco 
Inflated CFFO using acquisitions 
BS: Receivables increase differs on BS and SCF 

Home Depot 
Boosted CFFO with unsustainable gain 
BS: Accounts payable surged 

Sun Microsystems 
Boosted CFFO with unsustainable gain 
IS: One-time litigationrelated gain


Saturday 8 August 2020

You Don't Understand Compound Growth

 You Don't Understand Compound Growth

Einstein once (supposedly) said:

Compound interest is the most powerful force in the universe

Of compound interest, Warren Buffet proclaims:

Over time it accomplishes extraordinary things

Compound interest, or growth, is one of the, if not the most, powerful and impactful forces in nature.

And yet, it is also one of the most consistently misunderstood in the world of business.

How so?

Simply, we misapply the term "compound growth" to things that do not actually grow in compound fashion.

Let's first establish what "compound growth" even means.

I propose the following operative definition:

Compound growth ~ constant growth

The fact is, very few objects, organisms or organizations can sustain truly compounding growth over any extended period.

From an observer's or investor's perspective, it's quite easy to fool yourself into thinking compound, exponential growth is much more common than it really is. And it's understandable given how often the term is thrown around. Firms in fleeting phases of fast growth can visually demonstrate their breakneck pace with the ubiquitous, infamous "hockey stick" chart.

Who could argue with that?

As an entrepreneur or operator, you too can fall prey to your own fictions - convincing yourself you've "cracked the code" when you've only really cracked the piggy bank. Irrational exuberance eventually turns concave, finally ending in a plateau of linearity.

Through some examples, I hope to demonstrate that compound growth 1) implies constant growth 2) is exceedingly rare and 3) is incredibly important to building a large, valuable business.

But before we get to business, let's talk about - bacteria.

Bacteria and Bricklayers

Bacteria

In bacteria populations, growth is fixed. Subject to the resource constraints of the environment they inhabit, bacteria grow at a constant rate indefinitely.

A simple example to illustrate the point:

Let's say we have some bacteria that reproduce on a fixed time schedule, one doubling per minute to keep the numbers simple.

We start with a single bacteria cell. After one minute, we'll have two bacteria. With time, the population grows as such:

  • 1
  • 2
  • 4
  • 8
  • 16
  • ...

Now we ask the question, how fast does our bacteria population grow (in percentage terms)?

The number of bacteria cells one minute from now is:

nt+1=2nt

Which implies the minute-over-minute growth rate is:

nt+1nt1=2ntnt1=21=1

or 100%.

This is an example of perfectly compounding growth, also referred to as exponential or geometric growth.

Put simply, how fast the bacteria grow is entirely independent of population size. In other words, growth and scale are perfectly uncorrelated.

Importantly, most things do not work this way.

Layering on

Let's look at another example - constructing a brick wall.

Assume a bricklayer can lay 10 bricks per hour. The brick count will proceed as follows

  • 0
  • 10
  • 20
  • 30
  • 40
  • ...

The brick count grows by 10 bricks per hour.

Going through the same growth rate calculations from above:

The number of bricks 1 hour from now will be:

nt+1=nt+10

Which implies hour-over-hour growth is:

nt+1nt1=nt+10ntnt=10nt

Notice that the growth rate depends on how many bricks we've already laid. This is linear or arithmetic growth. Because the number of bricks laid each hour is static through time, growth (in percentage terms) necessarily slows down. Scale is in the denominator. Therefore, growth and scale are negatively correlated: more scale -> less growth.

Sure, initially we are growing the brick count quite fast - 100% in fact. But by the time we reach 30 bricks, our forward-looking growth rate has fallen to 33%. At 100 bricks, we'll only be growing 10% - which is a far cry from our halcyon days of tech reporters and venture capitalists gawking at our growing (tech enabled) bricklaying operation.

Two flavors of growth

The key difference between the bricks and the bacteria is that one has scale invariant growth (SIG) and the other... doesn't.

OK OK, friends who reviewed this before publishing said that was a big word/phrase to suddenly drop. So let's take a step back and examine this phenomenon visually before moving forward.

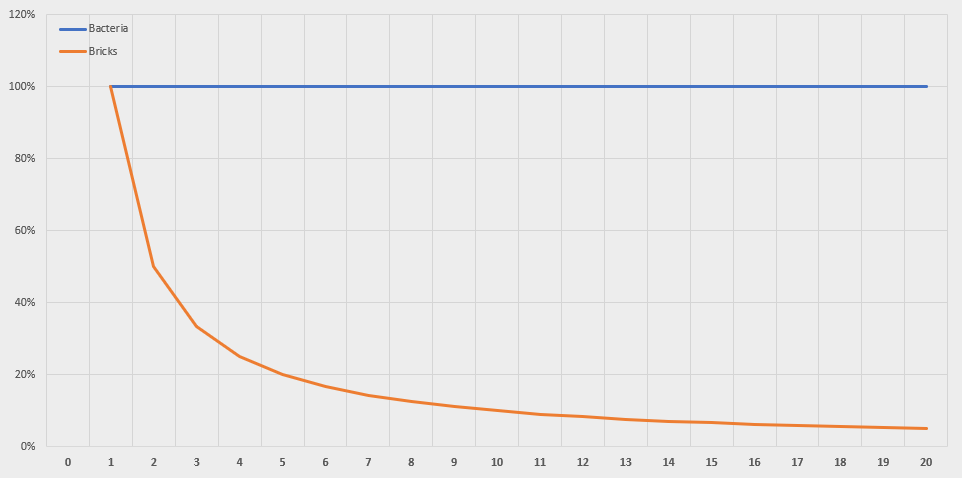
A great way to do this is plot the growth rate of the bacteria and bricks over time:

bacteria-bricklayer-1

The bacteria grow at a constant rate over time. For the bricklayer, growth simply... collapses.

I've plotted this chart hundreds of times over the years, and for most startups the growth plot looks eerily similar to the bricks here.

Growth is not the natural order; growth cannot be taken for granted. As we get larger, we get slower.

I mentioned correlation earlier. The correlation between growth and scale in the case of the bacteria is 0 - perfectly uncorrelated.

For the brick count, the correlation is -0.7, a very strong negative correlation.

We've now established two ends of a spectrum we can use to characterize various forms of growth.

On one side, we have linear/additive/arithmetic/correlated growth, and on the other we have exponential/multiplicative/geometric/uncorrelated growth.


The question now is, where do various things fall along this spectrum? Said another way, how accurate is it to say that "XYZ" grows in compounding fashion?

Let's walk through some more examples.

Debt

Compound growth is often used in reference to compound interest earned on a financial instrument of some sort.

Anyone who has ever suffered through mounting credit card debt knows this quite well. Debt grows like bacteria - it multiplies without end at a rate that depends entirely on the interest rate and not at all on the current balance.

1%, 5%, 10% - whatever the interest rate, unless paid off, debt continues to grow without end. If only paid off partially, the remaining balance will continue to grow.

Not a bad business model if you ask me.

World GDP Per Capita

Growth is not the natural state of affairs. For most of human history there was no meaningful economic growth or improvement in livings standards for the average person. Until recently, Life was nasty, brutish, short and... static:

gdp-world

Unless growth is literally contractual, as in the case of debt and interest, we can't take it for granted, as history plainly shows.

And it's not simply a question of the scale of the axis. If you zoomed into that long straight line, you wouldn't see a hockey stick growth pattern. Living standards actually did not improve meaningfully over time for the vast majority of human existence on this planet.

A few years of bad weather, major epidemics like the Black Death (the bacteria strike again), social upheaval - these events drastically impacted the day-to-day well-being and lives of our ancestors, often erasing decades of progress.

Even today, many parts of the world experience major swings in their rates of growth, especially within the developing world. Regions and countries can end up in severe economic doldrums, leading to entire lost generations.

Many stops and starts, fits and spurts.

However, before we get too depressed, let's look at a best case scenario.

U.S. GDP

The good ol' US of A ('s real GDP):
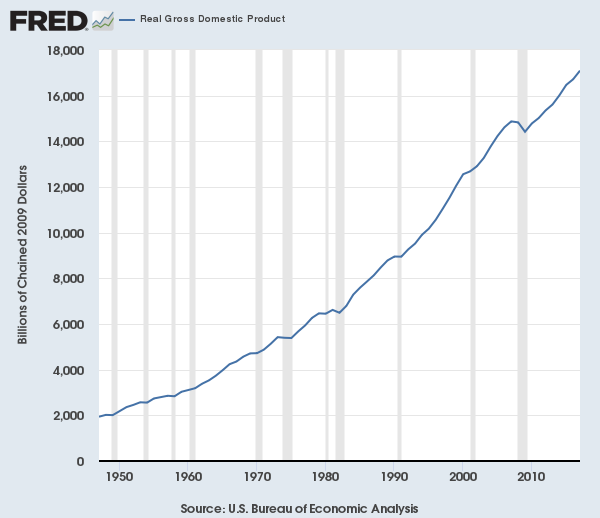
Looks pretty good huh? Let's look at the growth plot:
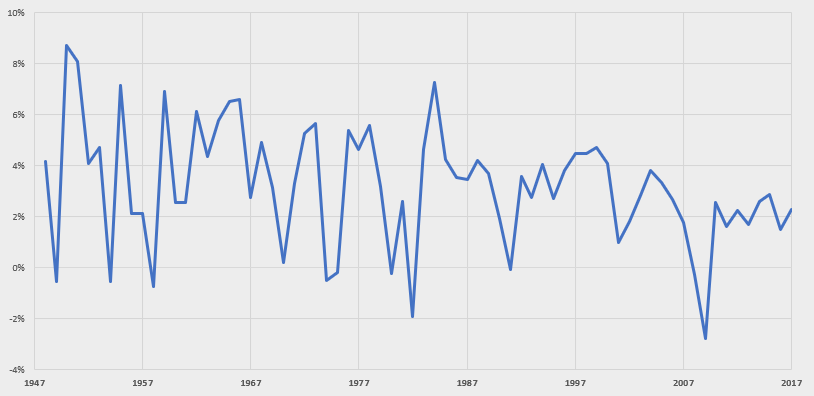
realgdpgrowth


Ugh, this is pretty noisy. It's difficult to tell if growth is changing in significant ways year-to-year or if it is generally variation around a certain value.

This view hides some interesting detail. One neat math trick - taking the natural log rescales a metric such that, when graphed, linearity implies constant growth.

Do this, and the real GDP chart becomes:
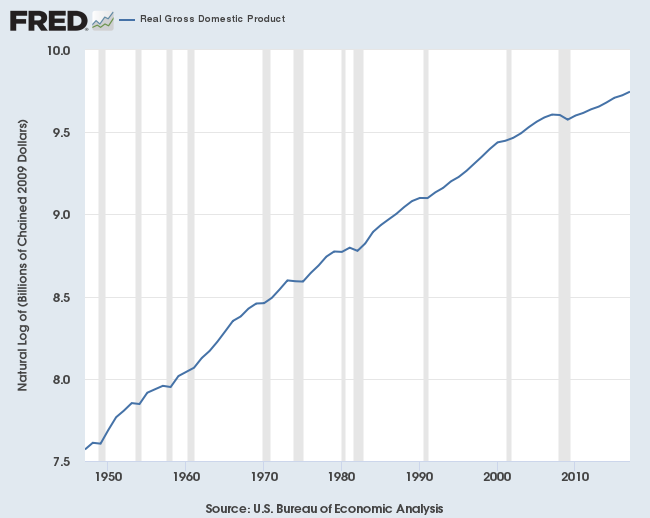

Over this period, we can make a few interesting observations:

  • Log real GDP is impressively linear - one could fit a linear line to the above data fairly well, implying reasonably constant growth
  • That said, it is not perfectly linear, and therefore not perfectly compounding, per our earlier definition
  • We can see multiple distinct inflection points where growth changed, in connection with recessions (1970, 2008)

Taking advantage of these kinks in the curve, let's estimate the growth during each period through piecewise linear regression (i.e. the "line of best fit" for each period):


logrealgdp-piecewisereg

Annual real growth goes from 3.9% in the 1947-1970 period, to 3.1% in the 1970-2008 period, to 2.1% in the 2008-2017 period.

The economists yelling and screaming that we are on permanently lower trajectory after the most recent recession may have a point.

So not exactly constant growth, but still impressive given the real economy grew 8x+ over this period. Growth has roughly halved over a 70-year period.

In terms of the connection between growth and scale, the correlation here is -0.3, which certainly indicates a relationship, but not a strong one.

We can therefore conclude that U.S. GDP grows in reasonably compound fashion.

Revenue

Most businesses see their revenue growth rate tick down over time. This is even more true for companies that are growing quickly today.

On the other hand, some exceptional businesses have managed to drive truly compound growth over long periods.

Take Amazon for example, which has exhibited incredible revenue growth over time ($B):
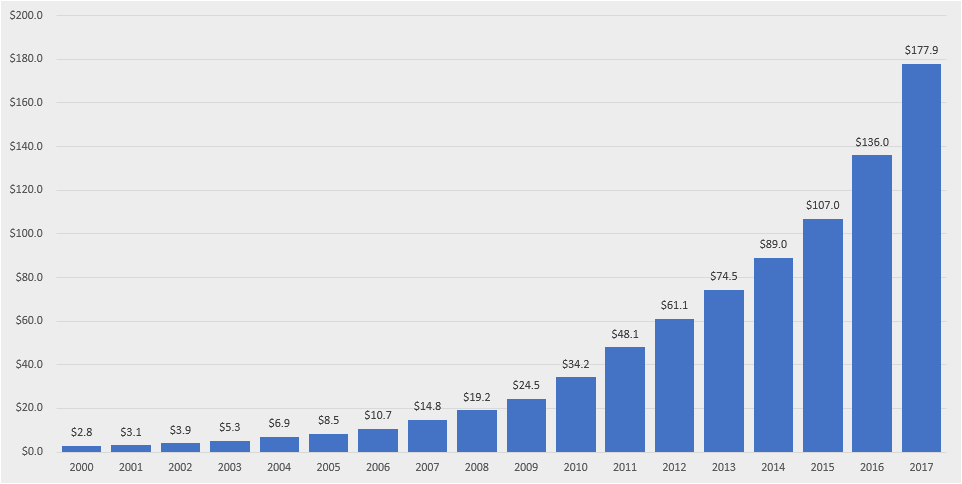
amzn-revenue

This is an impressive chart in its own right. But I am actually more impressed by the log-transformed chart, which is nearly a straight line:
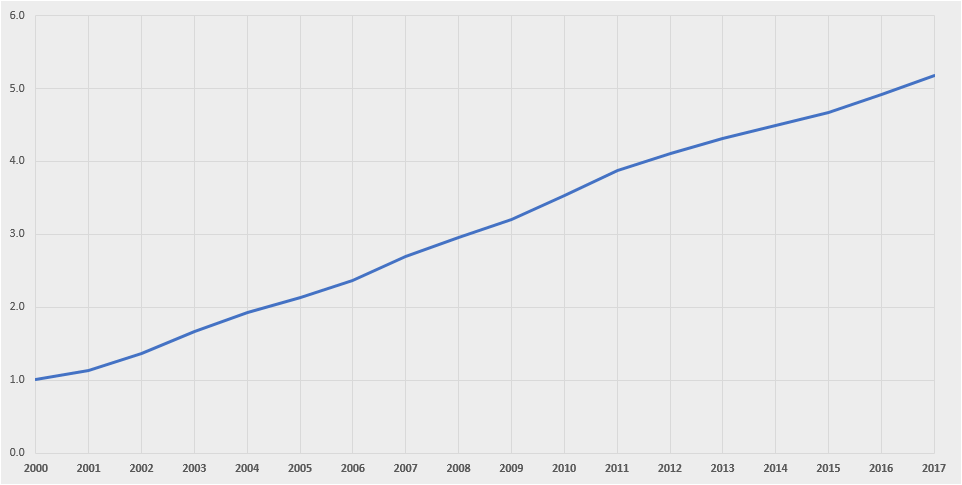
amzn-logrev


Amazon has grown at a nearly constant rate over almost two decades, despite increasing scale by 64x over the period.

At best, one could identify a slight kink in growth in 2011. Replicating the piecewise analysis, we can see that Amazon grew ~30% year-over-year from 2000 to 2011 and ~23% year-over-year from 2011 to 2017.
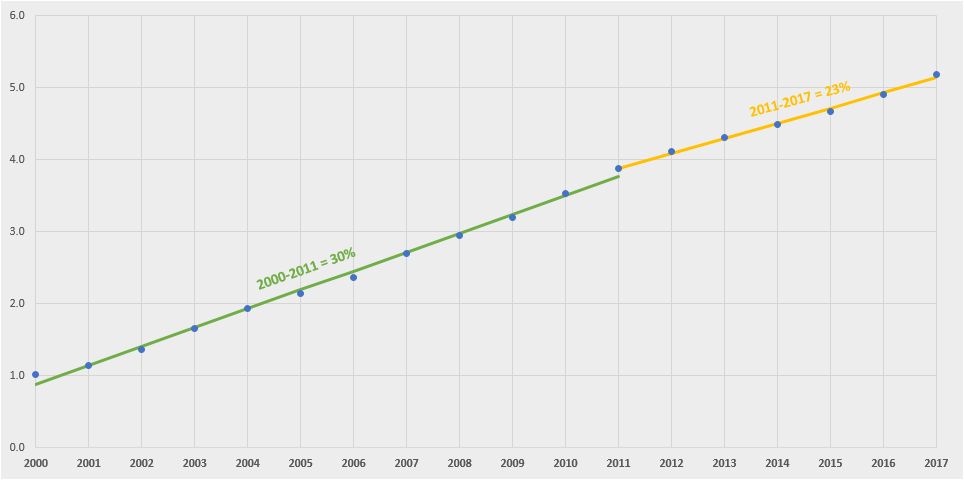
amzn-logrev-piecewisereg


Amazon's growth-scale correlation? -0.1!

It's hard to put into words how impressive that single number is. Worth reiterating: most things do not work this way.

Amazon is an exceptional business that has evidently identified a way to grow at a nearly constant rate over many years. A combination of tapping into the long-run secular growth of e-commerce and deft expansion into seemingly orthogonal spaces (for example, via Amazon Web Services) that in fact leverage the core infrastructure the company's built up over time has enabled it to grow in bacteria-like fashion.

Growth functions: Are you adding or multiplying?

Every growing business needs an honest answer to this question: Is your business growing through multiplication, like the Amazonian bacteria, or addition, like the brick wall?

Businesses that simply "add" must necessarily slow down, by the simple math we outlined earlier. Scale begins to work against you, making it harder and harder to maintain a rapid growth pace. Eventually, you will, figuratively, hit a wall.

An example of an additive growth function is paid customer acquisition through a channel like Google Adwords.

Spending $100 on Adwords is going to generate some number of users. Spending another $100 is probably going to generate a similar number of users, and so on.

There's no "magic" here. This is "buying growth" in the most direct manner.

If anything, customer acquisition through paid channels that you do not control (and Adwords is the epitome of this) tends to get less efficient over time as you saturate keywords etc.

Like a bricklayer at the end of a long day, businesses reliant on this form of growth tend to run out of gas sooner or later.

Sure, you can attempt to stack bricks at a faster and faster rate, raising venture capital when you can no longer self-fund the endeavour, building the wall ever higher...

But this too will pass. Eventually, some proportion of those users must stick around and continue to buy from you without meaningful additional spend on your part, otherwise you'll find yourself on the proverbial "acquisition treadmill", unable to jump off without significant disruption to the business.

A number of companies in the subscription e-commerce "send me a box with a psuedo-random assortment of goods" space fall squarely into this category. Users churn at high rates, requiring more and more fuel to be poured on the paid acquisition fire to keep the train going.

On the other hand, businesses that "multiply" can grow indefinitely. Their "growth functions" are inherently multiplicative. Users beget more users. Revenue begets more revenue.

The classic exponential, multiplicative growth function is the viral word-of-mouth (WOM) or referral program.

PayPal built a viral engine in its early days, giving users money for each additional friend they referred to the service:


Dropbox replicated this, giving out additional space for signing up friends:


The act of sharing a Dropbox file or folder with someone who wasn't yet a user generated even more sign-ups:


Whatever the approach, it is vitally important that every business vigorously search for and identify exponential growth opportunities. It is mathematically inevitable that an additive, linear growth engine that does not compound on itself will eventually peter out, or even collapse like a wall built too high.

Likewise, investors must diligently sift through the noise to find the few bacteria-in-a-hay-stack that will drive true, long-term value creation. Ignore the steep trajectory in the short-run. Instead, focus on the curvature of the horizon.

Scale invariant growth is the key to building a large, meaningful business.

Go find it.

Nnamdi Iregbulem

DevOps, application infrastructure, and machine learning nerd. Soft spot for developers ❤️. MBA @Stanford | Ex-Product @confluentinc | Former VC @ICONIQ Capital | Economics @Yale


https://whoisnnamdi.com/you-dont-understand-compound-growth/