Showing posts with label 10 baggers. Show all posts

Monday 7 September 2009

Meet a “Ten Bagger” in less than 6 months!

Meet a “Ten Bagger” in less than 6 months!
Wednesday, January 2, 2008


When I first spotted this stock back in June, it was just like another penny stock at 17 . Today six months later the stock is at 191. That is 11 times its price!

The stock is VB Desai Finance and please look at the chart below. In December alone, it has moved from 90 levels to 190+ levels.

The only way you can make money in such stocks is through trend trading. A “buy and hold” never works here! Right entry and right exit are the key to making money.

For your information- the stock had moved from 2 to 32 during 1999-2000 and then fell back to 1 in 2001!


http://sagecapital.wordpress.com/2008/01/02/meet-a-ten-bagger-in-less-than-6-months/


Comment: Unlikely to be an investment grade stock. So much volatility. Usually avoided by those who buy and hold.

Checking out the multi-baggers

Checking out the multi-baggers

2009-05-24 10:01:25


If you were keen on buying the multi-baggers in this particular rally, you should have bought small-caps from the beaten down realty and infrastructure sectors on March 9.

Thirty-eight of the BSE-500 stocks were multi-baggers in this rally, delivering a threefold or higher gain to their investors. The Sensex rose 70 per cent in this period.

Realty/infra lead from front

The real estate and infrastructure sectors would have been the last to be picked by fund managers had they been asked to pick out-performers in March. While the former was grappling with dwindling demand and a severe liquidity crunch, the latter was feeling the effect of a capex slowdown. But both sectors have surprised, with more than half the list of multi-baggers coming from them.

Housing Development and Infrastructure Ltd. (HDIL) tops the multi-baggers list, with a five-fold price increase over this period. A recovery from a very low valuation and a unique business model made it stand out from its competitors.

B.L. Kashyap and Sons, Orbit Corp, IVR Prime Urban and Mahindra Life Space Developers were the top real estate gainers while Housing Development and Infrastructure, Reliance Industrial Infra- structure and Hindustan Construction led the infrastructure gainers. Fifteen of the 38 multi baggers came from these two sectors. Depite the trepidation about the rupee wreaking havoc on IT companies, a few stocks from the sector did make it to the multi-baggers list - NIIT, Everonn Systems and Tanla Solutions.

Small-cap bias

Predictably, a clear small-cap bias was observed among stocks delivering manifold gains.

Twenty-eight of the 38 stocks that delivered fantastic returns by tripling in price were small-caps (market capitalisation less than Rs 2,000 crore). Reliance Industrial Infrastructure, B.L. Kashyap & Sons and Orbit Corporation topped small-caps.

Of the remaining, nine were mid-cap stocks. HDIL is the top gainer both in the BSE-500 and BSE Mid-cap space. Reliance Capital was the lone large-cap that notched up threefold gains.

Though multi-baggers were rare in the Sensex pack, a few index stocks did see prices double.

Seven stocks of the Sensex 30 saw prices rise over 100 per cent since March 9. The top index gainers were ICICI Bank (up 156 per cent), Reliance Infrastructure (up 152 per cent) and DLF (up 147 per cent).

Low price

If you didn't pick realty or infrastructure on March 9, you may have done equally well betting on stocks with a low absolute price. It bears mention that 28 of the 38 multi-baggers traded below Rs 100 on March 9.

More India business stories

Nineteen of them languished below Rs 50 before the rally. This clearly points to the investor fancy for low-priced stocks.


http://sify.com/finance/fullstory.php?a=jfykbzcdeaa&title=Checking_out_the_multi_baggers&tag=Investors

To find a mystical 10-bagger you must ignore all the froth

To find a mystical 10-bagger you must ignore all the froth

By Luke Johnson
Published: 12:01AM BST 07 Aug 2005

One of the best books of modern times about investing was published in 1989 and is called One Up On Wall Street. It was written by a clever fund manager at Fidelity, Peter Lynch, and it introduced me to the concept of "10-baggers", the Holy Grail of investing.

Ten-baggers are shares where you make 10 times your money (I believe the phrase is derived from baseball). Such opportunities are rare, but I have been fortunate enough over the past 15 years to be involved in a few such situations: Pizza Express, Topps Tiles and Abacus Recruitment among them.

There tend to be some common characteristics among these winners. The businesses all operate in growth industries and the company in question must be able to grow the top line. No one ever made a tenfold return on a pure margin improvement, or cost-cutting story with no sales growth.

Turnarounds are, however, a rich source of 10-baggers. For these to work, one's timing has to be immaculate, and the underlying business has to be sound - just desperately unloved by the stock market.

Those two retail recovery stories, Next and French Connection, come to mind: both have been 10-baggers for those who bought at the bottom in the early 1990s. Recessions and downturns will occasionally reveal such gems, decent firms with temporary problems which can be cured.

Such returns need patience. A hedge fund that churns its holdings every few months will never enjoy a 10-bagger. And therein lies the greatest danger: selling too early to enjoy the 1,000 per cent gain.

When you have doubled or trebled your money, it is so tempting to cash in profits. It must have been tempting in the early 1950s to take profits on Glaxo shares, just a few years after their 1947 flotation. Or to have done the same for Tesco which floated in the same year. Or sell Racal in the late 1960s after its 1961 market debut, decades before it spun off Vodafone. Yet each of those shares rewarded patient investors with epic performances over many decades, all 20-baggers at least, not even allowing for dividend.

One of the advantages that private equity enjoys is that it is forced to take a reasonably long-term view, and so is usually unable to rush for the exit at the first opportunity. Venture capital's other edge over quoted investors is debt: gearing in successful situations always amplifies the return to equity-holders. Typically, buy-outs have structures where 70 per cent of the capital is borrowed.

Quoted companies probably have the reverse capitalisation, with equity providing three-quarters of the funding. And as ever in investing, those who regularly find 10-baggers say you should stick to your own sphere of competence: buy what you understand.

A good source of 10-baggers has been privatisations.
Of the 43 public-sector companies floated in London, at least four have returned more than 10 times their issue price: Associated British Ports, Amersham, BP and Forth Ports. Proof, I suppose, that governments tend to sell state assets cheaply, or perhaps that such organisations thrive in private ownership.

While the UK has few such businesses left to flog off, there are a number of countries such as France and Turkey that have active privatisation programmes where there might just be 10-baggers waiting to be discovered.

Indeed the UK is a mature economy and therefore finding new sectors - and stocks - experiencing sustained, rapid growth is harder than ever.

It may well be that the most exciting investments are in emerging economies which are expanding quickly. Luckily capital markets like Aim are attracting dozens of foreign companies looking to raise money, so British investors do not necessarily need to buy shares quoted on overseas exchanges. But the usual rules apply: look for real companies with competent management and a proven business model.

You won't find a 10-bagger among much of the over-hyped, speculative froth that comes to Aim. Search for the solid operation with strong fundamentals and a high quality of earnings.

Very few acquisitive vehicles are 10-baggers. Management in such firms focuses on doing deals rather than organically growing its core business. This can produce reasonable returns, but rarely delivers the stellar, long-run performance that can come from a strong business franchise in an attractive niche. And balance sheets matter: 10-baggers must be able to fund expansion internally or through debt. Companies that are forever issuing equity dilute their stock performance.

So good luck in your search for the next blockbuster. It may well be an obscure, neglected company now, but with the potential for greatness. The secret is to spot that potential.

• Luke Johnson is chairman of Signature Restaurants and Channel 4


http://www.telegraph.co.uk/finance/2920265/To-find-a-mystical-10-bagger-you-must-ignore-all-the-froth.html

Sunday 6 September 2009

Peter Lynch and the ' Ten Bagger '

Peter Lynch and the ' Ten Bagger '

Peter Lynch, the fund manager legend from the Fidelity Magellan fund first used the phrase ' ten bagger ' in his excellent book, One Up On Wall Street. The term actually comes from baseball, but Lynch uses it to describe stocks which have risen in value by ten or more times! To the amateur or newbie, the idea of making a 1,000% profit may seem a little extreme, but Lynch built a reputation and his fund on this very ability.

For example, in the UK between July 1996 and July 2006, there were a number of companies that can be described as ten baggers. In fact, there were 19! A few had passed the 1,000% growth mark and then fallen back in price, but the opportunity was there.

The largest of these share prices grew by a staggering 3,049% (Anglo Irish Bank Corporation PLC), the lowest was Goodwin PLC, up by a very respectable 904%.

Other notable performers included: Numis Corporation PLC at 2,021%, Savills PLC at 1,271% and Amstrad PLC at 997%.

As you may imagine, this period included the dot com boom and bust, so companies that showed amazing growth, only to lose the vast majority of the gains are not included in the 19.

The sectors which are best represented in the list of 19 ten baggers are not what you might expect. Rather than being the glamorous sectors like telecoms or mining, they are actually finance, real estate and construction.

UK stock market legend Jim Slater described in several of his books that, 'elephants don't gallop'. The companies seem to prove him to be correct as the majority of the firms are small by FTSE standards (even after the tremendous growth).

Peter Lynch revelled in the fact that his family could spot rising stock market stars before Wall Street could.
Thus, his theory that with the right mindset and effort, anyone could become a successful investor. Having spotted firms that seemed to be trading successfully and had products that people wanted, he would then swing into action and investigate thoroughly.


To read more related articles, please visit:

http://www.stockexchangesecrets.com/ten-bagger.html

Stocks cannot go up ten fold, unless they first go up two and four and six and then eight fold.

It's all about the next 10 baggers !

However stocks cannot go up ten fold, unless they first go up two and four and six and then eight fold. This is an indisputable fact on Wall Street, where very few things are factual or indisputable.

If a stock is going to go up 10 fold, odds are it will sooner or later show its face.


http://nationalstockreview.ning.com/

How to pick multi-baggers

How to pick multi-baggers

Here is the Motilal Oswal guide to hitting sixers in the stock markets

N Mahalakshmi / Mumbai March 29, 2004


"To achieve satisfactory investment results is easier than most people realise; to achieve superior results is harder than it looks."
- Benjamin Graham


For most investors in stock markets, all that matters is a couple of stock tips which can make them really rich. Just a few stocks which could probably multiply some 10 or 20 times in value.
And it is not that stock markets do not present such opportunities. Of course, they do. Unfortunately, ordinary investors lack the vision to spot such opportunities.

During 2003, for instance, there were 734 companies which tripled in value and created wealth of at least Rs 100 crore. How many of these stock did you own? For many of us, the answer is probably none.

But don't fret. The market is going through a corrective phase now, presenting investors with a good opportunity to pick up stocks cheap. And to help you do that we bring to you insights from the Motilal Oswal Wealth Creation Study for 2003 which analyses the process of wealth creation in mutli-baggers.

Some hot tips from the study and with a little bit of luck, you could expect to buy into some mutli-baggers which can change the complexion of your portfolio.

Here are the key lessons from the study:
■Bad businesses can never create a multi-bagger, though they can create transitory multi-baggers during short phases when the conditions are good.
■Bad managements with good businesses are likely to create only transitory gainers.
■Overpriced shares have no chance of becoming multi-baggers ever.


So the only way one can hope to find lasting multi-baggers is by buying into great businesses run by good managements purchased at huge margin of safety.

When can you find multi-baggers?

According to the study, every period is not amicable for a multi-fold increase in stock prices and unless there are more than 25-30 multi-baggers of reasonable sizes spread across industries in the market, it is quite likely that the common investor would miss an opportunity to spot them.

A study of the bi-annual data of all the companies since 1990 reveals that the latest bull run has seen the maximum number of triplers with at least Rs 100 crore of net-wealth created in two years. The study also reveals that the bull run of 2003 is different from the bull runs in 1998-2000 and 1990-92.

This time, the study says, the rally provided a conducive environment to find multi-baggers in general. The factors that propelled the bull run were:

■Drop in interest rates from 12 per cent to 6 per cent

Values in business markets are relative. The relative valuation of stocks over bonds has increased significantly. It was at the historically highest level of 1.53 in March 2003. It was at its worst at 0.13 when the Sensex P/E was 70 in 1992.

The Sensex rally in 1998-2000 was very sector-specific and it did not have a non-tech earning support. The Sensex tech weight was quite limited and the rally could not sustain at a relative value of 0.32.

■Acceleration in corporate earnings

Drop in the interest cost has led to an increase in the corporate profits. Last year, corporate profits went up by 44 per cent even though sales growth was only 11 per cent because interest cost was very muted.

■Severe depreciation in 2003

Though the relative value increased, investors remained at a distance from the stock market in 2002-03. They decided to put their money in bonds because bond prices were going up whereas stock prices were falling. Now that the bond rally is over, investors will flock back to stocks.

Why some multi-baggers destroy wealth eventually

Having said that, it is not that one could get rich for ever by buying multi-baggers. The study says there are two types of multi-baggers: Enduring multi-baggers and transitory multi-baggers.

Enduring multi-baggers are those companies whose wealth creation is long-lasting and correction from the peak valuation is limited. In fact, they continue to exist as multi-baggers even after the correction.

Top enduring baggers

Company
Net wealth created (Rs Cr)

Wipro
36322.49

Infosys Technologies
33738.74

ICICI Bank
16221.37

Satyam Computer Services
10196.78

HDFC Bank
7968.43

Cipla
6607.20

Sun Pharmaceuticals Ind
5208.66

Moser Baer (India)
2801.60

Zee Telefilms
2387.25

Nirma
2226.75


The enduring multi-bagging companies like Infosys, Wipro, HDFC Bank, Dr Reddy's, Hero Honda and Cipla are typically few and difficult to be spotted, and most of the time they appear to be expensive at the time of buying because of the lack of faith in their longevity and size of growth.

Transitory multi-baggers, on the contrary, are easier to be spotted but they always end up giving nasty end results. Corrections are typically almost 100 per cent. Cyclicals broadly come under this category. The tragedy with this class of companies is that if you cannot sell in time, nothing is left in your hand.

Top transitory baggers

Company
Net wealth created (Rs Cr)

Pentamedia Graphics
-1238.35

NIIT
-1050.78

Silverline Technologies
-1008.99

Pentasoft Technologies
-911.24

Trigyn Technologies
-763.68

SSI
-493.21

DSQ Software
-379.38

Himachal Futuristic
-318.05

Morepen Laboratories
-253.91

Vikas Wsp
-170.69


But as correction is inevitable, market as a whole is left high and dry with a bad experience. These companies are plenty and easy to be found, and they attract a lot of crowd.

The study looked at the sustainability of the companies that were multi-baggers during the period between 1998 and 2000 when 115 companies more than tripled. The assumption: All these stocks were purchased on April 1, 1998, and sold on December 31, 2003.

The result reveals that most of the multi-baggers were transitory in nature during this period and they threw back all the wealth that had been created on their journey upwards.

What is the winning strategy?

"Stocks are simple. All you do is buy shares in a great business - with managers of the highest integrity and ability - for less than the business is intrinsically worth. Then you own those shares forever."
- Warren Buffet


According to Raamdeo Aggarwal, managing director, Motilal Oswal, there are three factors investors must look at: Business, management and the price of the stock relative to its value.

Business:
Improvement in business conditions leads to a change in earnings trend. That is typically the starting point of dismantling the pessimism on the stock. The study finds that a positive change is a must for any type of stock though such change can be temporary or permanent.

The problem arises when the business condition or the opportunity is temporary in nature. Take the example of private banking system - the switch in favour of private banking system is long lasting and permanent in nature. Similarly the changes happening in businesses like pharma, infotech services, auto ancillary and consumer non-durables will have a lasting impact.

However, the changes in fortunes of businesses like steel, cement and shipping are driven by mere price changes and, hence, transitory in nature.

Management:
Management plays a major role in creation of enduring multi-baggers. But how does one judge whether a management is good or bad?
The study examined capital allocation of some companies. It is clear that SSI could not manage its capital allocation properly while Infosys could make a come-back due to its superior and sustained capital productivity.

The study observed that in businesses like banking and pharma, the importance of management is clearly visible. As the assessment of new private sector for the period 1998-2003 reveals, good managements can make a difference to the wealth created. For instance, HDFC Bank gained 361 per cent in market-cap during the five-year period when its net worth grew by 687 per cent. At the same time, Global Trust Bank saw its market-cap erode by 73 per cent as its net worth was down 99 per cent.

In cyclical businesses, management efficiency is even more necessary because every business cycle brings different challenges. Allocating capital at the time of cyclical downturn requires a lot of conviction because it may be found to be against popular opinion. Similarly, resisting huge build-up capacity at the peak of the cycle requires insightful management. Hence, the contribution of good managements cannot be undermined in cyclical businesses, too.

In essence, weak managements will lead only to transitory gainers whereas good managements can shine only if business performance helps.

As per Warren Buffet: "With a few exceptions, when management with a reputation for brilliance tackles a business with a reputation for poor fundamentals, it is the reputation of the business that remains intact."

So it boils down to the fact that for the making of enduring multi-baggers, a good business with a good management is necessary.

Price/value:
"Have the purchase price be so attractive that even a mediocre sale gives attractive returns."
- Warren Buffet


One factor, which is absolutely important for making a multi-bagger, is gross under-valuation or huge margin of safety in price at the time of purchase.

The study refers to the work by Tweedy Brown and Co entitled What has worked in investing. Some of the pointers to under-valued stocks are one or more of the following:

■Low price in relation to asset value
■Low price in relation to earnings and cash flows
■Sustained purchase by insiders
■A significant decline in stock prices
■Small market capitalisation with growth


The study concludes that the above findings are relevant in the Indian context, too. Also, the best time to get a huge margin of safety is when:

■Business conditions are unfavorable and near-term prospects look poor.
■When low prices of stocks reflect the current pessimism either in a particular stock or in the market as a whole.
■When a large company's performance is hit and the pessimism is fully reflected in the price.


Low P/E and P/B works because:

■The reinvested earnings are substantial in relation to the price paid. The effect of large earnings addition year after year keeps adding to the intrinsic strength of the stock and, hence, can't be ignored by the market for long.
■The bull market is typically very generous to low-priced issues and thus will raise the typical bargain issue to at least a reasonable level.
■There could be chances of smaller companies with high earnings being taken over by larger ones as a part of diversification programme.


http://www.business-standard.com/india/news/how-to-pick-multi-baggers/147266/

Small Caps: Growing Value And Valuing Growth

Small Caps: Growing Value And Valuing Growth
03/26/01 11:35:03 PM PST
--------------------------------------------------------------------------------
by David Penn
--------------------------------------------------------------------------------

With the Nasdaq reeling and the economy teetering on the edge of a recession, why would anyone be interested in small-cap stocks and mutual funds? Growth, for one thing. Value, for another.


It's something that almost anyone can tell you: Small-cap stocks tend to outperform large-cap stocks on the way up and underperform them on the way down. This conventional wisdom, however, was turned on its head in the final, delirious years of the most recently ended bull market. As Greg McCrickard, manager of T. Rowe Price's Small Cap Stock Fund, put it in a recent update on the fund's strategy: "When the markets [are] really moving up and the animal spirits are in the market and people are feeling great ... people have historically looked to small caps to get that extra bit of performance. It didn't happen this time."

What did happen, according to McCrickard and others, was that large-capitalization stocks led the charge to dizzying heights in the spring of 2000 and were among the first, when the overly exuberant valuations of these large-cap companies became suspect, to come crashing down (Figure 1). While the market downturns of 2000 were widespread, the collapse of many large-cap companies may have been an opportunity for small caps. "Given that valuations were very extended for large caps and not so bad for small caps, when we finally had the correction that we saw, small caps actually did pretty well," McCrickard noted.


FIGURE 1: COMPARATIVE PERFORMANCE OF LARGE- AND SMALL-CAP STOCKS IN 2000. The Russell Large Cap Index was down 10%. The Russell Small Cap Index was down 5%.


Much of the wreckage from last year's stagnant Standard & Poor's 500 index and bearish Nasdaq was in the technology sector, so it is little surprise that many of the small-cap companies that did well were outside this arena. Richard Baker, a stock analyst for SmallCapStockNews.com, points to a number of small-cap stocks in the retail area that have done well. Many small-cap value names in the energy sector also fiddled a spritely tune while their technology and telecommunications brethren spent much of 2000 burning. As much of the excess in the stock market continues to drain out and more traditional valuation methods make a comeback, is it time for average investors to pay more attention to small-cap stocks?

WHAT ARE SMALL-CAP STOCKS?

The textbook definition of a small-cap, or small-capitalization, stock is a stock whose company's total market capitalization -- the market value of all outstanding shares -- is between about $350 million and $750 million. Small-cap companies, as one analyst put it, are the "disregarded, unrecognized backbone of America's economy." Often overlooked due to the lack of brand recognition and major institutional backing (some publicly traded small-cap companies have little, if any, analyst coverage, to boot), small-cap companies are nevertheless the small businesses that provide jobs to hundreds of thousands of Americans and often serve as important product suppliers and service providers for larger companies.

Why do small caps tend to outperform large caps? While there is no direct relationship between any given company's market capitalization and its future stock price, there is a strong relationship between a company's market capitalization and that company's ability to raise capital. A company's ability to raise capital to pay for growth and expansion, or to reduce debt, is a major factor in a company's ability to become and remain profitable, and for its stock price to appreciate. Smaller companies tend to have much less capital (in terms of overall assets) to devote to growth and expansion compared to larger companies. Issuing corporate bonds, preferred stock, secondary issues of common stock, bank loans -- all of these are more difficult for smaller companies (say, the RealNetworks of the world) than they are for larger companies (say, the General Electrics of the world).

As such, small-cap stocks usually feature higher risk-return ratios than large- or mid-cap stocks. In other words, because the risks are greater, the potential returns must be greater. This form of risk is often referred to as size risk and is among the risk-return questions that investors must ask themselves when they are searching for investment products to help them meet their goals. Size risk can also play a major factor in properly diversifying a portfolio of stocks or mutual funds. A mix of small-cap stocks in a portfolio overweighted with large-cap stocks can help sustain a portfolio's positive returns when larger issues are failing or not advancing as fast as an investor might prefer.

WHAT SHOULD INVESTORS IN SMALL-CAP STOCKS LOOK FOR?

Analyst Richard Baker has his own mnemonic to help investors remember the key characteristics of small-cap stocks that are likely to appreciate in value. His Miss acronym, which stands for management, innovative and value-added, sector, sales and earnings, helps screen out hundreds of small-cap stocks, making it easier for investors to focus on those small-cap companies that have a background of success and bright growth prospects.

"These four things actually precede a big runup in price appreciation in a given stock," Baker adds. With regard to management, he likes business development experience and, especially, subject matter expertise. Businesses started by industry veterans or those with significant academic credentials and accomplishments can often have insurmountable advantages over businesses initiated with little more than entrepreneurial enthusiasm. In the wake of the dot-com meltdown of 2000, Baker also casts a suspicious eye toward what he calls "concept stocks" -- the shares of companies that might be interesting ideas, but turn out to be lousy businesses. "They sound like a great idea," he points out. "But did they really have a market where they were generating existing revenue from customers who were really purchasing products or services?"

Another interesting aspect of Baker's methodology is his emphasis on sectors. "When you look at buying a house, you look at the proverbial three most important things: location, location, location," he reminds us. According to Baker, that's the same criteria we should keep in mind in selecting a stock: What sector or area of the economy or what industry will experience growth as a part of demographic changes, changes with technology, or changes of consumer needs? In trying to find small-cap stocks in the early stages of their growth phase, he suggests, looking at sectors can be especially helpful. On this score, some of the small-cap stocks that Baker has been impressed with recently include retailers Chico's Fas (CHCS) and Hot Topic (HOTT). (See Figures 2 and 3.)


FIGURES 2, 3: SMALL-CAP RETAILERS. SmallCapStockNews analyst Richard Baker sees strength in small-cap retailers such as Chico's FAS and Hot Topic.


As a small-cap portfolio manager, McCrickard considers his approach to be a quest for both earnings growth and reasonable share prices. "Through a combination of blending growth and value, we can have lower volatility with good returns," he explains. "We look for good businesses; we want to find companies that have reasonably clean balance sheets or the ability through generating lots of cash to get that balance sheet cleaned up pretty quickly."

Another plus as far as McCrickard is concerned is managements that have a large stake in their companies. "We like them to be on the same side of the table with us," he notes. "If they are not just employees, then they are thinking about building value over long periods."

He also thinks that studying sectors can help point the way toward areas of the economy that may be experienc-ing exceptional growth. Says McCrickard, "Really, the sectors of the market tell us where we ought to be investing." While chasing after sector performance can be a tricky game for the average investor, there is little doubt that many of the stocks that see dramatic apprecia-tion in value don't do so alone and are often part of an industrywide, sectorwide, or even economywide (in the case of our recently ended bull market) advance. "In 1993 it was health care, 1994 was technology. In 1995 it was biotech," McCrickard recalls. "You could buy biotech for less than cash on the balance sheet."

At present, he sees opportunities in the often-treacherous technology sector -- though he tends to be less sanguine on pure semiconductor stocks, for example, referring to them as the "tail end of the whip." Nonetheless, some of the companies he has been impressed by include Brooks Automation (BRKS), a company that makes robotic automation arms as well as software for the semiconductor industry, and ATMI, which manufactures consumables such as air-handling equipment for semiconductor companies. (See Figures 4 and 5.)


FIGURES 4, 5: SMALL-CAP TECH STOCKS. T. Rowe Price's Greg McCrickard thinks Brooks Automation and ATMI may be small-cap tech stocks worth watching.


"I know from being an active participant in the markets that a lot of large institutional shareholders are interested in small- and mid-caps," adds McCrickard. "I've made money in large-cap stocks. It is time to diversify and look at small caps."

David Penn can be reached at DPenn@Traders.com.


http://premium.working-money.com/wm/display.asp?art=124

The Search For The 10-Bagger Begins

The Search For The 10-Bagger Begins
03/23/06 12:10:21 PM PST
--------------------------------------------------------------------------------
by Thomas Maskell
--------------------------------------------------------------------------------

These promising stocks are elusive but not particularly rare.


Ever since Peter Lynch coined the phrase "10-bagger," investors have been searching for these elusive little gems. Defined as stocks that increase in price 10-fold, 10-baggers are elusive but not that rare. In any given year, you can find a few of them. If you lengthen your time horizon to two or three years, you can find hundreds of them. Of course, when I say you can find them, I mean you can find them after the fact. Finding them before the fact -- well, that's why we're here.

DIGGING FOR 10-BAGGERS
In a perfectly rational market, there would be no such thing as a 10-bagger. According to the magicians of manipulation, the market sees all and knows all. All available information is built into the price. Even some information that isn't available is stuffed into that price. So how can there be stocks that rocket from $1 to $10, or $10 to $100 over the course of a couple of months or a couple of years? There are two possible answers.
  • First, there are hundreds of companies increasing their sales and profits 10-fold, or
  • second, the stock market isn't rational.
A quick look at the fundamentals of most companies leads me to think the second answer is the best bet.

If the market isn't rational, how can a rational investor ever hope to spot an emerging 10-bagger? That's a tough one. But you can answer that question by looking at them to see if they share any traits. To do that, you will need a stock-screening tool like the one found at www.Reuters.com. Screening helps you identify a list of stocks that have risen in price by 100% or more in the past year. These are doubles, and while not all doubles are 10-baggers, all 10-baggers are doubles. So it's a good starting point.

I chose a one-year price increase horizon because that is the longest horizon available at Reuters. If your stock-screening tool identifies price increases spanning longer than one year, you will be able to skip the next step, which is to determine which of these doubles are potential or actual 10-baggers. A 10-bagger usually requires two or three years to mature, but it must at least double in each of three consecutive years. Thus, a one-year price screen only provides a clue to its existence. The screen may be highlighting the beginning, the end, or the middle of its move. You will have to broaden your time horizon to get a clearer picture of which doubles are truly 10-baggers.

To broaden the time horizon and narrow the field, I use www.BigCharts.com, another free service. Big Charts provides stock price charts for the majority of the companies you will uncover in your initial screen. Linked to these charts provided by Big Charts are select technical and fundamental data. Among the technical indicators are volume, the moving average convergence/divergence (MACD), the relative strength index (RSI), money flows, on-balance volume, and so forth. For the fundamentalist, there are rolling earnings per share (EPS), price/earnings ratios, and dividend yields. These are provided for time horizons ranging from one day to 10 years.


NARROWING IT DOWN FURTHER
To give you an example, using the Reuters screening tool, I uncovered 588 stocks that had doubled in the past 52 weeks. How many of those stocks are or will become 10-baggers? Big Charts will help me determine that, but looking through 588 stock charts is a daunting task. You will want to narrow the list by eliminating some stocks before you begin your chart search.

First, it's best to establish some list demographics. This will help you with your elimination criteria. For instance, the total number of stocks listed in the database is 8,915. The date of the screen was March 8, 2006. The 588 stocks featured by the screen are 6.6% of a total market. That is 588 stocks from a market whose major indexes were relatively flat. That is a very significant percentage of the total.

To help shorten the list, two descriptors may provide candidates for elimination: industry and trade exchange. The list doesn't show any industry preference. There are 79 different industries represented on the list. Since there are 190 industries in the database, it means that 6.6% of the stocks represent 42% of the industries. They are a very diverse group and span both low- and high-tech industries.

The list does indicate a significant concentration with respect to the exchanges. The OTC and NASDAQ have the lion's share of the doubles. Together, they account for more than 84% of the companies listed. By itself, the OTC represents 54% of those listed. The American Stock Exchange is better represented than the New York Stock Exchange, but neither achieves double-digit status.

There are a few more interesting demographics. For instance, the launch price of these doubles range from zero dollars per share (stocks priced below $0.01 are listed as zero) to $194.53 a share with a median beginning share price of $0.82. Another interesting observation is the degree to which these stocks increased in price. More than 100 of them were five-baggers within the 52-week time frame, with 57 of those stocks becoming 10-baggers within the year. The beginning price of these high-flyers ranged between $0.00 and $6.15 with a median launch price of $0.01.


The screen also provides some fundamental demographics. Most long-term investors would certainly argue that growth in a company's operational performance would be reflected in the growth of its stock's performance. A quick perusal of our list gives 10-bag hunters reason to doubt that. Of those stocks, 32% had a declining EPS during the year. Equally intriguing, 83% of them had three-year annual EPS growth rates that were listed as "NA" -- an indication that usually means these are newly listed companies. We will have to dig deeper to confirm that.

The sales growth is equally baffling. Of these companies, 25% had negative trailing 12-month growth rates. This statistic carried over to the three-year annual sales growth rate, with 27% being negative. EPS and sales growth are apparently not magic indicators. Fundamentalists, take note!

In stock analysis, a picture is worth a thousand words -- or, in this case, a thousand entries on a spreadsheet. But I'm not interested in blindly clicking through 588 stock charts on a computer screen. I need to narrow this list to something more meaningful. My first elimination criterion will be as practical as it is logical. The first stocks I will eliminate are those that won't make me any money. After all, that is the purpose of this search.

To make this first elimination, some simple math is in order. If we assume a 10-bagger and a trading cost of $25 per thousand shares, it is reasonable to eliminate any stock with a beginning price of $0.01 or less. The logic is simple. The cost to get into and out of the stock would be $0.05 a share. Add to that the cost of the stock and subtract it from the final price ($0.10 - ($0.05+$0.01) = $0.04), and your 10-bagger has turned into a four-bagger. Not bad, but not worth the risk. With this one calculation, we have eliminated 136 stocks -- 23% of the total.

You can use any elimination criterion that makes sense to you or reflects your risk profile. For instance, if you are like me and find the OTC to be somewhat untrustworthy, dropping OTC stocks from the list will eliminate 54% of the candidates. Other possible elimination criteria are industries (you may not like some), shares outstanding (drop the biggest numbers), or sectors (eschew the "old economy").


The key here is to eliminate based on criteria that are not causal. The search for a 10-bagger is a search for cause (and support) and effect. The effect is a 10-fold increase in price. The cause (and support) is the performance of the company or the madness of mobs or the manipulation of markets. Our hope in this venture is to determine why these stocks launched -- performance, madness, or manipulation? Keeping this in mind, it is unlikely that the exchange caused the price increase. In addition, given that more than 79 industries are represented in the list, industry is also an unlikely causal indicator. Other noncausal indicators include sectors and shares outstanding.

What I am going to do is eliminate all stocks with current prices below $0.10, all OTC stocks and all American depositary receipts. This will leave a total of 254 stocks in 55 different industries and listed on the three major exchanges (Figure 1). Now I have a list that is small enough to begin charting with.

Not only is the list smaller, but its character is different. For instance, only 24% of these stocks had trailing 12-month (TTM) EPS declines (versus 32% for the original 588). Sales growth was even more dramatic, with only 9.8% showing TTM negative rates (versus 25%). However, it is clear by the screens and the subsequent eliminations that the market is willing to bid up the price of stocks with declining fundamentals. What do they see that we don't? Maybe the charts will tell us.

Next time, I'll look more closely at the charts. However, if you want a head start, you can peruse the 254 charts listed in Figure 1 at your leisure. I start with a five-year weekly chart with volume, P/E, and rolling EPS indicators. Focus on the period just before the stock makes its move. Remember that you are seeking cause and support. What caused the stock to move? And what kept it moving?


HOMS QDEL IVAC MCU TFSM
AQQ BABY LUFK ANX AQNT
BFT ZVXI JOYG AVM ATRO
PKS SCHK JLG MTXX LMIA
NFLX SPNC JCTCF HITK CRDN
MIND TIE IIIN CBRX AMR
UHAL CUP IPII ALKS AAI
MAIN DXPE RMIX MNTA NICH
LUB FLS USG ASGN GIL
DBRN IIN ORA ESCL GIII
GES ABIX STRL ARP LKQX
URGI GHM MVCO AIX RUM
PETS BLD FWLT TGIS LBIX
OATS FLOW WVVI ASF HANS
GAP CMCO LMS ADST NUVO
FC CECE DESC FTK RGEN
ILMN ERS PLXS RTK CELG
OYOG ARS ELTK BBC ABAX
BRLC BGC XWG SIRF PDLI
AXTI BOOM MFLX RBAK LIFC
ESLR WIRE PWEI RWC NVAX
NMGC BXL CMT CELL POZN
BTUI HOM NWD STXN ABGX
TRID ACLI MED GLW REGN
ANAD AIRM ICON CIEN ALNY
ASYT MDM AUY OPTC GNBT
RMBS GGR SA BKHM ADLR
CVV GMXR TRE ITRI VRTX
BRCM TGC GRS NOIZ VPHM
WFR GPOR CLG FNSR ZONA
EMKR TMY DEZ IFO CBST
DIOD SWN MNG RCCC RNAI
ASYS ABP MRB TWTC CYTX
NETL FTO DMX INLD AMLN
MPWRE FPP SVL SBAC CERS
AMD PLLL SKP DCEL ARNA
LPSN ARD GROW NWRE AVII
ARTG APAGF ITG LANV RNVS
BITS MEK DHIL BWNG MYOG
SILC TGE NDAQ SNTO NRPH
VTAL ALY EFH PANL BCRX
CRM NTG TRAD TALX KNDL
HCO ENG CME GIGM ACAD
LGTY MDR AX TRDO BMRN
NUAN SWB ATI KNOT THLD
AZPN GAIA BSM AKAM CGPI
ICCA RONC NURO RATE AOB
ATEA NTRI HOLX KOMG HBX
LNUX DIET CASM SNDK QSC
INFA CVO NMTI LCRD ISV
PRLS CTTY RHAT ININ

Figure 1: FIVE-YEAR WEEKLY. These charts can give you a head start on looking for 10-baggers.


Thomas Maskell is an amateur investor with a large risk aversion and a small nest-egg. In addition, he has a degree in engineering and a master's degree in business administration, which means he knows just enough to be dangerous but not enough to be rich.

http://premium.working-money.com/wm/display.asp?art=633

Search For The 10-Bagger Fundamentals

Search For The 10-Bagger Fundamentals
07/03/07 04:53:06 PM PST
--------------------------------------------------------------------------------
by Thomas Maskell
--------------------------------------------------------------------------------

Though they may not be particularly rare, these elusive stocks hold promise nonetheless.


Recently, I received an email from a Technical Analysis of STOCKS & COMMODITIES reader inquiring if he had missed the follow-up articles in my series on searching for 10-baggers. I had to tell him that he had not missed them because I had not written them, having been distracted by a more pressing writing deadline. However, I promised to use his email as inspiration, which brings us to our subject today: finding 10-baggers using the techniques of fundamental analysis.

REVIEW
Figure 1 illustrates a typical 10-bagger. It is defined as a stock that increases in price 10-fold within a three-year period. Thus, it doubles in price every year over that period. Of course, 10-baggers aren't always typical; some may explode to 10-bag status in mere months, while others may lumber past the three-year time limit. Still others may go beyond 10-bag status to become 20-, 30-, and even 50-baggers. But they all follow the basic pattern shown but not necessarily the same time frame or maximum price.

Also illustrated in Figure 1 is the basic dilemma of stock investing (or trading or speculating): the problem of perspective. When we analyze a stock, we are looking backward. When we buy a stock, we need to look forward. When we analyze, we are working with facts, relationships, trends, and history. When we buy, we are peering into a dark room hoping that the light from behind us will illuminate the room in front of us.


FIGURE 1: A TYPICAL 10-BAGGER. Here you see a chart of a stock that increases in price 10-fold within a three-year period.

Thus, investors must generate two sets of loosely connected data. The first set is historical. Its main purpose is to educate the investor as to how well a company (and its management) has met previous challenges and capitalized on past opportunities. The second set is predictive. Its main purpose is to determine how the company will handle future challenges and opportunities. The first dataset (the cause) will lead you to a good company. The second dataset (the support) will lead you to a good investment. We shall explore both.

THE FUNDAMENTALS
Investing is quite different from trading and speculating. Traders are game players, while speculators are gamblers. Traders and speculators buy stocks, while investors are business people; they buy companies.

There are three basic investment strategies: dividend, value, and growth. Of these, only dividend is a pure investment strategy. The other two are a blend of investing, trading, and a dash of speculation. But dividends have no application to 10-baggers, since 10-baggers rarely pay a dividend. Our investment approach to 10-baggers will rely heavily on the rules governing growth and value investing.

Another aspect of our fundamental analysis is confidence. By that, I don't mean bravado; I mean statistical confidence. The more statistical confidence you have, the less risk you have. They are at opposite ends of a continuum. The objective of any stock analysis should be to increase our confidence that the course we choose will be profitable. In our fundamental analysis, we will do this by comparing our selected stocks to the market as a whole.


LOOKING BACK (CAUSE)
The past and present are defined in Figure 1 as the area to the left of the move point. That is the point at which we must buy. It is like an entrance to a dark room. Beyond that entrance is the unknown. So let's compare what we know about 10-baggers at or before their move. Hopefully, their past performance will uncover some trends that carry forward into that darkroom.

Since most investors will agree that earnings drive the market, Figure 2 compares the earnings per share (EPS) of 30 recent 10-baggers to that of the overall market. About 75% of the 10-baggers have a negative EPS compared to just 10% of the overall market. Further, only 3% of all 10-baggers have an EPS over $1. The market has about 55% in the over $1 EPS range. If earnings history is our guide, 10-baggers are a poor investment.


FIGURE 2: EARNINGS PER SHARE (EPS) DISTRIBUTION. Approximately 75% of the 10-baggers have a negative EPS compared to just 10% of the overall market.

But history must be viewed over time in the search for trends and extrapolations. Figure 3 looks at the EPS of our 10-baggers before and at their price move — that is, the known data. Unfortunately, it simply confirms what we learned in Figure 2. In fact, as a group, the 10-bagger's earnings looked better a year before their move. Their median EPS was slightly better (-0.12 versus -0.13), and more of them were positive (35% versus 25%). If there was any EPS trend at the move, it was downward. Apparently, EPS trends would not help us spot these 10-baggers.


FIGURE 3: 10-BAGGER EPS. As a group the 10-baggers' earnings looked better a year prior to the move. The results here indicate that EPS trends wouldn't help to spot the 10-baggers.

In the absence of earnings, investors often look to sales to establish a valuation. The most useful sales valuation metric is the price to sales ratio (PS). In Figure 4, the PS of our 10-baggers is compared to the PS of the overall market. It is clear from Figure 4 that 60% and more of our 10-baggers come from just 22% of the market. We have found our first distinguishing fundamental metric. By narrowing our search to stocks with a PS of under 0.50, our confidence is increased from 0.4% to 1.1%. Not very high, but much better than a random pick.


FIGURE 4: PRICE-TO-SALES (PS) RATIO. More than 60% of the 10-baggers come from 22% of the market. By searching for stocks with a PS under 0.5, confidence is increased from 0.4 to 1.1.

We can do a similar analysis for several other fundamental metrics and achieve similar results. For instance, analyzing price yields a confidence level of 0.86%, twice as high as a random pick. You can also double your confidence with a P/E comparison. But confidence levels of 1% are not very encouraging, and while it may be possible to improve those results using multiple variables, I have neither the time nor the space to explore that here. So we will look to the other critical aspect of fundamental analysis — potential.


LOOKING FORWARD (SUPPORT)
To my knowledge, no one has a crystal ball. The best we can do is spot past or current trends, but a trend cannot continue into the future without support, and the support we seek depends on potential. In fact, the past is prologue only if it reveals potential. So let's explore potential from a fundamentalist's perspective.

Potential depends on two factors: capacity and leverage — in essence, the capacity of a company to become profitable and its ability to magnify that profitability through leverage. A company with excess capacity and ample leverage has tremendous potential.

Capacity is a function of sales and assets: How many units can we produce in a factory versus how many they are currently producing? A good fundamental measure of it is the sales-to-asset ratio (S/A). Figure 5 compares the S/A of the overall market to our 10-baggers.


FIGURE 5: VARIOUS CAPACITY AND LEVERAGE METRICS FOR THE MARKET AND 10-BAGGERS. Here you see a comparison of the sales to asset ratio (SA) of the overall market to the 10-baggers. The 10-baggers seem to mirror the market to the high side, which is a positive indicator.

Leverage allows the company to magnify or extract the maximum profit from a given increase in sales. There are several kinds of leverage at work in a company. They include operating leverage, financial leverage, and various other synergies such as economies of scale and learning curves. We will focus on operating and financial leverage.

Gross profit (GP) is one form of operating leverage. It represents the potential profit available from each additional sales dollar: the higher the GP, the higher the potential. For instance, a company with a net income of 1% and a GP of 35% would grow its profits 3,500% if it doubled sales and held administrative and marketing costs constant. That's the power of leverage. Figure 5 also compares the GP of the overall market and our 10-baggers.

A company can also magnify their profits through financial leverage. A good metric for assessing financial leverage is shares outstanding (SO). The fewer SO a company has in relationship to their sales, the greater the profit those sales will deliver per share. This is somewhat related to PS, but there is enough difference that it is worth looking at on its own. Figure 5 does that.

The S/A is a double-edged sword in that a low number represents excess capacity that could be used to grow the company. But a low S/A could also imply that the management is not efficiently utilizing the assets, which is a negative. The S/A data in Figure 5 suggests that our 10-baggers are at least as efficient as the market as a whole, and they have the capacity to grow sales. There are many more aspects that underlie S/A, but the fact that our 10-baggers mirror the market to the high side can be viewed as a positive indicator for now.

In fact, all the data in Figure 5 suggests that 10-baggers, from start to finish, tend to reflect the overall market when it come to S/A, GP, and SO. There is no significant difference on which to build a high confidence projection, but it does indicate those 10-baggers are not stepchildren — overlooked or unloved stocks. In essence, they are not "value" investments.


THE SAD CONCLUSION
What you can derive from the data presented here is that there is nothing in the past performance of these companies that would allow us to spot them before their move. They are not value plays, which leaves growth as our only viable investment strategy. But as Figure 6 illustrates, even growth is of little help to us. The median growth of our 10-baggers was only 2.98% before their move, well below the median for the overall market. The 10-baggers didn't outperform the market until after their price move was made. In most cases, the stock moves six to 12 months before the company moves. There is simply no fundamental reason to buy these stocks — no cause. Sadly, the only conclusion you might make based on the dismal growth rate of these companies is that they are frogs waiting to be kissed.


FIGURE 6: ANNUAL SALES GROWTH RATES. The median growth rate for the 10-baggers was only 2.98% before their move. Essentially, there is nothing in growth rates that would lead us to believe that the stocks of these companies are about to experience a 10-bagger rally.


Yet over the life of their move (three years), these stocks more than doubled the growth of the market. They do not blossom without support. Within one year of their move they are outperforming the market and, like their price, by the end of their run they are growing 10 times faster than their premove growth rate. But there is nothing in that premove growth number (2.98%) that would lead us to believe these companies were about to launch. To the fundamentalist, the room remains dark and uninviting.

Thus, fundamentals can tell us a move is under way, but it can't tell us a move is about to happen. But the move did not just happen. Somebody knows something. Perhaps the traders have the answer, but that will have to wait until next time.

SUGGESTED READING
Maskell, Thomas [2006]. "The Search For The 10-Bagger Begins," Working-Money.com, March 23.
_____ [2006]. "The Anatomy Of The 10-Bagger," Working-Money.com, September 5.

http://premium.working-money.com/wm/display.asp?art=696

The Anatomy Of The 10-Bagger

The Anatomy Of The 10-Bagger
09/05/06 05:41:26 PM PST
--------------------------------------------------------------------------------
by Thomas Maskell
--------------------------------------------------------------------------------

Shh! We're hunting for these elusive (but not particularly rare) stocks.


So far in our search for the 10-bagger, we have identified 588 stocks that doubled in price during the past 52 weeks (see part 1, in Working Money back in March 2006). A 10-bagger is a stock that increases in price 10-fold in three years or fewer. To do that, it must at least double in price in each of those three years--a requirement that is easily spotted using an online stock screen, such as the screen available at http://www.reuters.com/. Screening for these doublers, 588 in all, pointed the way to our 10-baggers.

NARROWING THE LIST
That list of 588 doublers was narrowed to 254 stocks to make the task of observing their charts less daunting. To get on this narrowed list, the initial price of the stock had to be greater than $0.01; it must represent a company based in the United States; and it must be traded on the New York, American, or NASDAQ exchanges. There are currently 5,210 stocks that fit those criteria, which means our 254 stocks are 4.88% of that total.

Using a stock charting service like bigcharts.com will allow us to quickly observe these 254 stocks and identify the 10-baggers. Of course, identifying a 10-bagger by chart requires a set of its own criteria. The criteria are launch point, move duration, and peak price. The launch point is the date that the stock closes above its six-month simple moving average (SMA). Its move duration is the time it takes to move from launch to its peak price. Its peak price is the highest open or close price achieved during the move. For ease of observation, I based this discussion on a five-year monthly chart. Daily and weekly charts will help you fine-tune the analysis, but they lose a lot of instructional value on reproduction. Using monthly charts and the criteria given, 44 of the 254 stocks were identified as 10-baggers.


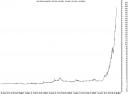
FIGURE 1: AN IDEAL 10-BAGGER. Hansen Natural (HANS) started its move in July 2003 when it closed above its six-month SMA. Over the next 33 months it didn't fall more than 10% below the SMA. The stock climbed to a peak of $148.20 by March 2005.


THE 10-BAGGERS
Figure 1 is a screen capture that illustrates an ideal 10-bagger. I say ideal because many 10-baggers are not this perfect. Of the 44 10-baggers gleaned from our list of 254 potentials, 35 fit this ideal. What is the ideal? It is a stock that closes above its six-month simple moving average (SMA) and does not close more than 10% below SMA during its 10-fold rise. In Figure 1, Hansen Natural Corp. (HANS) began its move in July 2003 when it closed above its six-month SMA at $2.55. Over the next 33 months, it never fell more than 10% below SMA as it climbed to a peak price of $148.20—a 58-bagger. It was a 10-bagger within 20 months (March 2005). In addition, during the stock's rise, its monthly trading volume increased. This is hard to see in Figure 1, so I have replotted it in Figure 2 as both an absolute number and as a percent of the total shares outstanding. Prior to launch, the three-month moving average (MA) in Figure 2 hovered around 250,000 shares. In the launch month, 647,000 shares were traded, more than double the MA. Within seven months of launch, the MA was more than one million shares; and within a year, it was more than 12 million shares. The stock volume began to subside in August 2004, and then increased again in March 2005, the month it achieved 10-bagger status. From there, it went on to higher prices and greater volumes.


FIGURE 2: TRADING VOLUME. The percent of shares outstanding (SO) rose above 100% in May, June, and July 2005. When a company's stock trades more than 100% of its SO in one month, it's something worth noting.

Two other interesting points should be noted about this volume. The first, as seen in Figure 2, is the percent of shares outstanding (SO) that was traded on average each month. It rose above 100% in May, June, and July 2005. (The monthly volume reached that level in June 2004.) The concept of a company trading more than 100% of its shares outstanding in one month is intriguing. The second point and equally intriguing is the number of shareholders in HANS, not shown in Figure 2. From the point of launch to the peak price, the number of shareholders in HANS was reported to have declined from 619 million to 514 million. More shares were traded by fewer shareholders. This would suggest an institutional rather than a general market binge. If this holds true for most 10-baggers, it could be a useful bit of information.

Let's move from the ideal to the sublime. Figure 3 presents the stock chart of Ampex Corp. (AMPX). AMPX is not on our list of 44, but it is a mouth-watering chart that illustrates a compressed 10-bagger. Technically, AMPX launched in February 2004 after two false starts (November 2002 and May 2003). Its launch price (at close) was $1.75, but it achieved that price on a monthly volume of only 320,000, half of the preceding MA. After launch, its price managed to just track its SMA for the next seven months on decreased volume. Given that its two failed breakouts were volumes that were two and four times greater than the MA, ignoring this launch would have been a prudent course of action. This brings us to October 2004.


FIGURE 3: IDEAL TO SUBLIME. Notice how this stock moved from $1.85 to $50.04 in four months. It then declined by 65% to $17.45 but it's still a 10-bagger from its February launch price of $1.75.

In October 2004, AMPX's price moved from $1.85 to $4.09 on a volume of 397,000, three times the preceding MA. That was followed with a close of $11.40 on volume of 1,116,000 in November, a close of $39.50 on 4,933,000 in December, and a close of $50.04 on 1,664,000 in January 2005. In four months it moved from $1.85 to $50.04, a 27-bagger. Three months after its peak price, it closed at $32. After a modest uptick, it continued to slide, closing at $17.45 on May 6, 2006—a decline of 65% from its peak price, but still a 10-bagger from its February 2004 launch price of $1.75.

Figure 3 illustrates how difficult it is to establish rules. If you bought the launch in November 2002 and used 10% below the SMA as a sellpoint, you would have sold the stock the next month at a 50% loss. Your next entry point would be May 2003 with a sale in October for another 30% loss. You could enter again in February 2004 (assuming you weren't too battle-fatigued to continue), with a sale in August 2005 for a gain of 1,700% (finally!). If you started with $10,000, you would have ended up with $64,000, a six-bagger—not a bad return over 34 months. If you ignored the February entry and waited until October, you would have ended up with $27,384, still not bad.

A 27-bagger can compensate for a lot of flaws in an investment plan. If AMPX was just a 10-bagger, selling on a 10% correction would have resulted in a loss of about $150. So any rules we use to guide our stock decisions would have to be statistically significant. Statistics are the study of populations and behaviors. Any quantifiable population or behavior can be analyzed using statistics. In business, statistics are used to improve decision-making. A businessman strives for an 85% confidence level; he wants 85% of his decisions to be correct. While he may strive for 85%, it has been reported that most successful managers are correct only 70% of the time. If we could create rules with a 70% to 85% confidence level, we would have a very powerful stock market strategy.


FIGURE 4: PRICE CORRECTIONS OF TEN BAGGERS. Here you see how many of the stocks corrected and by how much. The statistics provided here give you some idea of the basic chart patterns of the listed stocks.
In Figure 4, the 44 10-baggers are listed. Also listed are their price corrections in comparison to their six-month SMA. Eleven of the 44 stocks corrected twice while 14 did not correct (according to our definition). Two stocks are listed as having corrected and not corrected. These are stocks that had a correction after achieving 10-bag status but then went on to new highs. I included that second correction, but you may choose to ignore it. At the bottom are a few simple statistics, which will help us establish some rules. I recognize that these are very basic, but even the basics can be useful. The data presented is sorted by "Correction %." Half the stocks corrected 7.4% or less during their advance. Twenty-seven (61%) of them corrected 10% or less. The 10% (or less) limit also represents 35 of the 55 corrections (64%). Thirty-three of the stocks did not correct or corrected only once (75%). Eleven corrected twice. There were as many corrections greater than 20% (14) as there were corrections at zero percent. Just based on these statistics, it is difficult to establish a significant sell strategy. Certainly, if we are to achieve a 70% confidence level, we will need more information.

THE REWARDS
Now that we have identified our 10-baggers and observed their basic chart patterns, it is time to gather more information. The goal is to answer two questions. First, why did these stocks launch (cause)? Second, why did they continue to rise (support)? The cause will help us predict their move, and the support will help us predict their peak.

Since there are three kinds of players in the stock market, we will approach this study from three different perspectives. First, we will approach it as investors and study the underlying fundamentals. Second, we will become traders and look for clues in the charts. Finally, as speculators, we will go beyond the fundamentals and the indicators; we will anticipate price based on events, trends, and innovations. Somewhere, in that mix of market strategies and historical data, we hope to find the key to unlocking the rewards of the 10-bagger.


SUGGESTED READING
Maskell, Thomas [2006]. "The Search For The 10-Bagger Begins," Working-Money.com, March 23.

http://premium.working-money.com/wm/display.asp?art=660

Where you'll find the double-baggers

Where you'll find the double-baggers

Small caps' tendency to outperform their large-cap brethren isn't just a down-market happenstance -- it held true in 2005, 2006, 2007, and 2008 as well.

In any market, the stocks with the most potential for outsized returns (stocks that will double, triple, or even increase your investment tenfold) are not found among large caps, but rather among stocks that are:

1.Ignored.
2.Obscure.
3.Very small.


Why? Because the market's greatest inefficiencies (and, thereby, greatest opportunities) lie hidden among the investments that Wall Street analysts and institutional investors shun only because of their size.

Starting today

Investing in small-cap stocks makes many people nervous -- and today's market volatility is sending many people into the arms of stable, financially pristine large-cap stocks. Which makes now an even better time to buy up those oversold small caps.

But not all small caps are equal. You want to make sure you buy small caps that have a rock-solid balance sheet and a solid business model. Both these factors ensure that the company will be around five to 10 years from now, giving it plenty of time to double, triple, or increase tenfold in size.

At Motley Fool Hidden Gems, these are precisely the kinds of stocks we're recommending right now -- and we're putting real money behind our best ideas. What's more, our recommendations are beating the market by an average of 18 percentage points since the service began in 2003.


http://www.themoneytimes.com/featured/20090904/these-stocks-can-easily-double-your-money-id-1082594.html

CANADA TIP SHEET: Law Hunts For 10-Baggers

CANADA TIP SHEET: Law Hunts For 10-Baggers

By Nirmala Menon
Dow Jones Newswires
18 May 2006

OTTAWA (Dow Jones) -- As a small-cap fund manager, Jennifer Law tries to sniff out potential "10-bagger" stocks. She thinks Katanga Mining Ltd. (KAT.V) may eventually prove to be a winner.

Ten-baggers are stocks that increase their value 10-fold.

Law bought Katanga earlier in the year for the CIBC Canadian Small Companies Fund that she lead-manages. But it could take about a couple of years for the company, which owns a big copper project in the Republic of Congo, to show its potential.

"You don't expect them to produce immediately, but you watch as they come on production in 2007, I think that will give a nice lift to the portfolio," Law said in an interview.

"With Africa becoming a more important copper producer, we're sort of taking a little bit more risk, branch out a little bit and finding a next winner," she said.

She builds smaller positions in established winners, such as First Quantum Minerals Ltd. (FM.T), which she bought a few years ago and which emerged as a 10-bagger.

"We try to layer on some more smaller positions that we can build into core positions over the next two years if management delivers what they promise," Law says.

HudBay Minerals Inc. (HBM.T) is another stock that has been an "exceptional performer" for the fund since Law bought it at the initial public offering for C$2.20 a share. The stock came with warrants.

She bought more warrants at 3.5 Canadian cents each and that has risen to become "almost a 10-bagger." She bought more of the stock and warrants in anticipation of strong fourth-quarter earnings, and describes subsequent gains as "pretty sweet."

HudBay is trading at C$13.33 in Toronto Thursday.


Recipe For Making Money In Small-Caps

As a bottom-up investor, what attracts her the most about a company are the qualitative aspects: the management, the product or service, the competitive landscape, how a company sets itself apart to compete, and catalysts for growth.

She keeps sector bets "small and measured" and says she runs a balanced portfolio with exposure to all 10 sectors. Nearly half the fund is invested in energy and materials stocks, reflecting their dominance in the market.

Law says the key to making money in Canada's small-and- mid-cap market is to get a foot in the door early before a company's earnings are included in forecasts.

"If you're there early, you get to know management well, really understand the business, that's where you can outperform and that's when you can make good money," she says.

Law has spent nearly her whole career managing small-caps funds. She started managing the Canadian Small Companies Fund in 2003 and helped turn it from a fourth-quartile fund to the current second-quartile ranking. As of April 28, the fund had assets of C$123.9 million (US$112 million).

The portfolio is run on GARP principles - growth at a reasonable price - but has a lower beta than is typical for the riskier small and mid-cap asset class.

"The beta for this portfolio tends to be 10-15% lower than the benchmark. We're not taking as much risk as the benchmark," Law says.

The price-earnings multiple is also lower, and the return on equity tends to be better than the benchmark. "I think as an investor, you get the best of both worlds," Law says.

She can hold winner stocks until they reach a market capitalization of C$6 billion, unlike other small-cap funds where the limits are much lower.

"That's a really nice flexibility within this mandate (the Canadian Small Companies Fund) that the unit-holder is probably not aware of," says Law.

Law doesn't see "lots of great new ideas" in the market right now.

"We'll continue to dig and find some little nuggets here and there, but overall, I think the biggest call this year is when to take profit on the commodities and the rest of it is just really boring, bottom-up work," she says with a laugh.

(c) 2006 Dow Jones & Company, Inc.

http://www.cibc.com/ca/am/pdf/news-publications/in-the-media/law-dowjones-en.pdf

Saturday 5 September 2009

Bottoming stocks flare 100-1,500% post Sept 11, 2001

Bottoming stocks flare 100-1,500%

B G Shirsat

Stocks which plummeted to their 52-week lows during the last six months gave huge returns. One hundred and sixty four such stocks, identified by the Business Standard Research Bureau, which plumbed their year's lows after September 2001, have turned out to be a gold mine for investors. Their prices flared by 100 per cent-1,500 per cent in the subsequent period.

The returns on the stock indices, over the September 21 level when stock indices declined to almost a nine-year low, vary between 33 per cent (Sensex up 33.82 per cent, S & P CNX Nifty up 33.3 per cent) and 52 per cent (BSE 500 and BSE 200 up around 52 per cent).

Of the 164 stocks studied, the value of four increased 10 times (10 baggers), or by 1,000 per cent. As many as 17 stocks became 5-10 baggers, and 64 others 3-5 baggers. The rest have doubled in value during the period.

Hinduja TMT fell to Rs 32 on September 26 in line with the continuing meltdown in second-rung technology stocks after September 11, 2001.

The booster came from the healthy performance in the quarter ended September 30, 2001. The stock became a 10 bagger in six months.

MphasiS BFL soared to Rs 646.95 on April 11 from Rs 70.35 on October 12, 2001, up 820 per cent. The Financial Technology scrip gained 708 per cent from Rs 7.50 on September 26 to Rs 60.60 on Thursday, even though the company reported a loss of Rs 67.5 million in the nine months between April-December, 2001. The upside is that the company is engaged in a single business segment, providing end-to-end straight through processing (STP) technologies.

The other winners were Fortune Information, up 1,289 per cent at Rs 69.45, Mastek, up 592 per cent at Rs 366.60, IT & T, up 563 per cent at Rs 48.10 and Blue Star Information, up 570 per cent at Rs 194.70.

Take also Praneta Industries, an unknown penny stock trading at Re 0.90 on March 6, 2002. A month later, it surged to Rs 13.45 (April 10), registering a 1,500 per cent rise.

The market was unfavourable to KPIT Infosystems which declined to almost an all-time low of Rs 13 in September, 2001. The numbers for the October-December 2001 quarter, too, were not favourable.

However, investors bet on this stock for the simple reason that during 2001-2002 the company added six new customers who had the potential to bring significant business during 2002-03. The stock became a top multi-bagger with a 1,353 per cent rise in market price.

Apple Amusement bottomed out at Rs 2.65 on October 17, 2001. Operators entered at this juncture and the stock went up to Rs 25.15 on April 11, 2002, getting returns of almost 10 times.

http://search.rediff.com/business/2002/apr/12bot.htm

Recession type scare causes stocks to be sold down

I wrote:

"Only a recession type scare can cause stocks to be sold per share below asset values. This stock is an easy 10 bagger if you hold long enough for the next upturn in the economy."


http://caps.fool.com/Blogs/ViewPost.aspx?bpid=203897&t=01007468826027738866

10 bagger over 5 years


Santa, let the Sensex hit 15000

Larissa Fernand December 23, 2005


Dear Santa

When I asked my friends what features on their Christmas wish list, I mourned their lack of imagination and creativity.

I mean, why would you ask for a perfume bottle or a pair of Levi's? Can't you go out and get one yourself?

Since you choose to make an appearance just once a year with a promise to make wishes come true, I have decided to make the most of it.

So here is my wish list for this Christmas.

Wish 1: Can you make this bull run last for at least five years?

Now, don't get me wrong. I am not for a moment suggesting that you keep the Sensex at 9,000-odd levels, with a gradual rise now and then. Can you push it to at least 15,000?

Over five years, this should not be too difficult.

All you have to do is let the Foreign Institutional Investors keep pouring money into this country. The Americans and the British were the first entrants, followed by the Germans. The Japanese are the latest. So you still have a large part of the globe to work with.

And yes, don't forget the non-resident Indian population abroad. In case you haven't noticed, they are loaded.

Simultaneously, you can work at keeping interest rates in the US really low. This will ensure that none of the above pull out their money and run to greener pastures for better returns (isn't everyone money crazy!).

Of course, there will other loose ends that have to be tied, but nothing that your ingenuity cannot overcome.

Is this bull run over?
Wish 2: Can you name the most lucrative stocks to invest in?

Now, what is the point of a bull run if I have not invested in the galloping stocks? So how about giving me the names of five 10-baggers?

You know what a 10-bagger is, don't you? Let me explain just to make sure we are both referring to the same thing. Ten baggers are stocks that have increased 10 times in value from the price at which I purchased them.

And yes, I am not looking at them turning into 10 baggers for my grandchildren. I am talking about the next five years.

Now, in case that is a bit too demanding, here is what I suggest. Why don't you orchestrate a stock market correction?

Let the Sensex fall precipitously by around 20%. At that time, I will pick up the five stocks you recommend since their prices would have fallen to dirt cheap levels. Once I have done that, the bulls can start galloping again and the bears and can hibernate for the next five years.

Come Christmas 2010, I will sell the shares, smile and pat myself on the back.

After that, the stock market can shut down for all I care.

Wish 3: Please give me some money!

Be reasonable. What good is a bull run going to do me, even if I have a list of the five best stocks, if I have no money to invest in the stock market?

How about a gift from a benign relative? This one is tough. You will have to make them benign to start with.

Better still, why not just convince my boss to give me a bonus? A million rupees should be fine.

Investing that and getting 10 times that amount in five years is perfect. If you do the math, you will realise that I am far from greedy. Investing a million and getting 10 times that amount would leave me with 10 million (Rs 1 crore).

Asking for a crore is really not too much.

Don't let the festive season empty your wallet
Wish 4: And yes, throw in a gift card

Alright, here's the last one.

I know a gift card sounds weird. But look at it practically. What I am asking for will materialise only after five years. What about now?

Just like my friends asked for perfumes and jeans, I guess the mundane must be given some amount of attention.

Now I am not asking for a gift certificate. Those are so limiting. You can only use them at a particular store. I would like a gift card -- the ones that work like pre-paid debit cards and are acceptable at all merchant establishments.

Don't sigh, it's very simple.

All you have to do is approach a bank that offers such cards (you can get your elves to do the groundwork). Kotak Mahindra Bank and IDBI Bank is where you can start. Pay the amount and you will get a card worth that much, which you can gift to me.

The bank would have tied up with either Visa or MasterCard and the person getting the card (in this case, me) can use it just like a debit card. As I spend, the amount gets debited.

The maximum limit of around Rs 25,000 would suit me fine.

Want a gift card?
And yes dear Santa, in case you feeling exhausted after reading this, I have a promise to make.

If you do give me all that is on this list, you have my word that I shall not bother you or ask for anything for the next five years.

Oops, I almost forgot!

Merry Christmas to you too!

http://www.rediff.com/getahead/2005/dec/23santa.htm