In nearly all businesses, there is a close correlation between the level of turnover and the profit or loss.
The managers should know that if invoiced sales reach a certain figure the business will break even.
If invoiced sales are above that figure the business will be in profit.
The break-even point depends on the relationship between the fixed and the variable (or direct) costs.
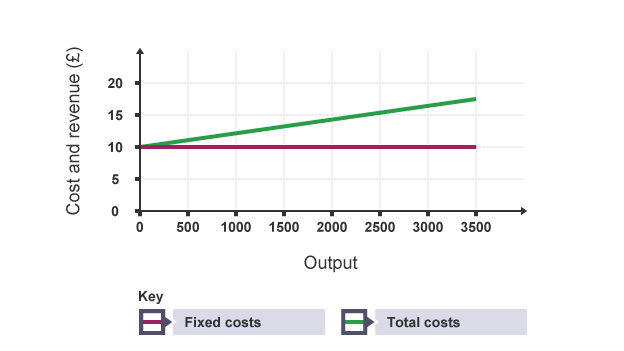
Breakeven chart.

The break-even point can be calculated by drawing a graph showing how fixed costs, variable costs, total costs and total revenue change with the level of output.
Fixed costs are shown as a flat line in the chart above..
The total costs are the result of adding the variable costs to the fixed costs.
The revenue is the result of sales.
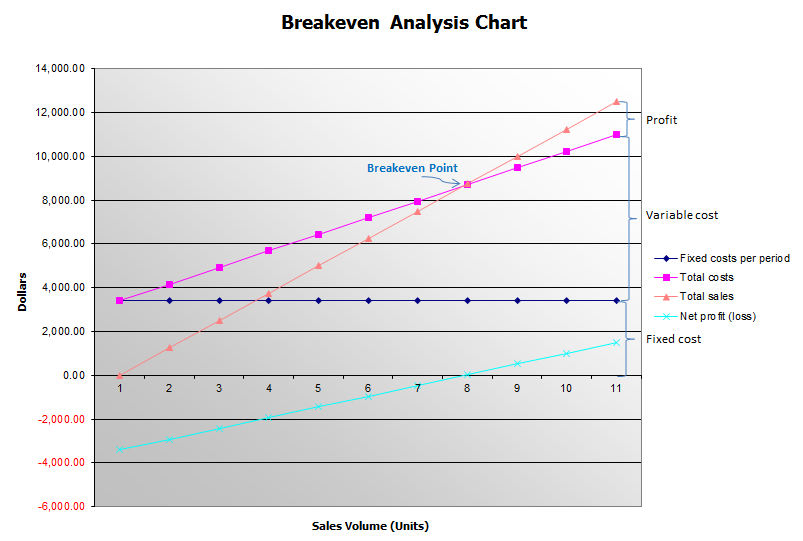
The break-even point is when the total costs line crosses the revenue line. It is at this point where these lines cross.
Profit and loss can also be read from the chart.
In practice, the relationships are rarely quite so straightforward, as some of the costs may be semi-variable.
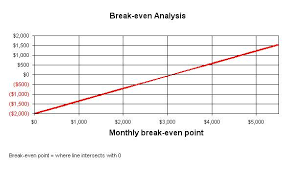
More charts:

The managers should know that if invoiced sales reach a certain figure the business will break even.
If invoiced sales are above that figure the business will be in profit.
The break-even point depends on the relationship between the fixed and the variable (or direct) costs.
Breakeven chart.
The break-even point can be calculated by drawing a graph showing how fixed costs, variable costs, total costs and total revenue change with the level of output.
Fixed costs are shown as a flat line in the chart above..
The total costs are the result of adding the variable costs to the fixed costs.
The revenue is the result of sales.
The break-even point is when the total costs line crosses the revenue line. It is at this point where these lines cross.
Profit and loss can also be read from the chart.
In practice, the relationships are rarely quite so straightforward, as some of the costs may be semi-variable.
More charts:
