Tuesday 31 March 2020

Beware of chasing bear market rallies, strategists warn


PUBLISHED MON, MAR 30 2020
Nancy Hungerford


KEY POINTS


  • Attributing the recent gains in equities and emerging market currencies to extraordinary monetary and fiscal stimulus measures, Eric Robertsen, head of global macro strategy at Standard Chartered, warned clients that the risk-rally lacks sustainability.
  • “The full extent of the economic fallout is still unknown, and equity and credit markets still face considerable risks from earnings, downgrades and regulatory changes,” said Robertsen in a note.
  • Daniel Gerard, senior multi-asset strategist from State Street, agreed that more information is needed from corporations before declaring a bottom. “No one has real insight yet into the impact into earnings, the fundamental drivers of markets here, that’s the next stage to come,” he said.


Investors in Asia are kicking off the new trading week with a note of caution, keeping an eye on volatility emanating from Wall Street.

Following the Dow’s biggest weekly rally since 1938, and the best performance for the S&P 500 and Nasdaq on the week since 2009, investors are debating whether U.S. markets have already bottomed or if more pain is in store.

Attributing the recent gains in equities and emerging market currencies to extraordinary monetary and fiscal stimulus measures, Eric Robertsen, head of global macro strategy at Standard Chartered, warned clients that the risk-rally lacks sustainability.


Consumer confidence hit

“The release of Q1 brokerage statements over the next month will coincide with the release of global economic data showing the depths of the economic collapse,” Robertsen explains in his weekly note. “We believe these two factors combined will exacerbate the weakness in consumer confidence, already under attack from the growing health crisis and the prospect of extensive unemployment.”

He pointed out that while the market declines have been well publicized, these first quarter statements will put “negative returns in black-and-white print” for retail investors. The losses incurred on traditionally safe investments will also hit home, Robertsen suggested, pointing to a recent 5% to 15% decline in exchange-traded funds tied to U.S. credit markets.

The full extent of the economic fallout is still unknown, and equity and credit markets still face considerable risks from earnings, downgrades and regulatory changes.

Investors are waiting on a deluge of economic data this week stateside that could fuel economic gloom. The focus will be on the weekly jobless claims due Thursday, after the prior report revealed a record 3.2 million in claims for the week that ended March 21. The monthly non-farm employment report is due Friday, but is expected to have less significance since the survey will not yet reflect the major shutdowns in the states most impacted by the virus.


Unknown risks

“The full extent of the economic fallout is still unknown, and equity and credit markets still face considerable risks from earnings, downgrades and regulatory changes,” Robertsen said. “For equities and credit, for example, we believe the hit to corporate profits will last longer than the immediate shock of the health crisis.”

No one has real insight yet into the impact into earnings, the fundamental drivers of markets here, that’s the next stage to come.

Addressing arguments that a 25% peak-to-trough drawdown has already priced in a worst-case scenario from these missing variables, Robertsen said: “We believe this sentiment is premature.”

Daniel Gerard, senior multi-asset strategist from State Street, agreed that more information is needed from corporations before declaring a bottom.

“No one has real insight yet into the impact into earnings, the fundamental drivers of markets here, that’s the next stage to come,” Gerard told CNBC’s Street Signs Asia. He credited central bank and fiscal stimulus measures with taking some of the fear out of the market and allowing participants to get back in.

However, he cautioned that this would not lead to a straight line higher from here.


No sign yet of a strong rebound

Vishnu Varathan, head of economics and strategy at Mizuho Bank, questioned if the stimulus-induced upside for risk assets has already run its course.

He predicted that revenue shocks from coronavirus-related containment measures, as well as supply-chain disruptions, would continue for the foreseeable future.

“The bad news could be seeping in, whereas the big bazookas are done with. The shock and awe of policy is about climaxing right now, and there is still not a good sign of a very strong rebound coming through,” Varathan told CNBC’s Street Signs Asia.

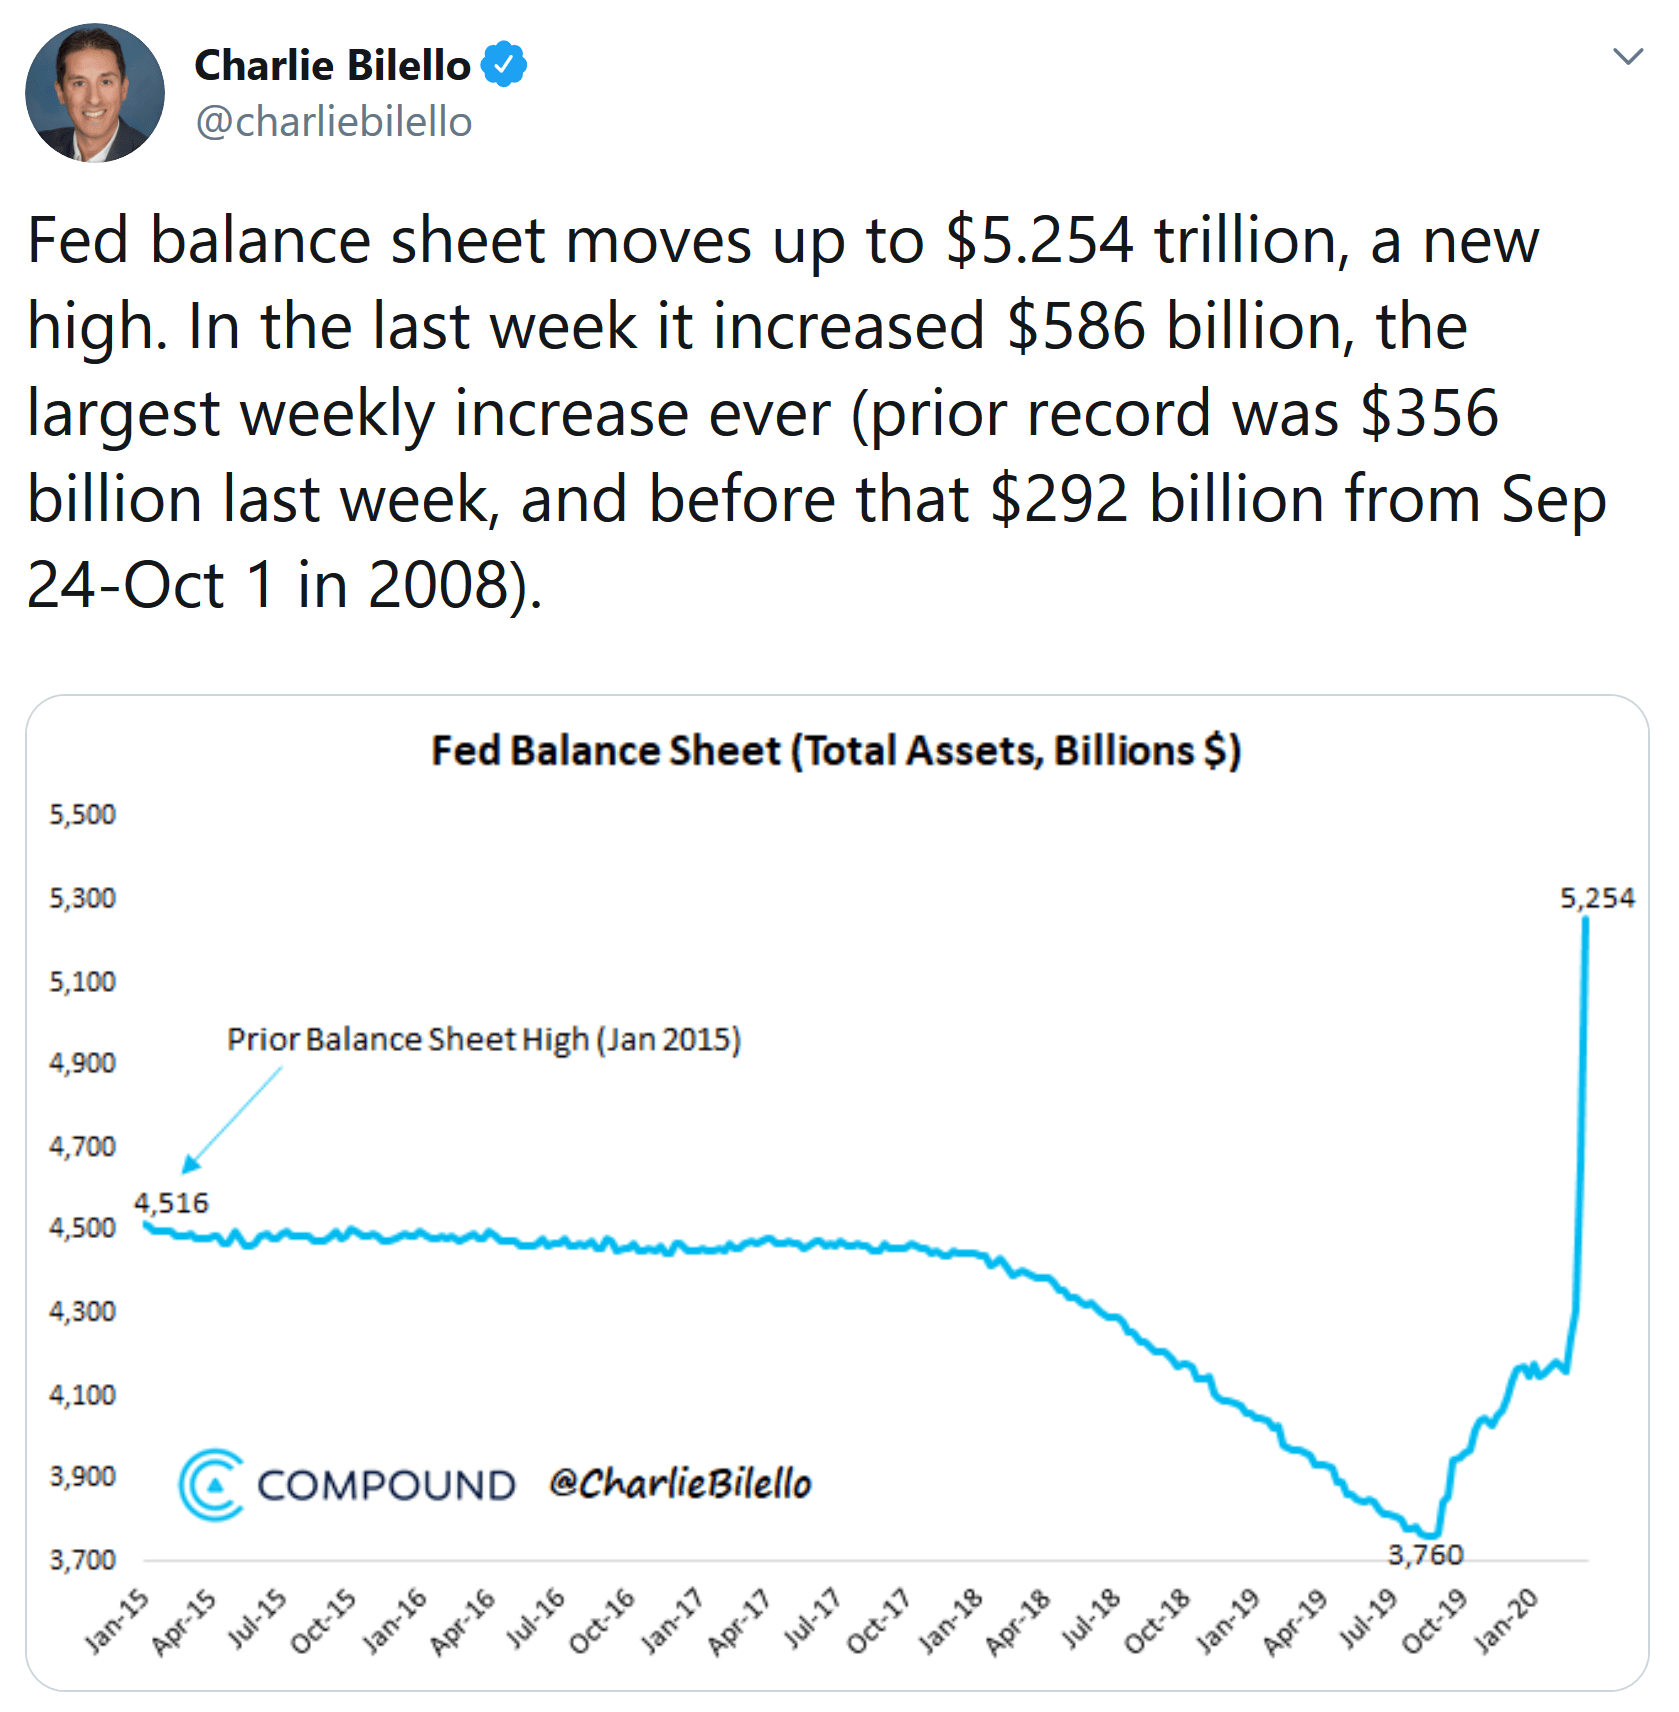
Robertsen looked back to the global financial crisis as a lesson in policy-induced rebounds. “Don’t forget that equities bounced in November 2008 when support measures were announced, before trading down to new lows in March 2009. Only then did the recovery begin.”


https://www.cnbc.com/2020/03/30/beware-of-chasing-bear-market-rallies-strategists-warn.html?fbclid=IwAR1sEiaZiQog6-V-SeTaPnTM74qSc2IbaOAOtIb5-_EzHP2cruiYslgyRFU

Sunday 29 March 2020

THE MAJOR INDICES REMAIN MILES BELOW THEIR PRE-PANDEMIC LEVELS.


Despite an unprecedented response from global governments and central banks, the major indices remain miles below their pre-pandemic levels. 
 
While the late-session selloff on Friday wasn’t pretty, the major indices held on to most of their mid-week gains, giving hope for bulls that last week’s lows might be successfully defended.  
We saw a textbook risk-off shift on Friday, with utilities and healthcare stocks performing well and tech issues and industrials struggling together with the energy sector, but technically speaking, last week’s lows look safe, for now, which is already a huge plus for bulls.
The major indices all finished significantly lower following one of the strongest three-day rallies in history, despite the approved U.S. stimulus bill, as the global COVID-19 situation continued to deteriorate. 
The Dow Jones Industrial Average (INDEXDJX:.DJI) was down 915, or 4.1%, to 21,637, the Nasdaq (INDEXNASDAQ:.IXIC) lost 295, or 3.8%, to 7,502, while the S&P 500 (indexsp:.inx) fell by 89, or 3.4%, to 2,541. Decliners outnumbered advancing issues by a 3-to-1 ratio on the NYSE, where volume was extremely high again.


Bulls Make A Comeback

Following one of the worst week's for stocks in history, bulls staged an epic comeback this week, with the Dow gaining over 16% in three days. Despite the rally, which was fueled by an unprecedented response from global governments and central banks, the major indices remain miles below their pre-pandemic levels. 
The uncertainty regarding the length of the necessary, but economically damaging global lockdowns continues to weigh on risk assets, and equities finished the week on a negative note. Volatility will likely remain very high for several weeks, and bulls hope that we will get positive reports from Europe, and there won't be secondary outbreaks in China and South Korea.
The Fed’s unlimited QE program and emergency rate cut helped investor sentiment this week, but the economic uncertainty led to continued pressure on credit market. 
The key economic releases were mixed yet again this week, but several indicators still didn't fully reflect the effects of the pandemic. 
The week will likely be remembered because of the record number of new jobless claims, as the measure came in at 3.283 million eclipsing even the pessimistic consensus estimate of 1.5 million. 
Services PMIs hit record lows in Europe and Australia, with the U.S. Market services PMI also coming in well below expected, but the key manufacturing PMIs beat expectations, just as durable goods orders, personal income, and new home sales.

Technical Picture Remains Bearish


The technical picture continues to be bearish across the board, despite the mid-week surge in stocks, with all of the key trend indicators still pointing lower. 
The S&P 500, the Nasdaq, and the Dow are still all well below their declining 50-day averages, and the benchmarks are also all below their 200-day moving averages. 
Small-caps finally showed relative strength during the crazy short-covering rally, but despite its positive week, the Russell 2000 closed below both its short-and long-term moving averages on Friday. 
The Volatility Index (VIX) only finished slightly lower despite the double-digit gains of the major indices, and the fear gauge closed the week above the still extremely high 65 level, due to the economic uncertainty.

Market internals improved substantially thanks to the broad rally, but even though a V-shaped recovery is not impossible, the current positive divergences have to be taken with a grain of salt in light of the extreme market conditions. 
The Advance/Decline line bounced back sharply this week, as advancing issues outnumbered decliners by a 15-to-1 ratio on the NYSE, and by a 14-to-1 ratio on the Nasdaq. 
The average number of new 52-week highs was close zero on both exchanges, edging lower to 1 on the NYSE and 3 on the Nasdaq. 
The number of new lows collapsed in the meantime, falling to 130 on the NYSE and 125 on the Nasdaq. 
The percentage of stocks above the 200-day moving average increased somewhat thanks to the strong rally, but the measure remains near its multi-year low, finishing the week at 9%.

Short Interest Decrease Due To The Corporate Bailouts And The Fed’s Unlimited QE Program


Short interest decreased on Wall Street for the first time in a month, as bears rushed to the exits due the corporate bailouts and the Fed’s unlimited QE program.  
While Match Group (MTCH) had a rough time, so far, this year, the stock was among the strongest issues this week, and its short interest of 38% could fuel further gains should the market continue to normalize. 
Our previous pick, Sea Ltd. (SE) joined the rally, finishing almost 20% higher, and since the stocks short interest increased to 45%, it could continue to outperform. 
Hormel Foods (HRL) couldn’t get close to its recent all-time high this week, but it remained stable amid the volatile swings in the major indices, and it’s still very high days-to-cover (DTC) ratio of 14 means that there are plenty of shorts that would be squeezed by a rally.


Bill Ackman's greatest trade of all time

Whitney Tilson’s email to investors 

6) Bill Ackman of Pershing Square Capital Management just made the greatest trade of all time (in my judgement – based on the percentage gain, dollar profit, the speed of the gain, and the perfect timing). He made almost a 100x return in less than two months, turning a $27 million investment into a $2.6 billion profit!
According to this letter he just released, earlier this year he became "extremely alarmed about both the health risks of the coronavirus and its economic impact." To hedge his portfolio, he "purchased credit default swaps (CDS) on various investment grade and high yield credit default swap indices, namely the CDX IG, CDX HY, and ITRX EUR," which "were trading near all-time tight levels of about 50 basis points per annum."
Ackman's thesis was simple:
Because we believed that the coronavirus could only be stopped in Europe and the U.S. with an unprecedented economic shutdown, based on what we learned from China, we were confident that U.S. and European credit spreads would likely widen substantially from their near-all-time lows.
In short, he saw exactly what was going to happen – and figured out the perfect way to profit from it.
Ackman has also made what I think will prove to be another brilliant move: exiting the hedge and plowing all of the gains into buying more of the stocks of the high-quality companies in his portfolio, whose stocks have all been whacked, including Berkshire Hathaway (BRK-B), Lowe's (LOW), Hilton Worldwide (HLT), Agilent Technologies (A), Restaurant Brands (QSR), and Starbucks (SBUX).
He's also investing some of his personal profits from this trade into addressing the crisis, as this article notes: Bill Ackman Puts Part of His Personal Fortune in Covid-19 Testing.
"This will enable the inevitable viral breakouts to be identified early and minimized with localized quarantines, reducing the impact on the overall U.S. economy and the need for future shutdowns," he said.

When I told my daughters about this trade over dinner recently, they asked, "Why didn't you do that, daddy?"
I had to be honest with them: "Well, Bill's a lot smarter than I am."
We should all be asking ourselves the same question. Was it really so hard to see on February 19, only 37 days ago, when the S&P hit an all-time high and credit spreads were close to all-time lows, that the coronavirus might be a big problem?
With hindsight (which is always 20/20, of course), it shouldn't have been hard to see at all, but I think we all got lulled into complacency by the long bull market...
Best regards,

Whitney

https://www.valuewalk.com/2020/03/ackmans-greatest-trade/


There will likely be some sharp pullbacks, but I think they should be bought.


Whitney Tilson’s email to investors

Alan Gula's Comments

5) Alan Gula, a senior analyst at Stansberry Research, shared these comments with me yesterday and gave me permission to share them:
Funny how unlimited [quantitative easing] and a stimulus package equivalent to 10% of GDP (CASH CANNON) cause stocks to rise.
I agree with your assessment. There will likely be some sharp pullbacks, but I think they should be bought.
The credit markets remain open... 18 investment-grade issuers priced $35 billion across 33 tranches [on Thursday]. NVDA, HD, TGT, ED, CSX, MS, and CVS all issued bonds. Pessimists will say that these companies are just rushing to issue while they can. But I think the issuance is positive considering that we didn't see this in late 2008.
Total U.S. corporate bond issuance was only around $80 billion in the entire fourth quarter of 2008. There was more investment-grade issuance than that this week.
And if investment-grade and high-yield spreads tighten, it will be bullish for equities. (I have long believed that the most important second-order effect of quantitative easing is spread tightening.)
Right now, high-yield sector spreads are all wider than 600 [basis points] (in particular, high-yield spreads in the energy sector blowing out to wider than 2,000 basis points shows devastation reminiscent of the global financial crisis).


Wild Week

Whitney Tilson’s email to investors discussing the wild week


1) What a wild week! The sharpest, fastest bear market in history – the S&P 500 Index was down 35.2% from its closing high on February 19 to its intraday low on Monday – was followed by the sharpest, fastest move back into bull market territory in history, as the index rallied 20% from that point through yesterday's close. Both Tuesday and the past three days were the best for the Dow in 87 years.

I can't recall such a violent upward move in my entire career. I checked the bounces off the bottoms reached on October 10, 2002 and March 6, 2009 (the closing low was March 9, but the intraday low was on March 6) and, in the four days afterward, the S&P 500 rose by "only" 12.5% and 12.3%, respectively. And going back to the Dow's 22.6% plunge on Black Monday on October 19, 1987, while it rose 5.9% the next day, it then trickled downward for another month and a half – going well below its Black Monday close.

I rarely have opinions about where I think the market in general is going, especially in the short term, as this isn't my area of expertise. I find it a far better use of my time to study particular companies and industries to try to develop proprietary insights.


But Monday was one of those rare times. In my e-mail that day, I wrote:

..... why we've come to the firm conclusion that this is the absolute best time to be an investor in more than a decade. To borrow a phrase from one of my friends, "we're trembling with greed" right now.


................


If this doomsday scenario doesn't come to pass, stocks will likely go nuts.

So after the big move in the past three days, what's my thinking? Over the next few months, I no longer have a strong feeling. I think there's a bell curve of possible outcomes, and we're right in middle of it.

But if you ask me where we will be in a year (which is the absolute minimum time horizon I tend to consider) – I think odds are at least 75% that stocks will be higher.


2) In yesterday's e-mail, I wrote:

I just completed a report on [the coronavirus crisis] that I think is the best work I've ever done.

It's broken into three parts:

1. Why I'm Optimistic That We'll Soon Stop the Coronavirus

2. The Five Reasons We're Bullish on Stocks Right Now

3. 10 Stocks to Buy to Profit from the Coming Market Upturn

As it becomes clear that we've controlled the spread of the virus and know exactly where the outbreaks are – which could happen as soon as a couple of weeks from now – we can start bringing our economy back to life.


https://www.valuewalk.com/2020/03/ackmans-greatest-trade/


A World Awash In Liquidity

Whitney Tilson’s email to investors 


3) One of the reasons I'm bullish over a one-year horizon is that many macro factors are highly favorable. Here is an excerpt on this from part two of my report: "The Five Reasons We're Bullish on Stocks Right Now":
  • To be clear... we're surely already in a recession and the damage is already significant.
  • But our economy is gigantic and was doing quite well on the eve of this crisis...
  • American households have the least leverage since 1984 (measured by total liabilities divided by total assets)...
  • Interest rates are at all-time lows, providing unprecedented monetary stimulus...
  • It looks like Congress will soon pass a $2 trillion stimulus bill that President Donald Trump has promised to immediately sign into law, which will provide unprecedented fiscal stimulus. And if that proves insufficient, the government can easily borrow trillions more at minimal rates...

The Federal Reserve has dusted off the playbook it implemented during the global financial crisis and is injecting massive amounts of liquidity into the financial system. In particular, the stimulus bill includes $454 billion in funds for the Treasury to backstop emergency actions by the Fed. Since every dollar from the Treasury can stand behind $10 lent by the Fed, this translates into $4.5 trillion to keep credit flowing and make direct loans to U.S. businesses, in effect doubling the Fed's current $4.7 trillion balance sheet...
And don't forget that Trump views a recovery in stock prices as critical to his reelection hopes.
4) As further evidence that we're in a world awash in liquidity, see this chart that Compound Capital Advisors CEO Charlie Bilello tweeted:
Wild week

https://www.valuewalk.com/2020/03/ackmans-greatest-trade/


Dissecting Volatility


POSTED BY: PROF. BRADFORD CORNELL, CORNELL CAPITAL GROUP MAR 27, 2020,
https://www.valuewalk.com/2020/03/level-of-volatility-stocks/


It is one thing to say that the market is volatile. It is quite another to appreciate fully what that really means. So let’s spend a moment to dissect the level of volatility.


The Current Level Of Volatility

The first thing to make clear is how is volatility measured. One way is to use historical data. The data necessary to estimate historical volatility is not a series of past prices, but past daily returns. The return is the percentage change in price adjusted for any payouts. Because payouts during that last couple of months have minuscule compared to price fluctuations, you can think of the return as the percentage change in price. To measure volatility, you cannot average past returns because positive and negative returns cancel each other leading to a vast underestimate of volatility. Therefore, volatility is measured by either the standard deviation of the returns, or more simply by the average of the absolute values of the returns. In most cases, the two estimates are quite similar.

By these measures, how volatile has the aggregate value of all U.S. publicly traded stocks been over the last three weeks? The average daily absolute price change comes to about 6.5% (with some negative and some positive). This level of volatility means that every day you can expect the market to move 6.5%. To appreciate how astonishing this is it is helpful to keep two observations in mind. First, remember that the value of the aggregate stock market is the present value of the cash flows to equity owners expected to be produced by all listed companies in all future years.

Second, that present value is a big number. At the end of 2019, the data base maintained by the Center for Research in Securities Prices calculates it to be $41.14 trillion. Of course, it has declined since then by an amount that depends on the day you do the calculation, but to keep things easy let’s use $35 trillion.


How To Measure Volatility

Based on that number, the current level of volatility implies that every day the market value of publicly traded American business can be expected to change by about $2.25 trillion. It takes a moment for that number to sink in. On average, based on whatever information comes in that day, the market is revaluing total equity by $2.25 trillion – and it is doing it day after day. While one may think that on a day or two, in response to major news, a move of this magnitude might be warranted, to have it occur day after day, often without the arrival of much in the way of value relevant new information is remarkable.

All that said, there is one factor, news about which may be driving the market up and down and that is the term of the lockdown associated with the virus. In a previous post, The Market and the Virus: Deconstructing the Drop, I calculated that the impact of the virus should be less than 10%. Ironically, if we use January 1, 2020 as the starting point, we are getting back to that level after the run-up of the last three days. The good news is that this interpretation implies that the market should sustain this level, but the offsetting bad news is that no further increase would be warranted. Of course, all of this depends on the assumptions used in modeling the duration of the virus-related economic shutdown, a number which, like the market, changes daily.


VIX Index Has Risen 5x

It is also possible to calculate forward looking measures of volatility. By far the best known is the VIX index which calculates the volatility implied by the prices of options on the S&P 500 index. Between the beginning of the year and the close on Thursday, the VIX index has risen by a factor of about five times. Options on individual stocks have seen their implied volatilities rise by similar factors. For those who employ hedging strategies using options, as we do at Cornell Capital, the pickings were slim prior to the virus crisis because volatility, and therefore option premia, were near historic lows. Needless to say that has changed dramatically. Option premia are at levels last seen at the height of the 2008 financial crisis.


In closing, it may seem that investing based on fundamental valuation is fruitless during times when the large daily price changes seem to have little relation to changes in value, but the reverse is true. Given the unpredictability of the massive short-term price movements, attempting to play a pricing game is ill advised. The best an investor can do is take positions based on his or her fundamental valuations and maintain sufficient reserves to ride out the bumps in both direction that are highly likely to occur. Those bumps can be softened by careful use of options, particularly in light of the current high option premia.


Seven Questions you should be able to answer when you Invest

Friday 27 March 2020

A Wall Street rally on Thursday despite record new unemployment filings in the US.


A Wall Street rally powered global gains in stocks on Thursday despite a record number of new unemployment filings in the US, Reuters reports.

Traders focused on the unanimous passage of a $2 trillion coronavirus relief bill in the Senate and the possibility of more stimulus to come.

The legislation is intended to flood the country with cash in a bid to stem the crushing impact the outbreak has already had on the world’s largest economy. Nearly 3.3 million Americans filed for unemployment benefits over the past week, eclipsing the previous record of 695,000 set in 1982.


Thursday 26 March 2020

Is this investing or speculating?

NetX (0020)

What will happen to the bid-ask spread?!

You may be pleasantly surprised that all the bids disappeared.


23.3.2020

Bid 0.005 (208,689,300)
Ask 0.01 (12,103,100)

😊😊


26.3.2020

Bid 0.01 (250,000)
Ask 0.015 (92,783,300)

😊😊


On 23.3.2020, 12,103,100 shares were offered for sale at 1 sen per share but many buyers appeared in the queue wishing to buy lower, at 0.5 sen per share.

On 26.3.2020, there were ready buyers for 250,000 shares at 1 sen but many sellers asked to sell at 1.5 sen per share.

Monday 23 March 2020

More than 700 companies valued at below US$100 million on Bursa

Image result for More than 700 companies valued at below US$100 million on Bursa


Mon, 23 Mar 2020

KUALA LUMPUR: The double whammy of the Covid-19 outbreak and the oil price crash has dampened investor sentiments around the globe, especially on net export oil-producing economies like Malaysia.

The FBM KLCI has plunged nearly 18% year to date (YTD). Valuation wise, KLCI’s current price-to-earnings ratio (PER) stood at 14.56 times, representing a 15.1% discount to its 10-year average of 17.15 times.

Simply put, it is the market in which investors, with cash in pockets, could cherry-pick the good bargains.

Since investor sentiment is transient in nature — they come and go like dark clouds, as such we look into how many Malaysian-listed companies lie in the affordable range, to a business-centric and well thought out billionaire investor that has US$1 billion (RM4.43 billion) cash on hand.

According to Bloomberg data, there are about 868 companies which market capitalisation (cap) is at or below US$1 billion.


Big caps at discount on valuation

Image result for More than 700 companies valued at below US$100 million on Bursa

There are 31 big-cap companies, which market cap is in between the US$500 million to US$1 billion categories.

The stock exchange, Bursa Malaysia Bhd, is among the 31 listed entities.

Bursa Malaysia closed at RM4.70 last Friday after it rebounded 28 sen or 6.33%, giving it a market cap of RM3.79 billion, less than US$1 billion. The stock exchange is trading at PER at 20.45 times compared with its 10-year average of 23 times

LPI Capital Bhd, which sits on top of the list, came in at a total market cap of RM4.31 billion. The home-grown insurer last closed at RM10.82 as of last Friday — indicating its current PER valuation stood at 13.37 times, representing a 23% discount to its five-year average PER of 17.38.

With US$1 billion in hand, the billionaire investor can even afford to buy out utility companies, namely YTL Power International Bhd (RM4.1 billion), Malakoff Corp Bhd (RM3.32 billion) and Gas Malaysia Bhd (RM3.21 billion).

The three utility giants’ stock price fell in the range of 7% to 30% YTD, to close at 53.5 sen, 68 sen and RM2.50 last Friday.

Shares in Astro Malaysia Holdings Bhd saw its price dropped by more than half year-on-year (y-o-y) to 73 sen, valuing it with a total market capitalisation of RM3.81 billion. The stock is currently trading at a PER valuation of 5.98 times, according to Bloomberg. The media stock’s PER valuation is indeed at a 73% discount to its five-year average PER of 22.3 times.

It is worth noting that many of these companies are trading substantially lower than their net asset values. The list of companies includes Malaysia Building Society Bhd, FGV Holdings Bhd, Oriental Holdings Bhd, Affin Bank Bhd, Lotte Chemical Titan Holding Bhd, Alliance Bank Malaysia Bhd, DRB-Hicom Bhd and AirAsia Group Bhd.

A random check on all the stocks’ valuation, in comparison to end-October 2008 period (the heights of the global financial crisis), four out five of the stocks have suffered lower PER valuation during the 2008 selldown period.


Mid-large cap choices

Image result for More than 700 companies valued at below US$100 million on Bursa
There are 124 companies that are valued between US$100 million and US$500 million.

A billionaire investor, who has US$1 billion in hand, could afford a buyout of some oil and gas giants, Bumi Armada Bhd, Velesto Energy Bhd and Sapura Energy Bhd, which have been succumbed to irrational selldown after the meltdown on the crude oil prices.

Remarkably, shares in Supermax Corp Bhd was the only one yielded positive among the top-31 companies within the category. Supermax which gained 7% YTD, closed at RM1.49 last Friday — valuing the rubber glove maker at RM1.96 billion. Valuation of Supermax which was widely viewed as one of the beneficiaries for the pandemic containment efforts stood at 18.85 times PER, 33% higher than its 10-year average of 14.18 times.

Companies that sit above the RM2 billion mark within this category include Aeon Credit Service (M) Bhd, Shangri-La Hotels (Malaysia) Bhd, Allianz Malaysia Bhd and UMW Holdings Bhd — which saw their share price slid between 13% to 68% y-o-y.

In particular, Aeon Credit is trading at a single PER of 7.86 times based on last Friday’s closing of RM8.58. The valuation is at a 17% discount to its five-year average of 9.47 times.

While Shangri-La Hotels’ stock price was holding up strong at RM4.85 despite the concern on the Covid-19 outbreak that will affect occupancy rate. The five-star hotel group is trading at PER of 33.7 times, which is a 12% premium to its five-year average of 29.92 times.

Meanwhile, Allianz Malaysia, which used to trade above six times average PER in the past five years, is currently trading at a 32% discount at 4.31 times PER at RM12.02. Interestingly, Allianz’s net tangible assets (NTA) currently worth about RM11.89 per share — indicating that the investor gets to own 98% of the tangible assets for every ringgit invested into the insurance company.

Some of the notable consumer-related companies within US$100 million-US$500 million market cap range, includes Guan Chong Bhd (RM1.78 billion), Leong Hup International Bhd at RM1.68 billion, 7-Eleven Malaysia Holdings Bhd (RM1.49 billion), Aeon Co (M) Bhd (RM1.40 billion) and Padini Holdings Bhd (RM1.35 billion), which saw their share price tumbled 9% to 47% YTD. This group of companies, except for Leong Hup which was newly listed last year, were trading below their five-year average PERs.

Among the semiconductor companies that are within US$100 million and US$500 million range, Malaysian Pacific Industries Bhd (RM1.81 billion) was the only one traded at a premium to its historical values, which stood at 13.44 times PER, representing a 7% premium relative to its five-year average of 12.48 times.

Meanwhile, Frontken Corp Bhd, VS Industry Bhd and Pentamaster Corp Bhd are all traded at a discount to their historical values. Their share prices had plummeted 20% to 45% YTD.


Cheaper companies but cheaper quality

Image result for More than 700 companies valued at below US$100 million on Bursa

With US$1 billion in hand, billionaire investors will be spoilt for choice at bargain prices for stocks with a market cap of US$100 million or less.

There are 713 companies valued at below US$100 million, based on last Friday’s closings, according to Bloomberg.

Out of the top 31 market cap companies within this category, there are five loss-making companies.

Interestingly, companies in which NTA is significantly higher than their respective share prices include MNRB Holdings Bhd, MPHB Capital Bhd, Sunsuria Bhd, Muhibbah Engineering (M) Bhd, Malayan Flour Mills Bhd, Can-One Bhd. Share prices in these companies have tumbled 25% to 66% YTD.

MNRB’s NTA at RM2.97 per share is about close to five times higher than Friday’s closing price of 52 sen. While Can-One’s NTA stood at RM9.01 per share, close to four times higher than its share price of RM1.93, and MPHB’s NTA of RM1.88 per share is more than two times higher than its last trading price of 56.5 sen.

In terms of price valuation, all of the companies were traded below their five-year average PER, except for Amverton Bhd and Ayer Holdings Bhd which are both involved in property development.

Amverton, which has a valuation of RM438 million, saw its share price closed at RM1.20 — implies current PER of 85 times, three times higher than its five-year average of 28 times.

Ayer Holdings current PER stood at 29 times, representing 22% higher than its five-year average of 23 times, as of last closing price of RM5.20, valuing the company at RM389 million total market capitalisation.


https://www.theedgemarkets.com/article/more-700-companies-valued-below-us100-million-bursa


Saturday 21 March 2020

15 Very Safe Blue Chips To Buy During This Bear Market


Mar. 16, 2020


Summary

  • The bear market so many have long feared is here. Stocks didn't just enter a bear market last week, they crashed into one with gusto.
  • COVID-19 panic, combined with worst oil crash since the Financial Crisis, have combined to create a perfect storm of fear, literally the second highest in 30 years.
  • However, regardless of when this bear market ends (and it surely will), great companies are always on sale, BUT especially when the market is panicking.
  • CFR, UMBF, ADM, CAT, GD, PH, CNI, GWW, MDT, SWK, TJX, ROST, CB, ADP and APD are 15 very safe blue chips who have collectively delivered 15% CAGR returns over the last 23 years.
  • From today's 25% undervaluation they could deliver about 17% CAGR long-term returns. Just don't forget to always use the right asset allocation for your needs, because when the bears roar on Wall Street, almost no stock is spared short-term pain.


1.  Why are global markets melting down over this?

Because while the COVID-19 Pandemic is indeed a global health crisis, what the market is worried about is the effect on earnings and the economy, both in the US and around the world.

US supply chains have been disrupted, with The Harvard Business Review estimating the end of March will represent peak supply chain disruption.

China's new cases have fallen below 40 per day over the last week (just 18 yesterday) and it's begun lifting travel restrictions, even in Wuhan where all this began.

By Q3 Goldman expects supply chains to be back up and running. By Q4 all COVID-19 effects are expected to reverse, resulting in 4+% GDP growth in 2020.


2.  Does that mean the market is 100% wrong to dive into a bear market? 

No, because the combined effects of the pandemic + oil crash are expected to hurt earnings significantly.


3.  Goldman expects S&P 500 earnings to fall 5% this year due to the pandemic. 

The big hit will come in Q2 and Q3, and then a strong recovery in Q4.

Goldman is forecasting a 27% bear market, that would be relatively short and mild. It expects a market bottom by the middle of the year and then a 31% rally to close the year about -2% for stocks.

That's not necessarily an outlandish forecast, given that the average non-recessionary bear market since 1945 has been a 24% decline.

Goldman Sachs just put out a new research note which states
  • it expects -5% EPS growth for the S&P 500 this year (about $156.75)
  • it expects the S&P 500 to bottom at 2,450 in the middle of the year
  • 2450 on S&P 500 represents a 15% decline from today's levels
  • it represents a forward PE of 15.6 vs 16.3 25-year average (about 4% undervalued)

Goldman expects earnings growth to "collapse" in the second and third quarters of 2020 before rebounding through the end of the year and into 2021. The S&P 500 will bottom out at 2,450 in the middle of the year, roughly 15% lower than its current level, the analysts projected. The fresh low will give way to a fourth-quarter surge and push the benchmark index to 3,200 by the end of 2020, they added." - Business Insider


4.  Of course, the big question is whether or not we get a recession this year.

Jeff Miller and Moody's both estimate about 50% probability of a short and mild recession this year.

For next year the bond market/Cleveland Fed/Haver analytics model estimate about 21% chance of recession.

The bond market is potentially so nonchalant about next year's recession risk because it's now pricing in a near 100% probability of a rate cut to zero on March 19th (Fed meetings last two days).

Moody's estimates that each 25 bp rate cut stimulates economic growth by 0.1% to 0.15% within a year. The Fed will have made the equivalent of 7 rate cuts within two weeks, potential boosting growth by as much as 1% for 2021.

The Fed is also injecting at least $1.5 trillion into the repo market and resuming QE, all to ensure ample liquidity to prevent a repeat of the financial crisis.

So this is the good news. The bad news is that until now and the end of the year we have to deal with the second-highest market volatility in modern history.


5.  Why are some people so worried that this historically mild bear market might become a raging inferno of paper wealth destruction?


Because low oil prices could trigger a wave of bankruptcies in that sector among highly leveraged junk bond rated companies. You can see that until just recently, investment-grade bond yields have been tracking 10-year yields lower. Junk bond yields have been rising throughout this crisis, as bond investors demand extremely high risk-premiums to buy high-risk bonds.

COVID-19 on its own is likely only capable of generating a short and mild recession, similar to the Gulf War oil shock recession of 1990, which lasted eight months and caused a 20% bear market.

BUT the potential is there for cascading loan defaults to trigger significant financial losses for bond investors, banks, and anyone holding high-yield debt.


6.  The Fed's Emergency Rate Cut

The Fed's emergency rate cut (the first since 2008) was NOT meant to cause stocks to go up, as so many think. Rather it was meant to reduce short-term borrowing costs, which are mostly based on LIBOR, which you can see tracks the Fed Funds rate relatively closely.

Along with the Fed's repo short-term and QE long-term bond-buying, which is designed to ensure sufficient liquidity in the financial system, the Fed is just trying to grease the wheels of the financial system.

The goal is to either
  • ameliorate the effects of the economic slowdown, or,
  • if we get a recession, maximize the chances of it being brief, and a recovery being strong and beginning as soon as possible.


7.  Bargains galore for blue chip dividend investors

So how long with the COVID-19 pandemic and bear market last?

In the meantime, there are bargains galore for blue chip dividend investors to cash in on.

There has always been volatility in the stock market and there always will be. That’s guaranteed as long as humans are the ones making buy and sell decisions.
In the short-term, the reasons for market sell-offs feel like they matter a lot. In the long-term, investors tend to forget the specific reasons stocks fell in the past.
In the short-term, market downturns feel like they will never end. In the long-term, all corrections look like buying opportunities.

Regardless of how long this correction lasts, to win in the stock market over the long haul you must be willing to lose over the short-term." -Ben Carlson (emphasis added)


8.  15 Very Safe Blue Chips To Consider During This Bear Market

Dividends are a function of share count, not price.

However, given the rapidly changing nature of the COVID-19 pandemic as well as significant economic/earnings uncertainty, for this article, I wanted to highlight companies with

9/11 blue chip quality
5/5 dividend safety
trading at fair value or better


These 15 blue chips are


Fundamental Stats On These 15 Companies
  • average quality: 9.9/11 blue chip quality vs. 9.7 average dividend aristocrat and 7.0 average S&P 500 company
  • average dividend safety: 5/5 very safe vs 4.7 average aristocrat and 3.0 S&P 500 average
  • average yield: 2.9% vs. 2.3% S&P 500 and 2.7% most dividend growth ETFs
  • average valuation: 23% undervalued vs fairly valued S&P 500
  • average dividend growth streak: 35.7= dividend aristocrat/champion
  • average 5-year dividend growth rate: 10.3% CAGR
  • average analyst long-term growth consensus: 9.0% CAGR vs. 6.3% S&P since 2000
  • average forward PE ratio: 13.6 vs 13.7 S&P 500 bottom on December 24th, 2018
  • average PEG ratio: 1.51 vs. 1.69 S&P 500
  • average return on capital: 58% = 84th industry percentile (very high-quality by Greenblatt's definition)
  • average 13-year median ROC: 65% (relative stable moats/quality)
  • average 5-year ROC trend: +6% CAGR (relative stable moats/quality )
  • average credit rating: A (investment grade, very-high quality)
  • average annual volatility: 24% vs. 15% S&P 500, 26% Master List Average, 22% average aristocrat
  • average market cap: $38 billion
  • average 5-year total return potential: 2.9% yield + 9.0% growth +5.4% CAGR valuation boost = 17.3% CAGR (12% to 22% CAGR with 25% margin of error)
Collectively these this is a group of dividend aristocrats, with a nearly 36-year dividend growth streak, A-rated balance sheet and returns on capital that are in the top 16% of their respective industries and growing over time.
In other words, just the kind of sleep well at night blue chips you can safely buy when bear market choppy waters are upsetting most investors.


9.  Risk management is the most important part of long-term investing success.
These are the risk management rules I use for all the portfolios I manage including my own. They are merely guidelines to start thinking about the best way to build a sleep well at night bunker portfolio for all market conditions, including bear markets such as this one.


10.  Consider Nibbling Today

Bottom Line: No One Knows Where The Bottom Of Any Bear Market Is So Consider Nibbling On These 15 Safe Blue Chips Today

Here's Ritholtz Wealth Management's CEO, Joshua Brown with what he's telling his clients about market timing right now.
Why don’t we just sell everything and wait this out? Get back in when the dust settles?”
The great answer is that you won’t know when the dust settles. There’s no airplane writing the “all clear” in the sky above your neighborhood. And when the dust settles, do you think stocks will be at their lows? Or will they have already rallied furiously, in anticipation of this? Let me give you an example.
Today is March 9th. Precisely eleven years ago today, in 2009, the stock market stopped going down. There was no reason. The dust had settled, without fanfare or any sort of official announcement. If you had polled people that day, or week or even month, most would not have agreed that we had seen the worst.
The economic headlines were not improving. But there it was. And by June 1st, less than 3 months later, the stock market had climbed 41% from that March low. And even with that having happened, the majority of participants still weren’t clear that the dust had fully settled. That we had, in fact, seen the worst.
There were still people calling us 3, 5 and 7 years later who had gone to cash and still hadn’t gotten back into stocks. They missed a new record-high a few years later and hundreds of percentage points in compounding on their assets." - Joshua Brown, CEO Ritholtz Wealth Management (emphasis added)
Don't get me wrong, I don't know where the bottom of this bear market is, given the factors that are hurting the global economy and corporate earnings right now.
All I do know is that great companies are on sale. I also know that the market, when it becomes excessively fearful becomes very wrong about the intrinsic value of companies.
The prices you see on your screen today are the transitory manic depressive opinions of the often mentally unstable Mr. Market. (If I have offended Mr. Market, my apologies). Mr. Market did not carefully value your companies today and decided that they are now worth less. No, he woke up in a grumpy mood and indiscriminately marked them down as if they were overripe bananas at the grocery store. (You cannot have enough metaphors here.)
The stock prices on your screen say nothing about what these companies are worth. Nothing at all. But that is all that is going to matter in the long run. I promise you one thing: The value of your companies doesn’t change 8% a day, day after day."Vitaliy Katsenelson, CEO of asset management firm IMA (emphasis added)
CFR, UMBF, ADM, CAT, GD, PH, CNI, GWW, MDT, SWK, TJX, ROST, CB, ADP, and APD represent blue chip quality dividend growth stocks with 5/5 very safe dividends that have bright futures ahead of them.

They might not necessarily have a great 2020, but good long-term investing requires looking beyond one or two bad years and looking at the likeliest long-term growth potential.


11.  Luck is when preparation meets Opportunity

(Source: AZ Quotes)

By no means am I saying anyone should go "all in" to any stock all at once. That's market timing, and numerous articles I've shown why that doesn't work for regular investors.
I'm a big advocate of buying in stages, nibbling rather than chomping on quality companies at reasonable to attractive valuations.
Where once many of the world's best dividend stocks were overvalued, today you can buy the kind of quality bargains only available in a market panic.
No one rings a bell at the top or the bottom. And 80% of the market's best days come within two weeks of its worst.
According to Bank of America, 99.6% of long-term returns over the last 90 years have come from just the 90 best market days.
So as Buffett famously said, "be greedy when others are fearful" because some of these fantastic quality bargains won't last long.
Whether the market bottoms tomorrow, in mid-2020 or the end of the year, I'm confident that anyone buying these companies today, as part of a diversified, and prudently risk-managed portfolio, will be very pleased with the results in 5+ years.