Showing posts with label kpj. Show all posts

Monday, 24 November 2025

KPJ: Surge in the P/E and P/B multiples (2023-2024)

Summary:  Surge in the P/E and P/B multiples (2023-2024) coincides

with KPJ achieving its highest ever PBT Margins and ROE.  


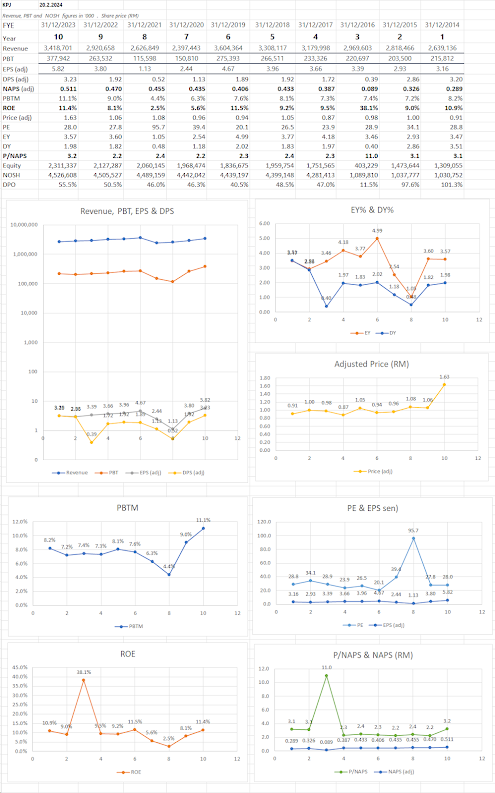
KPJ Healthcare: 10-Year Financial Summary (Adjusted for Latest Capital Structure)

All monetary values in RM '000, except per-share data. 

Per-share data is adjusted for NOSH of 4,363,857.


This adjusted dataset allows for a proper analysis of KPJ's valuation 

metrics (like P/E and P/B ratios) over the entire 10-year period, as 

if the company's current share capital had always been in place.


Calculated Financial Ratios for KPJ Healthcare


Key Observations:

Profitability (PBT & Net Margin): There is a clear trend of 

significantly improving profitability from the low in 2020, with 
margins in 2023-2024 reaching their highest point in the last decade.
Return on Equity (ROE): The ROE has followed a similar trajectory
to the profit margins, showing strong improvement in recent years. 
The exceptionally high ROE in 2015 (38.14%) is an outlier and is 
directly caused by the very low Adjusted NTA (RM 0.0923) in that
 year, which significantly inflates the ratio. This low NTA is consistent
 with the major capital change that occurred.
Dividend Payout (DPO): The DPO ratio has become more stable 
and higher in recent years (around 51-55%), indicating a commitment
to returning more cash to shareholders as profits have grown. The 
very low DPO in 2015 (11.65%) is consistent with the capital 
restructuring event that likely occurred around that time.

KPJ Healthcare: Valuation & Profitability Metrics (Adjusted)


Key Observations:

Valuation (P/E Ratio): 

- The P/E ratio was extremely high in 2020 (83.76) 

because earnings (EPS) fell sharply during that period, while the share 

price did not drop as precipitously.

- The current P/E (33.74 for 2024) is at the high end of the historical range, 
reflecting market expectations for continued strong earnings growth.
- The period from 2021 to 2023 shows a fascinating trend: as earnings (EPS)
recovered and grew strongly, the share price initially lagged (leading to 
a low P/E of 17.58 in 2022) before surging ahead (resulting in a higher 
P/E of 33.74 in 2024).

Valuation (P/B Ratio):

- The P/B ratio has consistently been above 2.0 for most of the last decade, 
indicating the market values KPJ at a significant premium to its book value.
- The current P/B of 4.71 is the highest in the last 10 years (excluding
the  2015 outlier), signaling very strong market confidence in the 
company's future profitability and asset utilization.
- The 2015 P/B of 11.27 is an outlier, directly caused by the abnormally
low Adjusted NTA (RM 0.0923) following the capital restructuring, which
artificially inflated the ratio.

Profitability vs. Valuation:

- The recent surge in the P/E and P/B multiples (2023-2024) coincides 
with KPJ achieving its highest-ever PBT Margins and ROE, justifying 
the market's higher valuation to a large extent.

Thursday, 24 August 2017

KPJ (24.8.2017)

KPJ 24.8.2017
5 Years Quarterly Report History
Qtr Financial Revenue PBT  PAT PBT 
No Quarter (RM,000) (RM,000) (RM,000) Margin
1 31-Mar-17 793,909 54,229 38,272 6.8%
4 31-Dec-16 744,985 63,581 52,191 8.5%
3 30-Sep-16 767,039 49,083 32,497 6.4%
2 30-Jun-16 765,124 46,086 30,334 6.0%
1 31-Mar-16 743,946 51,021 34,173 6.9%
4 31-Dec-15 694,204 43,698 24,583 6.3%
3 30-Sep-15 721,839 55,462 38,157 7.7%
2 30-Jun-15 714,272 55,434 35,994 7.8%
1 31-Mar-15 709,887 50,616 33,894 7.1%
4 31-Dec-14 718,315 70,761 46,577 9.9%
3 30-Sep-14 657,078 51,417 29,126 7.8%
2 30-Jun-14 662,823 50,195 33,743 7.6%
1 31-Mar-14 602,742 45,478 30,221 7.5%
4 31-Dec-13 634,451 48,560 32,733 7.7%
3 30-Sep-13 565,183 28,257 19,415 5.0%
2 30-Jun-13 587,698 37,718 25,294 6.4%
1 31-Mar-13 545,051 35,106 25,093 6.4%
4 31-Dec-12 526,532 44,376 37,575 8.4%
3 30-Sep-12 530,578 45,578 33,369 8.6%
2 30-Jun-12 529,290 53,326 34,798 10.1%
5 Years Trailing 4 Quarters
No. Financial ttm-Rev ttm-PBT  ttm-PAT ttm-PBT 
Qtr. Quarter (RM,000) (RM,000) (RM,000) Margin
1 31-Dec-17 3,071,057 212,979 153,294 6.9%
4 31-Dec-16 3,021,094 209,771 149,195 6.9%
3 31-Dec-16 2,970,313 189,888 121,587 6.4%
2 31-Dec-16 2,925,113 196,267 127,247 6.7%
1 31-Dec-16 2,874,261 205,615 132,907 7.2%
4 31-Dec-15 2,840,202 205,210 132,628 7.2%
3 31-Dec-15 2,864,313 232,273 154,622 8.1%
2 31-Dec-15 2,799,552 228,228 145,591 8.2%
1 31-Dec-15 2,748,103 222,989 143,340 8.1%
4 31-Dec-14 2,640,958 217,851 139,667 8.2%
3 31-Dec-14 2,557,094 195,650 125,823 7.7%
2 31-Dec-14 2,465,199 172,490 116,112 7.0%
1 31-Dec-14 2,390,074 160,013 107,663 6.7%
4 31-Dec-13 2,332,383 149,641 102,535 6.4%
3 31-Dec-13 2,224,464 145,457 107,377 6.5%
2 31-Dec-13 2,189,859 162,778 121,331 7.4%
1 31-Dec-13 2,131,451 178,386 130,835 8.4%
4 31-Dec-12 2,112,021 192,583 139,079 9.1%
3 31-Dec-12 2,092,118 205,143 141,048 9.8%
2 31-Dec-12 2,037,565 207,468 142,173 10.2%  


5 Years Adjusted EPS, DPS, NTA and ttm-EPS for capital changes    
No of shares (m) 1090.4
adj adj adj adj adj
Qtr Financial EPS  DPS NTA ttm-EPS ttm-DPS
No Quarter (Cent) (Cent) (RM) (Cent) (Cent)
1 31-Mar-17 3.51 2.2 1.53 14.06 8.43
4 31-Dec-16 4.79 3.0 1.56 13.68 7.92
3 30-Sep-16 2.98 1.5 1.45 11.15 6.44
2 30-Jun-16 2.78 1.8 1.43 11.67 6.62
1 31-Mar-16 3.13 1.7 1.37 12.19 6.45
4 31-Dec-15 2.25 1.5 1.37 12.16 7.30
3 30-Sep-15 3.50 1.7 1.30 14.18 7.70
2 30-Jun-15 3.30 1.6 1.19 13.35 7.41
1 31-Mar-15 3.11 2.5 1.24 13.15 7.16
4 31-Dec-14 4.27 1.9 1.15 12.81 4.62
3 30-Sep-14 2.67 1.4 1.12 11.54 3.84
2 30-Jun-14 3.09 1.4 1.14 10.65 3.55
1 31-Mar-14 2.77 0.0 1.14 9.87 3.28
4 31-Dec-13 3.00 1.1 0.66 9.40 5.43
3 30-Sep-13 1.78 1.1 0.95 9.85 5.67
2 30-Jun-13 2.32 1.1 0.95 11.13 5.95
1 31-Mar-13 2.30 2.1 0.92 12.00 6.19
4 31-Dec-12 3.45 1.3 0.94 12.76 6.52
3 30-Sep-12 3.06 1.4 0.98 12.94 6.43
2 30-Jun-12 3.19 1.3 0.94 13.04 6.46
Capital changes
No. Financial No of
Qtr. Quarter Shrs (m)
1 31-Mar-17 1090.4
4 31-Dec-16 1134.6
3 30-Sep-16 1072.5
2 30-Jun-16 1079.5
1 31-Mar-16 1051.5
4 31-Dec-15 1055.1
3 30-Sep-15 1036.9
2 30-Jun-15 1002.6
1 31-Mar-15 1065.8
4 31-Dec-14 1030.5
3 30-Sep-14 1029.2
2 30-Jun-14 1025.6
1 31-Mar-14 1027.9
4 31-Dec-13 601.7
3 30-Sep-13 591.9
2 30-Jun-13 596.6
1 31-Mar-13 584.9
4 31-Dec-12 587.1
3 30-Sep-12 596.9
2 30-Jun-12 581.9
1 31-Mar-12 573.8
4 31-Dec-11 546.9
3 30-Sep-11 609.4
2 30-Jun-11 529.1