This is a fantastic visual cheat sheet for understanding how the appropriate valuation metrics change as a company matures. It was created by Brian Feroldi, a well-known financial educator who specializes in breaking down complex investment concepts.
Here is a detailed analysis, discussion, and commentary on the "Valuation by Stage" framework.
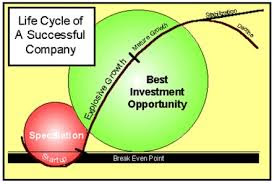
1. The Big Picture: The Lifecycle Lens
The core thesis of this image is that "You can't use a hammer for every nail." Applying a standard P/E (Price-to-Earnings) ratio to a young, unprofitable tech startup is meaningless because the "E" is negative. Conversely, relying solely on Price-to-Sales for a mature, slow-growth conglomerate might overlook its massive cash-generating ability.
The chart segments a company's life into six distinct stages:
Startup: Focus on survival and finding a market.
Hyper Growth: Prioritizing revenue at all costs.
Break Even: The transition from burning cash to generating it.
Operating Leverage: Profits grow faster than revenue.
Capital Return: The company is a "cash cow."
Decline: Shrinking relevance and revenue.
2. Analysis of the Matrix
The matrix cross-references the Source of Value (what actually drives the stock price) with the Valuation Metrics (how we measure that value).
Top Row (Source of Value): This is the genius of the chart. It defines why a stock goes up at each stage.
Product/Market Fit: The idea that the company has something people want.
Revenue Growth: The top line is expanding rapidly.
Positive Cash Flow: The company is self-sustaining.
Margin Expansion: Profits are getting fatter.
Buybacks, Dividends, M&A: Returning capital to shareholders.
Asset Sales: Liquidating the company for parts.
The Vertical Axis (Valuation Metrics): These are the tools investors use to slap a price on the company.
3. Commentary and Key Takeaways
Here are the most important insights from this framework:
A. The "Not Useful" Zones are Just as Important as the "Useful" Ones
TAM (Total Addressable Market) becomes useless after Break Even: In the early stages, a huge TAM justifies the "story" (e.g., "We only have 1% of a billion-dollar market!"). But once a company is mature, the TAM is already factored in. If a mature company like Coca-Cola is struggling, you can't blame the size of the beverage market.
P/E ratios are useless for growth companies: As the chart shows, looking at trailing earnings for a company in Hyper Growth is "Not Useful." You are paying for future potential, not past profits.
B. The Shift in Focus: From Top-Line to Bottom-Line
Notice the transition of Price to Sales (P/S) .
Stage 1-4 (Startup to Op. Leverage): P/S is "Useful." This is because when a company isn't profitable, revenue is the cleanest measure of growth and market share.
Stage 5 (Capital Return): P/S becomes only "Somewhat Useful." Once a company starts buying back stock or paying dividends, earnings and cash flow matter more than just top-line sales.
C. The "Sweet Spot" for DCF (Discounted Cash Flow)
The chart marks Discounted Cash Flow (DCF) as "Useful!" (with an exclamation mark) in the Capital Return stage.
Why? DCF requires predicting future cash flows far into the future. This is incredibly hard (and often a "garbage in, garbage out" exercise) for a volatile growth stock.
However, for a mature company like Johnson & Johnson or Procter & Gamble, their cash flows are relatively predictable. Therefore, DCF is actually a powerful tool here to see if the stock is undervalued relative to the cash it will throw off for the next decade.
D. The "Key Expression" at the Bottom
The bottom of the image seems to be a slightly jumbled legend or a quick summary, but it reinforces the idea that Revenue Growth is the key for young companies, while Buybacks/Dividends are the key for old ones.
4. Practical Application for Investors
How should you use this?
Identify the Stage: First, determine where a company sits on the lifecycle line. Is it a Hyper-Growth SaaS company (Stage 2) or a Break-Even Auto Manufacturer (Stage 3)?
Pick the Right Tool: Once you know the stage, look only at the "Useful" metrics.
If it's Stage 2: Ignore the P/E ratio. Focus on Revenue Growth and the P/S ratio compared to history and peers.
If it's Stage 5: Stop obsessing over revenue growth (it might be low single digits). Focus on Free Cash Flow yield and the dividend payout ratio.
Avoid Value Traps: If a company is in Decline (Stage 6) , the chart suggests almost no metric is useful except perhaps Asset Sales. This implies that traditional valuation metrics can make a declining company look "cheap" (low P/E) when it is actually a value trap.
Conclusion
This is an excellent mental model. It forces investors to move away from rigid, one-size-fits-all valuation formulas and toward a contextual analysis. It acknowledges that a stock's price is driven by different fundamentals at different points in its corporate life, and using the wrong metric is a surefire way to misinterpret a company's value.
SUMMARY
Here is a concise summary for an investor, based on Brian Feroldi's framework:
The Core Principle: A company's value is driven by different things as it ages. To avoid overpaying (or missing an opportunity), you must match your valuation tool to the company's current life stage.
The Investor's Cheat Sheet
1. The Startup (Focus: Product/Market Fit)
Ignore: Earnings, Cash Flow.
Use: Price-to-Sales (P/S). You are betting on the story and future growth; revenue is the only hard number available.
2. Hyper Growth (Focus: Revenue Growth)
Ignore: P/E, DCF (Discounted Cash Flow).
Use: P/S and Price-to-Gross Profit. The market is paying for rapid top-line expansion. Profits don't matter yet.
3. Break Even (Focus: Positive Cash Flow)
Ignore: Trailing earnings.
Use: P/S and Price-to-Forward Earnings. The company is turning the corner; you need to start paying attention to future profitability, not just revenue.
4. Operating Leverage (Focus: Margin Expansion)
Ignore: (Transition phase).
Use: Forward Earnings and Forward Free Cash Flow. The company is now keeping more of its revenue as profit. This is where the "growth" story meets "value" math.
5. Capital Return (Focus: Buybacks, Dividends, M&A)
Ignore: TAM (Total Addressable Market) and high P/S.
Use: Price-to-Earnings (P/E), Free Cash Flow, and DCF. This is a cash cow. Value it based on the cash it returns to you now, not the growth story.
6. Decline
Ignore: Almost all standard metrics (they will lie to you).
Use: Asset Sales. The only value left might be the physical parts of the business.
The Golden Rule
If the company is young and growing fast: Look at Revenue (P/S) .
If the company is mature and printing money: Look at Cash Flow (P/E, DCF) .
Mixing these up (e.g., buying a mature company for its revenue growth, or a startup for its P/E ratio) is a common path to losses.