Showing posts with label MYEG. Show all posts

Thursday, 19 December 2024

MYEG

MYEG

HISTORICAL PERFORMANCE

FY   REV   NP   NPM(%)
2017  372   202   54.2
2018  319   170   53.4
2018  246 -41.4  -16.8
2019  357   175    49
2019  239   130    54.3
2020  532   268    50.4
2021  724   316    43.6
2022  651   399    61.2
2023  774   488    63
2024(3Q)  723   516   71.4

Revenues and Net Profits are in RM millions


PE

Year 2015 to 2020:
It was trading at PEs ranging from 40 to 80. 
In 2018, its PE dropped to around 10; this coincided with BN losing its power in that general election.

Year 2020 to 2024: 
PE ranged from 10 to 30. 
This PE has trended downwards during this period.
On 18.12.2024, it is trading at PE of 10.77 which is at the lowest point in its PE range.

Why? Is it a risky company going forward? Are investors of the opinion its growth might not be so good going forward?


Insiders

CEO Wong Thean Soon has reduced his shareholdings by 67 million shares, and now holds 760.77 million shares.


Dividends

It pays dividends yearly. 
The dividends paid in the first half of this decade were higher than those paid in the recent 5 years. Latest dividend was 1.930 sen per share for FY ending 31.12.2023 .
DY of 2.04% at today's price of 0.945 per share.


Financial Information

PE 10.82
ROE 24.73%
P/B 2.68
NTA 0.353
DPO ratio 28%- 29%


Why is MYEG trading at low PE? 
Its net profit has increased since 2020. 
Maybe we should look at its debts and its FCFs?
Its account receivable has grown faster than its increase in revenues.
A big percentage of its total assets are intangible assets.


All values are in RM millions

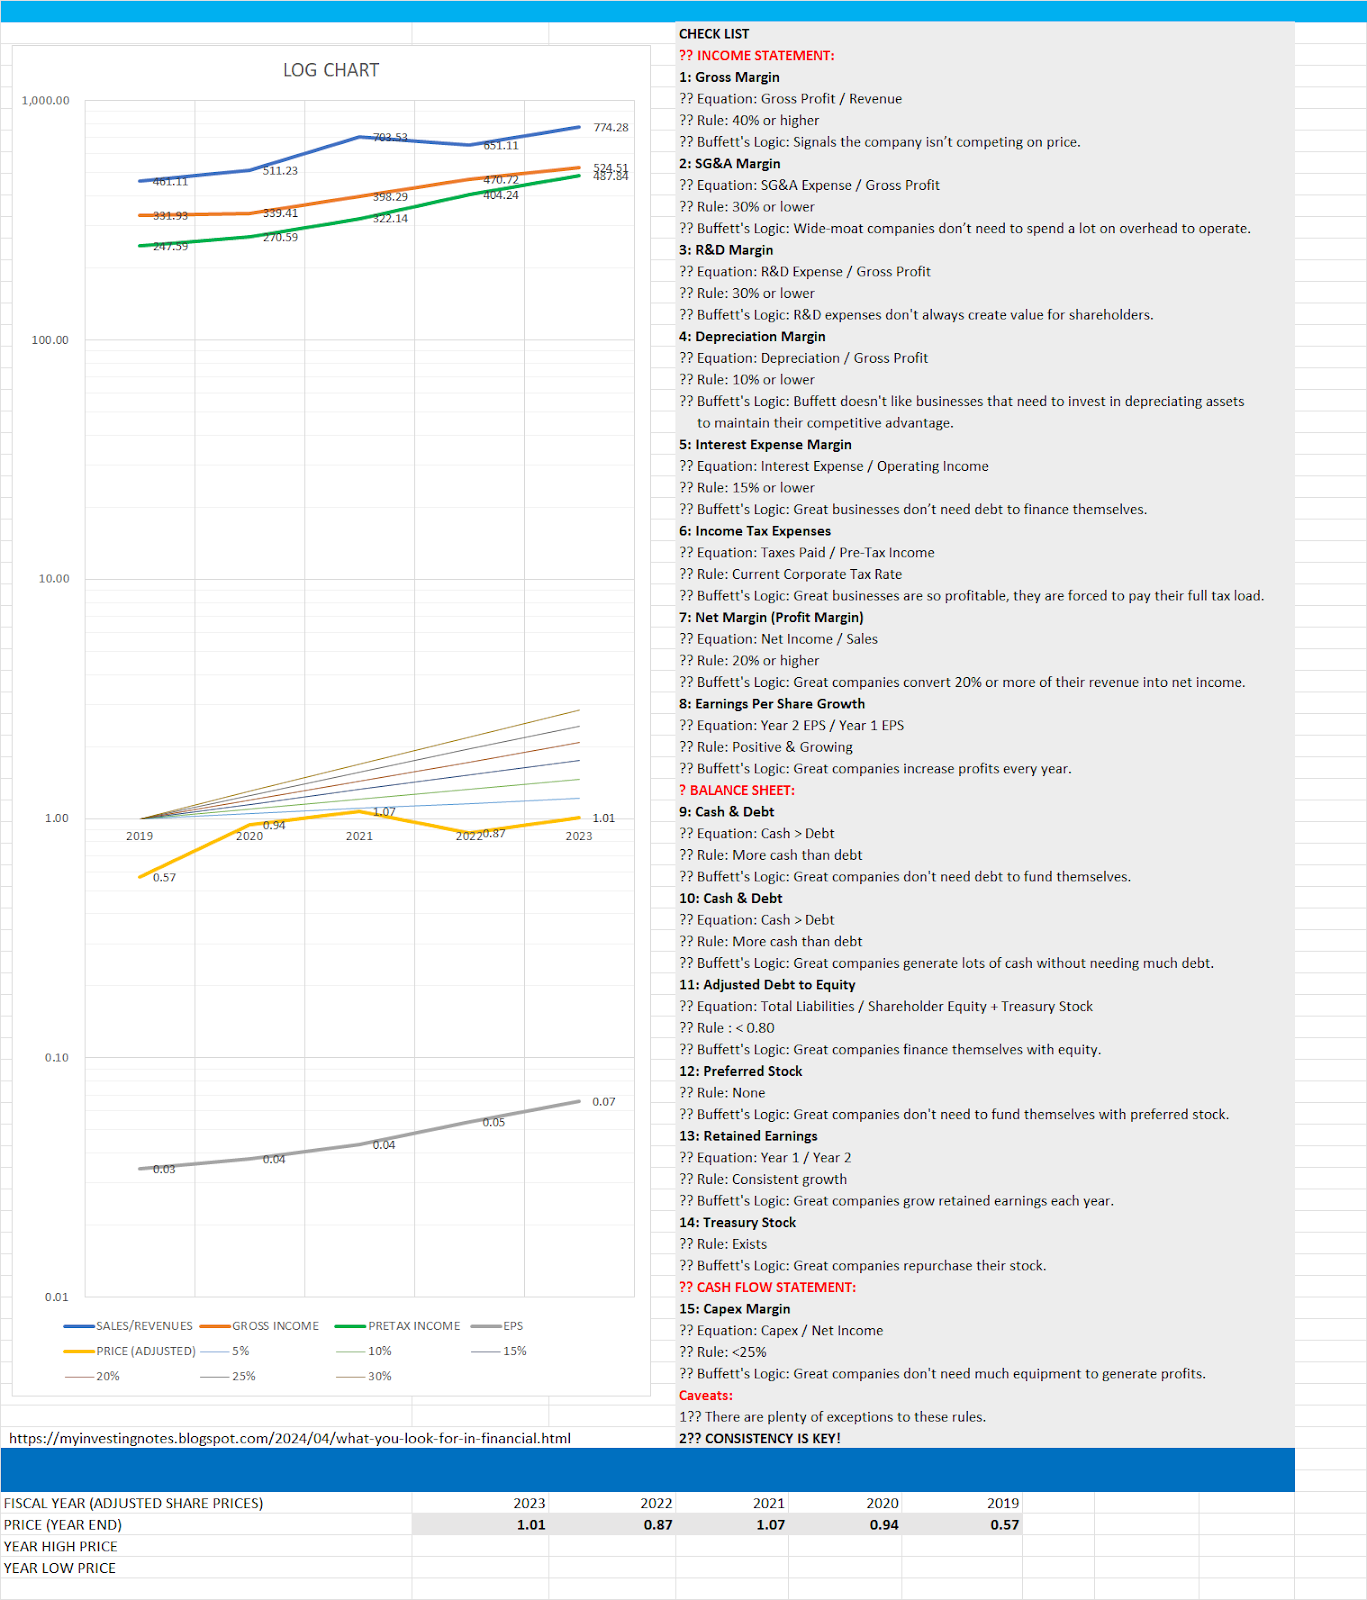
YEAR                        2019   2020   2021   2022   2023
REVENUE                  461     511     703     651     774
EBIT                           257     283      332      399    583
INTEREST EXP            7         8        6.7       9.2     40
NET PROFIT              242     269     316     399     488


YEAR                          2019   2020   2021   2022   2023
CA                                  325   551     649      850    1148
NET PPE                       314    337     311      390      368
INTANG, ASSETS         18      18     343      783    1226
TOTAL ASSETS         1030   1417  1884   2540    3218
TOTAL EQUITIES       708   1143  1541    1872    2200
TOTAL LIAB.               322    274    342      668    1017

AR                               219     241      372      663    700

ST DEBT                      49       48        68      158    152            
LT DEBT                    137     123        98      325    728
TOTAL DEBT            186     171      166      483    880

DIVIDENDS                66       87        79        45      47


YEAR                         2019   2020   2021   2022   2023
NOCF                          154     295      121      304    502
CAPEX(F.A.+ OTH)     70      52      285       542    482
CAPEX(F.A.)                 70      52       42         75      14
CAPEX(OTHER A.)        -        -      243       467    468

FCF                                 84    243   -164      -238     20


Thursday, 28 September 2023

MYEG


MYEG

Growth in revenues and PBT was very fast in its early years.  Growth in revenue has slowed,  though PBT in 2022 was higher due to better profit margin.  Its earnings dropped in 2020 and has since recovered, exceeding its previous high earnings.


The share price of MYEG has been essentially flat since 2021.  With its better earnings, the company is now on offer at better value than before.

Friday, 15 September 2023

MYEG


2009 to 2022

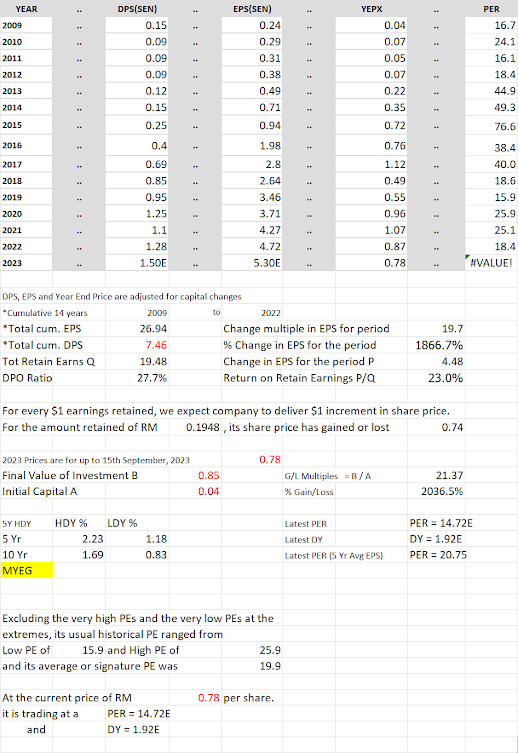
It EPS grew from 0.24 sen in 2009 to 4.72 sen in 2022.  It had grown its EPS 19.7x.

Its EPS grew 11.7x, at a fast rate from 0.24 sen in 2009 to 2.8 sen in 2017.  Its EPS dropped from 2.8 sen inn 2017 to 2.64 sen in 2018.  From 2018, its EPS grew from 2.64 sen to 4,72 sen in 2022; it grew 1.8x.  

Its PE expanded from PE of 16.1 in 2009 to PE of 76.6 in 2015.  From 2015/16, its PE contracted from this highest PE to PE of 18.4 in 2022. 

Excluding the extremely high PEs and extremely low PEs,  the usual historical PE for MYEG ranged from low PE of 15.9 to high PE of 25.9 and its average or signature PE was 19.9.

It paid out 27.7% of its earnings as dividends and grew its earnings by 4.72 sen - 0.24 sen = 4.48 sen.  It retained 26.94 sen - 7.46 sen =  19.48 sen.  The return on its retained earnings is thus, 4.48 sen / 19.48 sen = 23%.

Its usual DY ranged from low DY of 0.83% to high DY of 2.23%.   

At the current price of RM 0.79 per share, it is trading at a PE of 14.8x and its DY is 1.91%.  


Saturday, 23 June 2012

Investor's Checklist: Business Services

Understand the business model.  Knowing if a company leverages technology, people, or hard assets will provide insight as to the kind of financial results the company may produce.

Look for scale and operating leverage.  These characteristics can provide significant barriers to entry and lead to impressive financial performance.

Look for recurring revenue.  Long-term customer contracts can guarantee certain levels of revenue for years into the future.  This can provide a degree of stability in financial results.


Focus on cash flow.  Investors ultimately earn returns based on a company's cash-generating ability.  Avoid investments that aren't expected to generate adequate cash flow.

Size the market opportunity.  Industries with big, untapped market opportunities provide an attractive environment for high growth.  In addition, companies chasing markets perceived to be big enough to accommodate growth for all industry participants are less likely to compete on price alone.

Examine growth expectations.  Understand what kind of growth rates are incorporated into the share price.  If the rates of growth are unrealistic, avoid the stock.  


Ref:  The Five Rules for Successful Stock Investing by Pat Dorsey


Read also:
Investor's Checklist: A Guided Tour of the Market...

Thursday, 2 September 2010

Nine Malaysian firms on Forbes’ ‘best under a billion’ list

Nine Malaysian firms on Forbes’ ‘best under a billion’ list

September 02, 2010


KUALA LUMPUR, Sept 2 — Nine Malaysian companies have made it to Forbes magazine’s ranking of best performing listed Asian companies with revenues under US$1 billion (RM3.1 billion).

Malaysia tied with Thailand for the sixth most number of entries on the list after China/Hong Kong with 71, India (39), South Korea (20), Taiwan (19) and Australia (13).

Singapore had eight entries on the list while Japan had two, down from 24 due to domestic economic woes.
“In aggregate the market-cap-weighted shares of our 2010 class were up 43 per cent over 12 months versus 21 per cent for the FTSE Asia Pacific Small Cap stock index,” said Forbes.

The nine Malaysian entries this year represented an increase of one over the eight entries it had on the list last year.

One Malaysian newcomer to the list, glove maker Hartalega Holdings, was profiled by the magazine.
The other companies were RFID solutions provider CBS Technology, marine services provider Coastal Contracts, herbal care multi-level marketing company Hai-O Enterprise, steel pipe maker KKB Engineering, glove maker Latexx Partners, construction company Mudajaya Group, e-government service provider My EG Services and IT firm Willowglen MSC.

The Singaporean entries were real estate fund manager ARA Asset Management, marine equipment manufacturer Baker Technology, furniture maker Design Studio Furniture, engineering outfit Hiap Seng Engineering, property developer Ho Bee Investment, infrastructure builder OKP Holdings, clean room supplier Riverstone Holdings and mining company Straits Asia Resources.

This year also marked the first time a Vietnamese company made it to the list — dairy outfit Vinamilk.

“Its history reflects the different nature of enterprises in nations with long-standing state dominance,” said Forbes.

The annual “Best Under A Billion” list picks the top-performing 200 firms from close to 13,000 listed Asia-Pacific companies with actively traded shares and sales of between US$5 million and US$1 billion.
Selection of the final 200 was based on earnings growth, sales growth, and shareholders’ return on equity in the past 12 months and over three years.

Prime Minister Datuk Seri Najib Razak said recently that small-medium enterprises (SMEs) are the backbone of the Malaysian economy.

SMEs contribute about one-third of Malaysia’s GDP and account for 20 per cent of its exports.

http://www.themalaysianinsider.com/business/article/nine-malaysian-firms-on-forbes-best-under-a-billion-list/

Thursday, 22 April 2010

A quick look at MYEG (22.4.2010)

My E.G. Services BHD Company

Business Description:
My E.G. Services BHD. The Group's principal activities are developing and implementing Electronic Government Services project and providing other related services. It also operates as an investment holding company. Operations are carried out wholly in Malaysia.

Stock Performance Chart for My E.G. Services BHD

Wright Quality Rating: LBNN Rating Explanations


A quick look at MYEG (22.4.2010)
http://spreadsheets.google.com/pub?key=tdVSwe6o2iz4DJ2U8bjPxqg&output=html


More details:

MY E.G. SERVICES BERHAD
STATUS : ACTIVE
COUNTRY Malaysia
SIC CODE CMP PROCESSING,DATA PREP SVC (7374)
10TH FLOOR MENARA HAP SENG, NO 1 & 3 JALAN P RAMLEE, KUALA LUMPUR
Tel: (60) 3 2382 4288
Fax: (60) 3 2382 4170

PROFILE BRIEF
My E. G. Services Berhad (MYEG) is principally engaged in the Electronic Government (E-Government) and Electronic Services (E-Services) industry. MYEG operates in two business divisions Government to Citizen (G2C) and Government/Enterprise Solution (GES). G2C services refers to services, such as driving theory test bookings, issuance and renewal of licenses, electronic bill payment and payment, as well as online information services, such as traffic summons checking and electronic bankruptcy or liquidation status searches. GES are non-Internet-based services, such as software and enterprise solutions, system development and maintenance, as well as services rendered at the E-Services Centers. These services are non-Internet-based and cannot be transacted by citizens independently.

DIRECTORS/ADVISORS
COB NORRAESAH BINTI HAJI MOHAMAD
CEO/MD/PRESIDENT THEAN SOON WONG
AUDITOR HORWATH