Price per share 72 sen
These financial metrics (based on trailing twelve months, or TTM) paint a very clear, classic picture of Top Glove: it is a "Turnaround" stock trading at a "Growth" premium.
For a lay investor, these numbers tell you that the company has solid assets and a recovering business, but the market is already asking you to pay for future success, not current achievements. Here is a plain-English breakdown of what each number really means.
1. The Recovery is Real, But Still Weak (Net Margin & ROE)
Net Margin (4.9%) and ROE (3.83%): These are the most critical numbers in the list. A 4.9% profit margin means that for every RM1.00 of gloves Top Glove sells, it keeps less than RM0.05 as profit. Historically, during its boom years, this figure was over 40%. While this is a massive improvement from the losses it suffered a couple of years ago, it is still razor-thin for a manufacturing giant.
The ROE (Return on Equity) of 3.83% is particularly telling. It means the company is only generating RM3.83 of profit for every RM100 of shareholder money invested in the business. For context, you could earn close to that in a fixed deposit account with zero risk. This proves that while operations are healing, Top Glove is not yet generating spectacular returns on its massive factory base.
2. The Market is Pricing in a Bright Future (P/E Ratio of 31.3x)
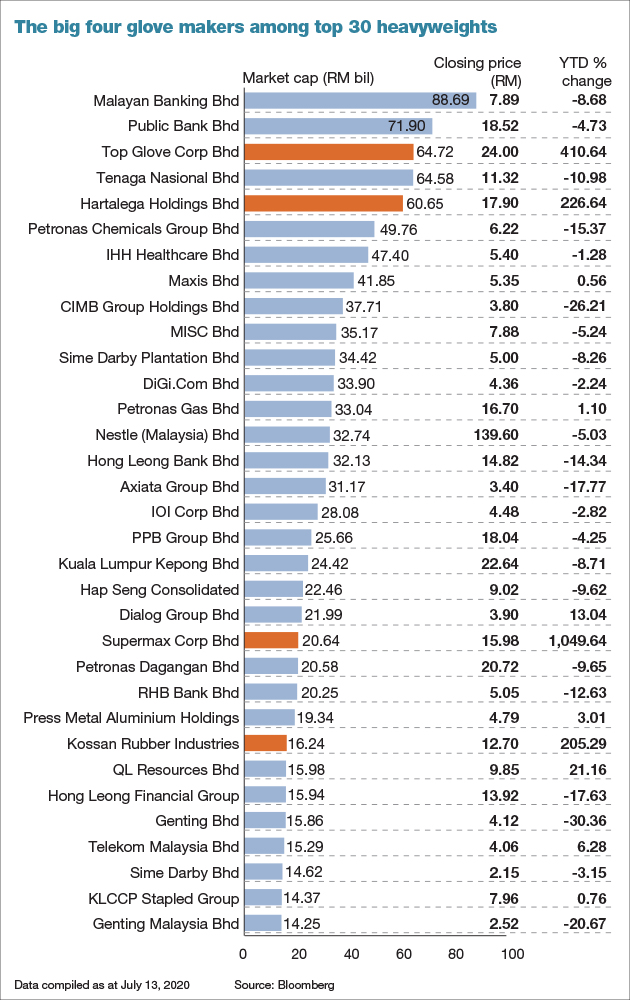
This is the biggest red flag for a value investor, but a sign of hope for a growth investor. At 31.3 times earnings, Top Glove is considered expensive by manufacturing industry standards (most glove makers historically trade between 15x to 25x).
By paying RM31 for every RM1 of current annual profit, the stock market is explicitly saying: "We believe the current weak profits (4.9% margin) are temporary, and we expect profits to rise sharply in the coming years." If margins double or triple, today's high P/E will quickly look cheap. However, if the recovery stalls, the stock is vulnerable to a sharp correction.
3. The Safety Net: Asset Backing (P/B Ratio & NTA)
NTA (Net Tangible Assets) of RM0.60 and a P/B (Price-to-Book) of 1.20 is the most reassuring part of this data. NTA is the theoretical value of all the company's physical factories, land, machinery, and cash, minus all its debts, divided by the number of shares.
At RM0.60 NTA, the company has very solid hard assets. Since the stock is trading at ~RM0.72 (implied by the P/E and EPS), you are only paying a 20% premium (1.2x) over the breakup value of the company. This "cheap" asset valuation acts as a safety floor—if the business recovery fails, the physical assets largely back up the share price, preventing a total crash.
4. The Earnings Reality (EPS of 2.30 sen)
An annual EPS of 2.30 sen means that for every share you own, the company is generating just over 2 sen in profit per year. If you bought the stock at ~72 sen, your "earnings yield" (the inverse of P/E) is roughly 3.2%. This is a low current return, reinforcing that investors are here for the turnaround story, not the dividends or immediate cash flow.
The Critical Synthesis for a Lay Investor:
Looking at all these numbers together, Top Glove is a high-conviction recovery bet.
The Good: The balance sheet is incredibly strong (NTA of RM0.60 means the stock is not overvalued on an asset basis). The low P/B ratio gives you a margin of safety. The business is clearly selling more gloves and moving back into profitability.
The Catch: The market is already pricing in a successful recovery (P/E of 31x). For you to make good money from this price, Top Glove must significantly improve its ROE and Net Margin over the next 1-2 years. If they only manage to maintain the current 4.9% margin, the stock is overvalued.
The Verdict: You are not buying a cheap, beaten-down company; you are buying a recovering giant with a strong asset base. The reward is substantial if management can push net margins back towards 10%-15%. The risk is that the recovery takes longer than expected, and the market eventually punishes the high P/E ratio. Given its fortress balance sheet (low debt, high cash), the downside is limited, but the upside depends entirely on whether the operational improvements discussed in the quarterly report can translate into sustainably higher profits. It is a "show-me" story—they have the assets, but they need to prove they can generate the returns.
=====
Topglove
Top Glove looks like a recovering industry giant with strong financial defenses and improving operations. It is selling more gloves, running its plants efficiently, and has a debt-free balance sheet that offers downside protection. Yet the investment case is not without risk: the business remains highly sensitive to raw material prices, currency swings (given its US-dollar sales), and the quality of its financial reporting (major error in its net operating cash flow in the latest cash flow statement)..
An investor should watch the next quarter closely to see if margins hold up and whether the company can turn its operational strength into clean, reliable cash generation.