A summary and discussion of Meta’s five‑year annual income statements (2021–2025) and the latest five quarterly statements (Q1 2025 – Q1 2026).
---
### Five‑Year Annual Summary (2021–2025)
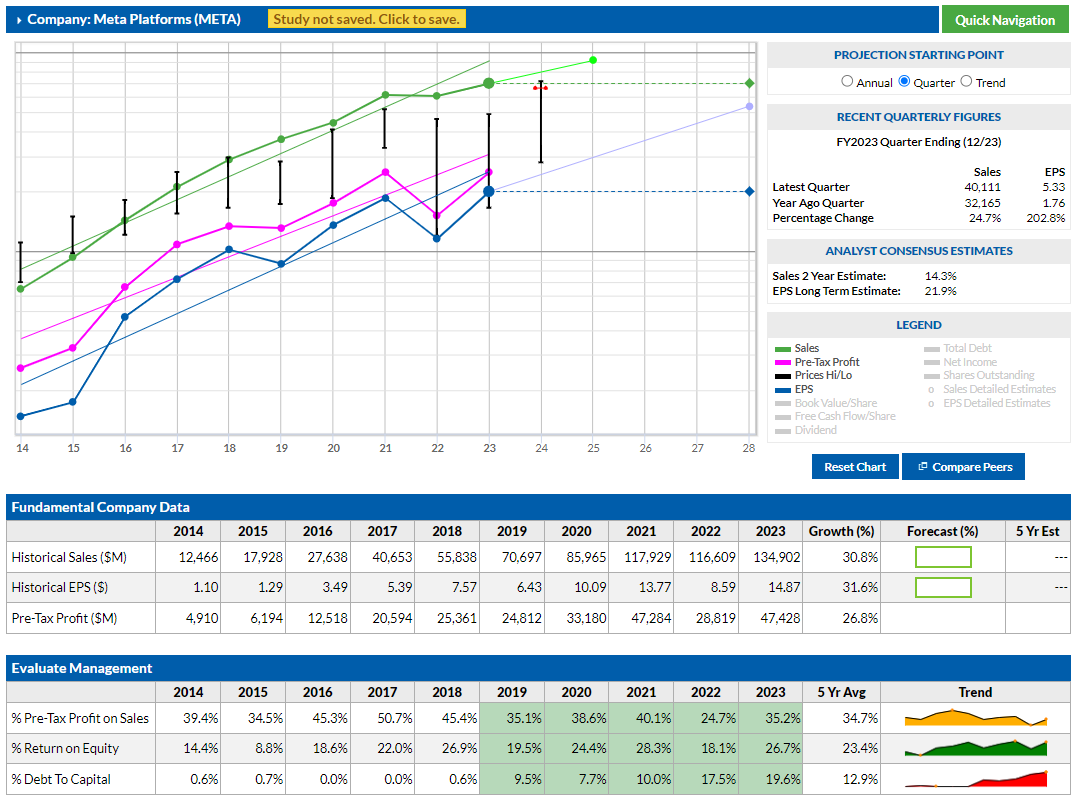
Over the past five years, Meta has delivered strong top‑line growth with revenue rising from $117.9 billion in 2021 to $200.9 billion in 2025, representing a compound annual growth rate of approximately 14%. After a slight revenue decline of 1.1% in 2022, growth re‑accelerated to 15.7% in 2023, 21.9% in 2024, and 22.2% in 2025, indicating a robust recovery driven by stronger advertising demand and improved monetization. Gross profit margin improved steadily from around 80% in 2021 to 82% in 2025, reflecting efficient cost of goods sold management. However, operating expenses – particularly research and development – grew dramatically; R&D spending more than doubled from $24.7 billion to $57.4 billion over the five years, as Meta invested heavily in artificial intelligence, data center infrastructure, and the metaverse. Selling, general and administrative expenses also increased but at a more moderate pace. Earnings before interest and taxes (EBIT) grew from $46.8 billion in 2021 to $83.3 billion in 2025, though 2022 was a weak year due to $4.6 billion in unusual expenses. Net income showed volatility: it fell to $23.2 billion in 2022, rebounded to $39.1 billion in 2023 and $62.4 billion in 2024, then declined slightly to $60.5 billion in 2025 – a 3% drop despite the 22% revenue increase. This anomaly is almost entirely explained by a surge in income tax expense to $25.5 billion in 2025 from $8.3 billion in 2024, driven by a large deferred domestic tax charge of $18.8 billion, which appears to be a non‑cash, one‑time item. Consequently, diluted earnings per share followed a similar pattern: $13.77 in 2021, $8.59 in 2022, $14.87 in 2023, $23.86 in 2024, and $23.49 in 2025. Depreciation and amortization expense more than doubled over the period, reaching $18.6 billion in 2025, consistent with Meta’s heavy capital expenditure on servers and facilities. Overall, the annual data show a company with powerful revenue momentum and stable gross margins, but with reported net income increasingly distorted by tax accounting and high investment spending.
### Latest Five Quarters (Q1 2025 – Q1 2026)
The quarterly data provide a more granular view of Meta’s recent performance and reveal significant volatility in net income driven almost entirely by tax items. Revenue grew sequentially from $42.3 billion in Q1 2025 to $59.9 billion in Q4 2025, a typical seasonal pattern with a strong holiday quarter, then declined 6% to $56.3 billion in Q1 2026 – though on a year‑over‑year basis Q1 2026 revenue was 33% higher than Q1 2025, indicating continued robust growth. Gross margin remained consistently around 82% throughout the five quarters. Operating earnings before interest, taxes, depreciation, and amortization (EBITDA) showed steady improvement, rising from $21.5 billion in Q1 2025 to $30.2 billion in Q4 2025, then easing slightly to $28.9 billion in Q1 2026 in line with the seasonal revenue dip. However, reported net income was highly erratic: Q1 2025 net income was $16.6 billion, Q2 2025 $18.3 billion, Q3 2025 plunged to just $2.7 billion, Q4 2025 rebounded to $22.8 billion, and Q1 2026 surged to $26.8 billion. The Q3 2025 collapse was not due to operational weakness – revenue was $51.2 billion and EBITDA was $25.5 billion – but rather an enormous income tax expense of $19.0 billion, likely a one‑time deferred tax charge or settlement. Conversely, Q1 2026 net income received a tax benefit of negative $5.0 billion, artificially boosting the bottom line. Interest expense grew from $240 million in Q1 2025 to $562 million in Q1 2026, reflecting higher debt or interest rates, and an unusual expense of $1.4 billion appeared in Q1 2026, possibly for restructuring or legal matters. In summary, the quarterly statements confirm that Meta’s core operations remain exceptionally healthy – revenue growth is accelerating, EBITDA is strong and stable, and gross margins are best‑in‑class – but reported net income has become a misleading metric due to large, non‑recurring tax adjustments. Investors and analysts are better served by focusing on revenue, EBITDA, and free cash flow to assess the underlying business momentum.