Entrepreneurs establish and grow their business for essentially one reason - reward.
That reward can come in many forms whether it be fulfilling a passion, gaining respect or recognition or achieving a lifestyle. One common trait through all business owners is that they want to build value.
We have seen many business plans, long or short, simple and sophisticated. However, a consistent fault with many is that they do not reference their actions or strategies against what impact these may have on the business value - short or long-term. When asked why, a typical response is that they do not know how to realistically value the business - hence, have no measurement tool.
At another level, we continually try to give the message to business owners that they should always have an exit or succession plan, no matter what stage of their business' lifecycle. Whether it be via family succession, management buy-out, trade sale or IPO, the plan for exit will or should largely drive the actions and strategies of the business to increase value.
So, what is a business worth? In very simple terms, it is the best price you can get at a given time. The price issue is long-standing. The seller wants to get as much as possible, the buyer wants to pay as little as possible, and the value lies somewhere in between. However, this is not always reasonable. For example, at a given time, there may be no buyers or investors that have expressed an interest. You should not therefore conclude that the business is worth nothing. So how can you arrive at a reasonable valuation, or if you are selling, a realistic asking price?
http://www.mondaq.com/australia/article.asp?articleid=68178
Friday, 13 November 2009
ABOUT EXPECTATIONS INVESTING
ABOUT EXPECTATIONS INVESTING
Expectations investing represents a fundamental shift from the way professional money managers and individual investors select stocks today. It recognizes that the key to achieving superior investment results is to begin by estimating the performance expectations embedded in the current stock price and then to correctly anticipate revisions in those expectations.
Conventional wisdom suggests that investors need a host of approaches to value different businesses. Expectations investors recognize that while various businesses have different characteristics, it is important to value all companies using the same economic approach.
TEN RULES FOR EXPECTATIONS INVESTING
Here are ten expectations investing rules to increase your odds of generating superior returns.
1. Follow the cash. Investor returns come from two sources of cash—dividends and changes in share prices. But a company cannot pay dividends unless it is able to produce positive cash flows. So without the prospect of future cash flows, a company commands no value. Stock prices therefore reflect transactions between investors willing to sell the present value of a company’s expected cash flows and buyers who are betting on higher cash flows in the future. Cash flow is how the market values stocks.
2. Forget earnings and price-earnings multiples. Savvy investors don’t rely on short-term metrics such as earnings and price-earnings multiples because they fail to capture the long-term cash-flow expectations implied by the stock price. Indeed, the most widely used valuation metric in the investment community, the price-earnings multiple, does not determine value but rather is a consequence of value. The price-earnings multiple is not an analytic shortcut. It is an economic cul-de-sac.
3. Read market expectations implied by stock price. Rather than forecast cash flows, expectations investing starts by reading the collective expectations that a company’s stock price implies. By reversing the conventional process, you not only bypass the difficult job of independently forecasting cash flows but you can also benchmark your own expectations against those of the market. You need to know what the market’s expectations are today before you begin to assess where they are likely to move in the future.
4, Look for potential causes of revisions in market expectations. The only way for an investor to achieve superior returns is to correctly anticipate meaningful differences between current and future expectations. Investors do not earn superior returns on stocks that are priced to fully reflect future performance. Where do you look for revisions? Changes in volume, selling prices, and sales mix trigger revisions in sales growth expectations. Revisions in operating profit margin expectations originate from changes in selling prices, sales mix, economies of scale, and cost efficiencies.
5. Concentrate analysis on the value trigger (sales, costs or investment) that has the greatest impact on the stock. Identifying the so-called turbo trigger enables investors to simplify their analysis and channel their analytical focus toward the changes with the highest payoffs.
6. Use competitive strategy analysis to help anticipate revisions in expectations. The surest way for investors to anticipate expectations revisions is to foresee shifts in a company’s competitive dynamics. For investors, competitive strategy analysis integrated with financial analysis is an essential tool in the expectations game.
7. Buy stocks that trade at sufficient discounts from expected value. The greater the discount from expected value, the higher the prospective excess return—and hence the more attractive a stock is for purchase. The sooner the stock price converges toward the higher expected value, the greater the excess return. The longer it takes, the lower the excess return.
8. Sell stocks that trade at sufficient premiums over expected value after accounting for taxes and transactions costs. The higher a stock price’s premium to its expected value, the more compelling the selling opportunity. Investors should sell a stock for three reasons: It has reached its expected value, better investment opportunities exist, or the investor revises expectations downward. But even these reasons may not be decisive after incorporating taxes and transactions costs into the analysis.
9. Don’t overlook other significant value determinants that don’t appear in the financial statements. For example, ignoring employee stock options can lead to a significant underestimation of costs and liabilities. Past grants are a genuine economic liability and future option grants are an indisputable cost of doing business. In contrast, real options, the right but not the obligation to make potentially value-creating investments, are often a meaningful source of value for start-ups and companies in fast-changing sectors.
10. Heed the signals sent when companies issue or purchase their own stock. An acquiring company’s choice of cash or stock often sends a powerful signal to investors. Under the right circumstances, buybacks provide expectations investors a signal to revise their expectations about a company’s prospects. Correctly reading these signals provides investors with an analytical edge.
http://www.expectationsinvesting.com/about.shtml
What is Expectations Investing about?
FREQUENTLY ASKED QUESTIONS
1. What is Expectations Investing about?
Stock prices are the clearest and most reliable signal of the market's expectations about a company's future performance. The key to successful investing is to estimate the level of expected performance embedded in the current stock price and then to assess the likelihood of a revision in expectations. Investors who properly read the market expectations and anticipate revisions increase their odds of achieving superior investment results. The expectations investing process allows you to identify the right expectations and effectively anticipate revisions in a company’s prospects. Expectations investing comprises the following three-step process:
Estimate Price-Implied Expectations. The expectations investor “reads” the expectations for cash flow embedded in a company's current stock price.
Identify Expectations Opportunities. The expectations investor then assesses those expectations, evaluates the company's competitive position, and considers the likelihood of upward or downward revisions in those expectations.
Buy, Sell, or Hold? The Expectations Investor makes a buy, sell, or hold decision, making sure that all investments have a clear-cut after-tax "margin of safety" between the stock's price today and the expected price tomorrow.
2. Do I need to be a financial guru to understand and apply the Expectations Investing approach?
If you feel comfortable reading The Wall Street Journal and other leading business and investment periodicals, you should easily grasp the basic concepts presented in the book.
To apply the expectations investing approach to selecting stocks, it helps to be familiar with spreadsheet software such as Microsoft Excel. We have made the spreadsheets presented in the book available for download at this web site, so don't worry; you won't need to create complex spreadsheets yourself!
3. Who should read this book?
This book brings the power of expectations investing to:
Institutional investors, security analysts, and investment advisors. Professional money managers who make investment decisions day-in and day-out, analysts who make stock recommendations, and investment advisors who often make buy and sell decisions for their clients will find that the Expectations Investing approach represents a fundamental shift from the way they evaluate stocks today.
Individual investors. Investment tools presented to the mass market are typically over-simplified so they can be easily understood, but as a consequence lack economic substance. Expectations investing is constructed on top of a solid economic foundation. Implementing expectations investing successfully, however, does require familiarity with the company and its competitive environment, finely honed insight, and dedication.
Corporate managers. We expect Expectations Investing to generate substantial interest in the corporate community. After all, both investors and managers accept stock prices as the "scorecard" for corporate performance. Companies seeking to outperform the Standard & Poor's 500 Index or an index of their peers can use expectations investing to establish the reasonableness of the goal.
Business students. All business schools offer finance courses that cover valuation and courses on competitive strategy. However, there are few courses that bridge competitive strategy and valuation. If you are eager to cross this chasm, Expectations Investing may be the book for you.
4. Can't I "read " market expectations using earnings per share (EPS) or price-to-earnings (P/E) multiples?
The answer is an emphatic "No"!
Investors who use EPS and P/E multiples may have their hearts in the right place, but their money on the wrong idea. Granted, the investment community undeniably fixates on EPS. Business publications amply cover quarterly earnings, EPS growth, and price-earnings multiples. This broad dissemination and the frequent market reactions to earnings announcements might lead some to believe that reported earnings strongly influence, if not totally determine stock prices.
Extensive empirical research finds that the market sets the prices of stocks just as it does any other financial asset. Specifically, the studies show two relationships. First, market prices respond to changes in a company’s cash-flow prospects. Second, market prices reflect long-term cash–flow prospects. Static measures such as reported EPS or estimates of next year’s EPS do not capture future performance, and ultimately they let investors down—especially in a global economy marked by spirited competition and disruptive technologies. Without assessing a company’s future cash-flow prospects, investors cannot reasonably conclude that a stock is undervalued or overvalued.
The investment community’s favorite valuation metric is the price-earnings (P/E) multiple. Presumably a stock’s value is the product of EPS and an “appropriate” P/E multiple. But since we know the EPS denominator of the P/E multiple, the only unknown is the appropriate share price, or P. We therefore are left with a useless tautology: To estimate value, we require an estimate of value.
This flawed logic underscores the fundamental point: The price-earnings multiple does not determine value; rather, it derives from value. Price-earnings analysis is not an analytic shortcut. It is an economic cul-de-sac.
5. Does Expectations Investing fall into the "growth" or "value" investing style?
Please don't associate us with either camp!
Most professional money managers classify their investing style as either “growth” or “value.” Growth managers seek companies that rapidly increase sales and profits and generally trade at high-price earnings multiples. Value managers seek stocks that trade at substantial discounts to their expected value and often have low price-earnings multiples. Significantly, fund industry consultants discourage money managers from drifting from their stated style, thus limiting their universe of acceptable stocks.
Expectations investing doesn’t distinguish between growth and value; managers simply pursue maximum long-term returns within a specified investment policy. As Warren Buffett convincingly argues, “Market commentators and investment managers who glibly refer to ‘growth’ and ‘value’ styles as contrasting approaches to investment are displaying their ignorance, not their sophistication. Growth is simply a component—usually a plus, sometime a minus—in the value equation.”
6. Does Expectations Investing work for technology stocks?
Unquestionably!
Fundamental economic principles endure, and they are sufficiently robust to capture the dynamics of value creation across all types of companies and business models. The principles of value creation—which are central to the expectations investing process—are the ties that bind all companies.
While fundamental economic tenets apply to all companies, when analyzing technology stocks, we have to take into account their source of competitive advantage.
Most technology companies are essentially knowledge businesses that develop a competitive advantage by having their people develop an initial product that is then reproduced over and over again. This contrasts with physical businesses that leverage tangible assets to create a competitive advantage, and service businesses that rely on people as the main source of advantage and generally deliver their service on a one-to-one basis. We need to incorporate the primary characteristics of knowledge businesses into our analyses of technology companies:the importance of product obsolescence, high scalability, the production of "non-rival" goods such as software that can be used by many people at once, the difficulty of protecting intellectual capital, and the existence of demand-side economies of scale.
http://www.expectationsinvesting.com/faq.shtml
Do profits matter? It's a fine line to walk between generating profits and growing.
April 21, 2000 8:15 AM PDT
Patience-to-Earnings ratio wears thin for dot-coms
By Tiffany Kary
Staff Writer, CNET News
.With the Nasdaq well below its March 10 high of 5,048, investors are finally asking what the 'E' in the P/E, or price-to-earnings ratio, means.
Although profits suddenly mean something to dot-com investors, some analysts and executives maintain Net companies still need leeway to build out their businesses.
Do profits matter?
The profit tug-of-war will determine the direction of Net stocks for the foreseeable future, said investment experts. The tug-of-war is already underway -- shares of Excite@Home (Nasdaq: ATHM) fell Thursday after the company said it was foregoing near-term profits for long-term market share. The usually optimistic Merrill Lynch analyst Henry Blodget said he didn't 'see any positive catalysts for the stock.'
And in recent weeks, companies with no roadmap to earnings suffered the most (see chart). Shares of companies like CDNow (Nasdaq: CDNW), DrKoop.com (Nasdaq: KOOP) and Webvan (Nasdaq: WBVN) have been decimated.
As investors shun promising ideas for real results, dot-coms will have to generate cash instead of running back to the market for a quick-fix stock offering. To determine the long-term winners, investors will have to scrutinize business models and look for balance between growth and profitability.
Growth vs. profit
It's a fine line to walk between generating profits and growing. Excite@Home was panned by some analysts because it chose international expansion over immediate profits. The problem? Excite@Home has been profitable and has a track record. The market is more forgiving with promising newcomers.
'Companies that have been around for a while should have profits, but newcomers should be allowed time to build market share,' said Abhishek Gami, analyst for William Blair & Co.
Gami said he would allow business-to-consumer e-commerce companies about 12 to 18 months to become profitable. In the business-to-business space, a company should have as much as two to three years to turn a profit. In B2B, there are only a handful of competitors and a lot of market share to grab. With a portal, he wouldn't look at anything that didn't plan on earnings within 12 to 18 months.
About.com (Nasdaq: BOUT), which is far below its 52-week high of 105 13/16, is caught in the middle.
'Investors are looking at the total market, not individual companies,' said About.com CEO Scott Kurnit. 'They are looking at stock charts, and bringing the company down to at least 50 percent below its 52-week high, without regard for when the company reached its peak, or why.'
Kurnit is hoping a path to profits and strong third and fourth quarters will give About.com a boost. But his company is still in danger: Kurnit said About.com won’t be profitable for another 20 months.
The profit club
About.com is on the outside looking into a club that includes Yahoo! Inc. (Nasdaq: YHOO), eBay (Nasdaq: EBAY), America Online (NYSE: AOL), RealNetworks (Nasdaq: RNWK), Lycos (Nasdaq: LCOS) and Go2Net (Nasdaq: GNET). Inktomi (Nasdaq: INKT) and CNet (Nasdaq: CNET) are the latest members to the profitable dot-com club.
'The end game is, everyone will ask about profitability for every Net stock,' said Go2Net president John Keister. 'In 1997, people were talking about investing in earnings multiples for 2000, and now its 2002. People keep pushing it out.
'Smart investors, and institutional investors may not be satisfied with this anymore. Everyone has to trade on a multiple of earnings and revenue growth,' said Keister.
Leadership counts too
Leadership also counts for a lot. Chuck Hill, director of research at earnings tracking firm First Call, noted that profitable companies such as Yahoo, Go2Net, RealNetworks, AOL and Lycos have held up better than others, but said it doesn't have much to do with earnings. Hill said those companies are seen as industry leaders, which will survive. 'Even these companies are selling at multiples that are questionable,' he added.
'When a new company comes along, it's valued as a concept. Then there's a correction, and those that survive go on to be a good growth stock,' Hill said.
http://news.cnet.com/Patience-to-Earnings-ratio-wears-thin-for-dot-coms/2100-12_3-262272.html
Valuation Methodologies
Despite their widespread usage, only limited theory is available to guide the application of multiples. With a few exceptions, the finance and accounting literature contain inadequate support on how or why certain multiples or comparable firms should be chosen in specific contexts. Compared to the DCF and RIV approach, standard textbooks on valuation devote little space to discussing the multiples valuation method.
Valuation Methodologies
This note provides an overview of the wide range of methodologies employed by Davy analysts when valuing shares.
One approach used is to apply average valuation multiples derived over multi-year periods, primarily with a view to smoothing cyclical effects.
Share-based multiples include:
Historic and forward price/earnings (P/E) ratios, based on normalised earnings before goodwill amortisation
Historic and forward price/cash-earnings (pre-depreciation) ratios
Price to net asset value per share
Dividend yields
Enterprise-based valuation multiples include:
Historic and forward earnings before depreciation, interest, tax, depreciation or amortisation (EBITDA) ratios; EBITDAR ratios are used where rental/lease charges (R) are material
Historic and forward EBITA ratios
Historic and forward operating cash-flow ratios
Enterprise value (EV)/sales ratios
EV/invested capital ratios
As enterprise values include net financial liabilities and minority interests, these are then deducted to arrive at the residual equity value.
Cyclical considerations
In the case of average earnings multiples, cognisance is given to the stage of the relevant industry cycle, as it may not be appropriate to apply average multiples towards the peak or trough of a cycle. In such cases, earnings multiples prevailing at the corresponding stages of previous cycles may be used.
Asset-based valuations
In the case of asset-based valuations, reported net assets generally provide a floor to a company's valuation. In many cases, however, company accounts can understate the underlying economic value of a company's assets, and a ratio such as return on invested capital to weighted average cost of capital (ROIC/WACC) may provide a more appropriate indicator of the book value multiple.
Company comparisons
The ratings of similar companies may be taken into account in valuing shares, as indeed may average ratings for particular industry sectors. Such ratings are commonly used in analysts' sum-of-the-parts (SOTP) valuations.
Cash-flow based valuation
In discounted cash-flow (DCF) models a company's forecast future free cash-flows are discounted by its weighted WACC. Due to the uncertainties involved in forecasting long-term cash-flows, analysts use a number of different DCF models.
Other valuation techniques
In some instances, other valuation metrics may be used. For instance, enterprise value per tonne of installed capacity may be used in capital-intensive sectors or in the earlier stages of a company's development.
http://www.davy.ie/Generic?page=valuationmethodologies
Fair market valuation of a business
Fair market valuation of a business
Table of earnings multiples for groups of industries
(choose the earnings multiple for the industry closest to the one you are valuing)
Very narrow profit variation - 10 times average earnings
Cosmetics; Food; Tobacco; Utilities
Moderately narrow profit variation - 9 times average earnings
Amusement; Beverages; Chemical; Container; Drug; Meat Packing; Oil; Paper / Paper Products; Retail Trade; Sugar; Textile
Moderately wide profit variation - 7 times average earnings
Advertising; Agricultural Impt.; Aviation; Boots and Shoes; Coal; Electrical Equipment; Household Products; Financial; Leather; Office Equipment; Printing; Publishing; Radio; Railroad; Rubber; Shipping; Ship Building
Very wide profit variation - 6 times average earnings
Automobiles; Automobile Accessories; Construction; Machinery; Non-Ferrous Met.; R.R. Equipment; Steel
http://www.investordesktop.com/calcs/calcs/busins_fmvb_tbl.htm
Price to earnings ratio (P/E ratio) explained
Price to earnings ratio (P/E ratio) explained
by Kenneth W. McCarty
Price to earnings ratio (P/E ratio sometimes referred to as the multiple) is the current price per share divided by a years worth of earnings per share (EPS) for a particular stock. It is an important indicator of perceived value for a stock. Often it is used to compare two different stocks in the same sector (or two sectors in a given market) in an effort to find the better "deal". It sounds simple enough, but in practice it is a bit more complicated.
Not all publicly traded companies have earnings (they can have losses instead), yet these stocks clearly have value. P/E in such circumstance cannot be relied upon when it is negative or undefined. Much more important for estimating the current value of this type of equity are such things as cash on hand and other tangible assets. Some investors may anticipate that the stock will eventually have real earnings and add perceived value to the stock based on this assumption.
A backwards or "trailing" P/E takes into account only the earnings for the past year. In a "Bull Market", this form of P/E can be considered an indicator for the floor of a stock's share price. Instead of estimates, the earnings stated in the last 4 quarterly reports are publicly known and are generally not subject to change at a whim (except when future reports become current or the company is forced to make restatements by the SEC or an unfavorable audit).
Many investors prefer to use a forward P/E instead. This speculative potential of the stock's perceived worth that may or may not be added into the price anticipates and uses earnings over the next 12 months. Market forces determine how reliable such calculated predictions are and adjust prices accordingly. Company track records and economic influences are used by traders to judge the reliability of those numbers.
The difference between the two values that forward and backward P/E represent helps create volatility in the price of the stock as traders try to forecast earnings. Different stocks trade over different ranges of multiples for a variety of reasons. Many stocks in mature industries historically tend to trade between multiples of 10 and 20. Technology stocks that have real earnings often trade between multiples of 20 and 40. A company that has significant revenue growth may deserve a much higher multiple than this because the implication is that notable future earnings growth will continue to occur. When track records for 10Q quarterly reports are consistently positive, investors tend to follow the idea that solid companies under good management will continue to notify the market of future earnings growth. Investors like to trade on trends because "the trend is your friend".
When traders and investors on the market either become extremely pessimistic or optimistic, historical range standards for P/Es generally do not hold true over the short-term. During the height of the stock bubble of 1999 and 2000, too many stocks traded with ratios over 500! Such imbalances are eventually corrected and that is what happened. Knowing the historical standards gives us insight into why those stock prices eventually crashed so abruptly and steeply. The trend could no longer continue.
In contrast, currently there is a dramatic pessimism depressing prices in the stock market (since November of 2007). I've seen a number of technology stocks trade with a backward P/E of 10 or lower. Certainly in this financial environment a P/E of around 15 seems common for even a technology stock! Some might even consider the trend justified because of the implications inherent from a failing sub-prime loan market. Yet these P/E ratios are far below the historic average even in the worst of times.
Even more unusual is that some of those same stocks are experiencing record breaking increased earnings with projected significant earnings growth - despite the continued horrendous condition of the financial sector. Some of these stock's earnings performance over the last 6 to 9 months have even been better than the most optimistic expectations. Yet a few of these top performers have had their price cut nearly in half with little to no recovery! Clearly there are forces other than just P/E ratios and growth potential at work when the market determines the worth of a given stock at any given time. Part of my job as a trader is to ask why this is happening at this particular time and respond appropriately. Keep in mind that history tells us a significant correction to the upside is inevitable once investors recognize the "good deals" available.
http://www.helium.com/items/1082973-what-is-pe-ratio
When to start investing for retirement
When to start investing for retirement
by Janet Grischy
The best time to prepare for your retirement is when it seems much too far off to worry about. People in their twenties and early thirties know they have years before retirement, but they may not know how quickly those years will pass. Money put into a retirement vehicle in your youth is worth ten times or more what the same amount will be worth if socked away at age 59. That's because of compounding.
Compounding is the magic ingredient in retirement investing. It can turn a pile of small investments into millions, given time. The longer an investment has to grow, the more likely you'll retire as a billionaire. This is because as the years pass you get a return on your investment, and then a return on the return, and then a return on the return on the return, and so on.
Many people start investing for retirement when they get their first "real" job, when their company or union makes a payroll deduction plan available to them. That way, money is taken out of their pay before they ever see it, and preparing for the future is easy, because it's automated. Americans who are self-employed, or who change jobs often, need to start their own investment plan, making it a habit to consistently put money in an IRA or Keogh each pay period.
Money in an IRA or Keogh avoids taxes, either when it's put in or when it is taken out, and it's all quite legal! Without the drag of taxes to slow you down, you can invest more, faster. It will grow much faster too. Your investing also helps your country, by adding to the stock of capital available to business and industry.
Another good time to invest is in your thirties and forties. Now you are mature, and acquainted with the financial realities of life. You have a clear idea of the kind of retirement you want, and can make a plan to go after it. You'll have to save a bit more than you would have if you'd started sooner, but you may be making more than you did then, too.
Even the fifties and sixties are a good time to start investing for retirement. The government knows that you have to make up for the investments you neglected to make earlier, so it permits larger contributions to your IRA at this age. The sense of urgency you feel will also help guide you when you make decisions that will affect your finances.
When is the best time to prepare for your future by investing for retirement? There's a simple answer to that question. Now.
http://www.helium.com/items/1248480-when-to-start-investing-for-retirement
WHAT DOES PE RATIO TELL YOU?
WHAT DOES IT TELL YOU?
The P/E ratio gives us an idea of how much the investors are willing to pay for the company's earnings. The higher the P/E, more the chances of good earnings in the future and the higher premium investors are ready to pay for that anticipated growth. A lower ratio on the other hand means just the opposite; that the market has ruled out the company.
But just because the ratio is very high or very low cannot help investors to make a decision. A high P/E can also be an overpriced stock. Also if one stock has double the P/E of another stock in the same industry, but with the same rate of earnings growth, it is not seen to be a wise investment as more money has to be shelled out. A low P/E ratio may be a market that was overlooked. The investors who discover the true worth of such stocks make big fortunes overnight.
There are various interpretations for the P/E value and this is just one of them:
*N/A: A company with no earnings has an undefined P/E ratio. Companies with losses or negative earnings also fall under this category.
*0-10: This means that the company's earnings are declining. It could also mean an overlooked stock.
*10-17: This is the average healthy value
*17-25: This means that the stock is either overvalued or its earnings are increasing.
*25+: Such companies are expected to have high future growth in earnings.
It is important that investors note avoid basing a decision on this measure alone. The ratio is dependent on share price which can fluctuate according to changes in the market.
http://www.helium.com/items/1059698-price-to-earnings-ratio-pe-ratio-explained
Demystifying Small Business Valuation
Demystifying Small Business Valuation
Valuing a business is based on return on your investment (ROI). The value of a Business for Sale does not need to be subjective and can be based on several attributes and industry best practices.
Approach to Business Valuation
Valuing businesses is of paramount importance to a small business. It is one of the several metrics used to ensure the business is growing and creating value for the owners. There are several approaches to valuing a business including:
• Revenue Multiples
Earnings Multiples (including EBITA and operating income)
• Multiple of Book Value
Multiple of a measured unit (Like Restaurant tables, hospital beds, subscribers and more)
Rules of thumb are used by business brokers to ascertain the price of a business and simplify the valuation process. However, one must be mindful that the values determined using “Rule of thumb” are simplifications and only an estimate of the true value of the business. The “Rule of thumb” approach is used as a staring point before conducting detailed due-diligence to ascertain the correct value. Some examples of “Rules of thumb” used in the industry are listed in Table 1 below:
Table 1: Rules of Thumb Valuation
Type of Business “Rule of Thumb” valuation
Book Stores 15% of annual sales + inventory
Coffee Shops 40% - 45% of annual sales + inventory
Food/Gourmet Shops 20% of annual sales + inventory
Gas Stations 15% - 25% of annual sales + equip/inventory
Restaurants (non-franchised) 30% - 45% of annual sales
Dry Cleaners 70% - 100% of annual sales
A common approach to valuing a business is to use earnings or sales multiples. In this case since the price it is derived from annual earnings or sales and it directly addresses a buyer’s motive of estimating the return on investment (ROI) on deals.
When using earnings multipliers, it is inappropriate to get the multiples from Real Estate or Stock Markets. Real Estate is historically priced at 8 to 10 times its net operating income (EBITA). Stock markets are typically priced at 12 to 20 times earnings. These multiples do not apply to small businesses as the risk premium associated with a small business is much higher than managing a building or a stock portfolio.
Therefore, the first step in using the earnings multiplier approach is to determine which earnings multiplier is to be used. For example, one could use the current earnings, next year’s earnings or last 5 years earnings averaged. Other factors to consider include determining the composition of earnings. Do we need to calculate earnings after owner’s pay and perks, interest expenses, depreciation and taxes? The preferred earnings to use are 'Earnings before Interest and Taxes’ (EBIT).
Normalized earnings are adjusted for cyclical ups and downs in the economy. They are also adjusted for unusual or one-time influences. For small businesses normalized earnings projections are quite useful.
Finally we need to determine the multiplier. The number picked for multiplier is based on risk and there usually are “Rules of Thumb” multiplier numbers depending on the industry.
Using a multiplier with annual sales is also a common approach. For example, the “Rule of thumb” for a coffee shop is 40% - 45% of annual sales + inventory.
Tangible and Intangible assets
A tangible asset is an asset that has a physical form such as land, buildings and machinery. Intangible assets are the opposite of tangible assets. Intangible assets include patents, trademarks, brand value etc. Tangible and intangible assets raise interesting questions when valuing a business.
Typically once the value of the business itself has been ascertained, we need to factor in a value for Tangible and Intangible assets. These assets usually have a value separate from the business. One way to determine if an asset should be included as a tangible/intangible asset or included in the price for the business is to determine if the asset was used to generate the projected earnings. If the asset was used to generate earnings it should be included as a part of the multiple derived price of the business.
Factoring in tangible assets separately is especially true for businesses that own land and buildings, as these assets can be sold in the market even if the business failed. Therefore the best way to treat tangible/intangible asset is to separate them from the business and then add them back to the multiple derived value of the business. Obviously during the valuation period, asserts should not be counted twice. For example if the building has been factored out as a tangible and intangible asset, then rent for the premises must be subtracted from the business earnings. Similarly inventory impacts the business value. Typically inventory is valued at cost and treated as a tangible asset.
Earnings Multiples
After the value of tangible and intangible assets is determined we need to determine the value of the business using the correct multiples. Multiples used are very specific to a business and location of the business but broadly speaking it can be between 2 to 5 times normalized EBIT (Earnings before Interest and Taxes). The business can be worth more if it is has distinctive attributes that make it very attractive. To the buyer, 2 to 5 times earnings represent getting back their investment in the business in 2 to 5 years from profits a projected annual return of 20% to 50%.
Eventually the right multiple is the amount the buyer is willing to pay for the business. A business can demand higher multiples by clearly defining a case to increase earnings over time.
Disadvantages and caveats
Based on the content covered earlier, you may wonder how one can be certain the business valuation is perfect for the business buyer and seller. In reality there is no perfect price and techniques described in the earlier sections are just guidelines to derive an acceptable price.
The multiplier approach discussed does not provide sufficient information to assess the uniqueness of the business, such as management depth, customer relationships, industry trends, reputation, location, competition, capital structure and other information unique to the business. Further, two businesses of the same type and same revenue can have different cash flows.
The rules for evaluating a business are more of guidance then a hard and fast rule. They should be thought of as a starting point which can be further refined by factors specifically impacting the business. Proper evaluation will go beyond calculations based on multiples and tangible/intangible asset values. It requires complete business, marketing and financial due-diligence. However the approach describes in this article can play a key role in determining a starting value of your business.
Sites such as http://www.buysellbusiness.org allow entrepreneurs to do deals by buying and selling businesses and partnering. When researching businesses for deals, these guidelines can play an important role in quickly calculating the intrinsic value of a business.
http://www.buysellbusiness.org/BusinessTools/BizValuations.aspx
Your special industry number: Every industry has at least one.
Your special industry number
Every industry has at least one. Here are some examples:
Restaurants: covers per night, wastage.
Services: staff utilisation rates.
Hotels: occupancy rates.
Builders: work in progress, progress payments due.
Retail: sales per metre of floor space.
Knowing the benchmark indicators for your industry can help you compare yourself with your peers, measure your business’s success, and identify any problems.
http://www.commbank.com.au/business/betterbusiness/growing-a-business/five-numbers/default.aspx
****A P/E ratio is a much better indicator of a stock's value than its market price alone.
Everything You Must Know About The P/E Ratio
And as a bonus, the PEG ration as well.
By Mark Vergenes
--------------------------------------------------------------------------------
Question: What is a P/E and PEG Ratio?
The usefulness of the price-to-earnings (P/E) and price-to-earnings growth (PEG) ratios depends on how they are calculated, what kind of market you're in, and how well you grasp their limitations. This overview can help you understand the mechanics underlying these common valuation measures and better finesse stock and market evaluations.
It's so simple, it often seems sublime. The term "P/E" or "price/earnings ratio" gets bandied about so freely, it's easy to assume that everyone knows what it is and how it's used. The ratio is one of the oldest and most frequently used metrics for valuing stocks. Though simple to construct, a P/E ratio is actually difficult to interpret. It can be extremely informative in some situations, yet virtually meaningless in other contexts.
P/E ratio explained
As the name implies, the ratio expresses the relationship of a company's per-share earnings to its stock price. To calculate the P/E, simply divide a stock's current market price (CMP) by its issuer's earnings per share (EPS):
P/E = CMP ÷ EPS
Typically, P/E ratios are historic in nature. These "trailing" P/Es are calculated using EPS from the preceding four quarters. A "leading" or "projected" P/E, alternatively, is derived from earnings expected over the coming four quarters. This P/E, of course, is an estimate. Hybrid P/Es can also be created using the EPS of the past two quarters and estimates for the next two quarters. The P/E ratio is also often called the "multiple" because it shows how much investors are willing to pay for each $1 of a company's earnings. Not all companies, of course, produce profits. And it's these operations that create problems for analysts cranking out P/Es. When the divisor is negative (losses, after all, are manifested as negative EPS), some analysts report a negative P/E, while others bestow a P/E of zero on the company. Most analysts, however, just say the P/E doesn't exist.
The market P/E--at least, the market represented by the S&P 500 Index--has historically ranged between 15 and 25. A market P/E of over 18 is usually considered expensive, while a market P/E under 10 is considered inexpensive or undervalued. P/Es can also vary widely among different market segments. The P/E for the technology sector as of March 2005, for example, is around 28, while the overall multiple for financial companies is not quite 16.
Interpreting a P/E ratio
On the surface, a stock's P/E indicates the price the public is willing to pay for a company's earnings. A P/E ratio of 25, for example, suggests that investors are ready to fork over $25 for every $1 of company profits. Since a stock's price not only reflects a firm's worth now but also what investors think it will be worth in the future, this simplistic interpretation of P/E ignores growth prospects. Using forward EPS projections compensates in some measure for this.
P/Es are one of the metrics used to classify stocks as "growth" or "value" plays. As a rule of thumb, most stocks trade with P/Es 50 percent higher than their forecasted annual earnings growth. For example, a P/E of 30 would be considered reasonable for a company expected to grow earnings around 20 percent annually. That company's stock might be classified as a "growth" issue (ignoring all other factors) if it were priced above a 30 P/E, while a ratio under 30 might tip it into the "value" category.
A high P/E--that is, one above a company's "reasonable" earnings multiple or higher than the market or industry average--typically indicates very optimistic earnings prospects. A company brandishing a high P/E ratio eventually has to live up to these expectations, of course, or see its stock price drop as a consequence. A stock with a high P/E can still be a good buy for the long term, but further research may be needed to justify the price. Extreme ratios--multiples in the thousands, for instance--are typical of startups with little or no revenues.
What is "cheap"?
A P/E ratio is a much better indicator of a stock's value than its market price alone. All things being equal, a $10 stock with a P/E of 50 is much more "expensive" than a $100 stock with a P/E of 20. There are limits to this form of analysis, of course. A particular P/E can only be considered high or low by taking into account other factors, namely:
• Growth rates. How fast has the company been growing in the past, and is that rate expected to increase or at least continue into the future? A stratospheric P/E sported by a company that's growing earnings at a measly 5 percent annual clip might very well be overpriced.
• Industry. Apples, of course, should only be compared to other apples. Financial companies like banks typically have low multiples, while technology stocks' P/Es tend to be high. Using P/E to compare a tech company to a bank offers little actionable information. It's better to compare companies to others in the same industry or to the industry average.
Problems with P/E
While P/E ratios can point out overvalued or undervalued companies, P/E analysis is valid only in certain circumstances. For one thing, accounting rules change over time and vary from one country to the next, complicating cross-border analysis or historic comparisons. The inclusion of non-cash items, such as depreciation, into earnings further clouds the picture. Worse still, EPS can be presented in a variety of ways depending on how a company or an analyst chooses to do the math. EPS can be based upon either outstanding or fully diluted shares, for example. "Pro forma" EPS presentations can be especially vexing in comparisons, making it difficult to discern if apples are actually put up against apples.
Most importantly, P/E ratios are strongly influenced by inflation. P/Es, as a rule, head south during times of high inflation because of the resulting understatement of inventory and depreciation costs. The flip-side of this coin is that P/E ratios often seem lofty in periods of low inflation. When inflation moderates, central bank rate hikes become less likely, creating expansive expectations for earnings. Additionally, earnings quality rises, meaning that companies' improved financial results are more likely to be attributed to actual growth rather than the inflation of asset prices.
Trading on P/E information
Keeping the foregoing in mind, traders tread the P/E waters carefully. A low P/E ratio doesn't automatically mean that a company is undervalued--it could actually spell trouble for the company in the near future. A company that has warned of lower-than-expected earnings, for example, might look undervalued if a trailing P/E is used as the basis for analysis. Conversely, a high P/E ratio might mean that a stock is overvalued, but that's hardly a guarantee that its price will fall anytime soon. A P/E ratio is only one part of the jigsaw puzzle that is security analysis.
Factoring in growth
While P/Es can be useful in comparing one company to another in the same industry, to the market in general, or to a company's own historical ratios, their utility is still limited. Some analysts complain that P/Es, even when based upon projected EPS, don't accurately measure a company's performance in relation to its growth potential. Factors affecting a company's growth rate--the value of its brand value, its human capital, and the like--aren't reflected in a P/E alone, they say.
Enter the "PEG" or "price/earnings growth ratio" which expresses the relationship between a company's price/earnings ratio and its earnings growth. PEGs, say some pundits, help investors see whether a company is reasonably priced given future expectations. PEGs, too, permit direct comparison of companies across industries.
A PEG is formulated as:
PEG = P/E ratio ÷ annual EPS growth
As with P/Es, the number used for the annual growth rate can vary; rates can be trailing or forward looking and cover a one- to five-year time span. Most analysts argue that longer periods make for better analyses, since their use is less likely to produce outcomes skewed by short-term anomalies.
Simplistically, a PEG ratio equal to one means that the market is pricing the stock to fully reflect the stock's EPS growth. A PEG greater than one indicates a stock that is either overvalued or one that the market expects to outdo analysts' future EPS growth estimates. Growth stocks typically have PEG ratios greater than one, reflecting investors' willingness to pay more for growth at any price. Keep in mind, though, that a high PEG could also stem from recently lowered earnings forecasts.
Undervalued stocks can be signaled by a PEG ratio below one. Alternatively, the market may not expect the company to achieve the earnings growth reflected in Wall Street estimates. Value stocks reside in this territory, but a low PEG could also indicate that earnings expectations have fallen ahead of analysts' new forecasts.
PEGs, unlike P/Es, can be used to compare stocks across industries. Consider two candidates for inclusion in a portfolio. The first, a technology company growing its earnings at a 40 percent annual clip and bearing a P/E ratio of 90; and the second, a financial firm with net income growth at 25 percent, but with a P/E ratio of only 15.
Does the higher growth rate of the technology company justify its price? Or is the financial firm a better value play?
Technology Company
Financial Company
P/E Ratio
90
15
EPS Growth (%)
40
25
PEG Ratio
2.25
0.60
The financial company has a PEG ratio of 0.60 (15 ÷ 25), relatively low for its growth rate. The technology company, with its PEG ratio of 2.25 (90 ÷ 40), is quite pricey. Compared to its industry PEG, this stock may, in fact, be overpriced. Even though the technology company seemingly has higher growth prospects, this alone may not be worth the money that investors are forking out to own the stock. Because the purchase price is so high, an investor might not get a very good return on the stock if it does grow.
Conclusion
P/Es and PEGs can be useful tools for the evaluation of portfolio prospects, but they shouldn't be used in isolation. Like all financial ratios, investors need additional information to get a clear perspective on a company. To accurately determine if a company's stock is overvalued or undervalued, the company's P/E and PEG ratios should be regarded in relation to its peer group and the overall market.
--------------------------------------------------------------------------------
Mark A. Vergenes, CSA (mavergenes@ehd-ins.com) with EHD Advisory Services.
http://www.business2businessonline.com/pastissues/2005/june05/vergenes_june05.htm
Valuation: What's it worth?
What's it worth?
Although there are several formulas you can use, there are no black-and-white answers on valuation techniques.
It’s important to conduct your own research, then get independent advice from a business valuer or broker. Here are four of the most commonly used valuation methods.
Method 1: Asset valuation
Method 2: Capitalised future earnings
Method 3: Earnings multiple
Method 4: Comparable sales
Method 1: Asset valuation
This approach determines the value of a business by adding up the value of its assets and subtracting liabilities. It tells you what the business would be worth if it were closed down today and its assets sold off, but it doesn’t take into account the ability of those assets to generate revenue in the future. For that reason, it may understate the true value of the business.
How it works
1.Add up the value of all the assets such as cash, stock, plant and equipment and receivables.
2.Add up liabilities, such as any bank debts and payments due.
3.Subtract the business’ liabilities from its assets to get the net asset value.
Example
Richard wants to buy a manufacturing business. Here’s an extract from the business’ balance sheet.

With assets of $300,000 and liabilities of $200,000, the net asset value of the business is $100,000.
What about goodwill?
This method doesn’t include a value for goodwill or the right to earn future profits, so it may understate the true value of a business. Goodwill is the difference between the true value of a business and the value of its net assets. It can be crucial to the value of retail and service-based businesses.
For example, when you are valuing a business such as a hairdressing salon, where the standard of service, location and reputation are important, the value of any goodwill would have to be added to net assets to get a valuation.
You need to consider whether goodwill can be transferred when you buy the business. While goodwill can come from physical features such as location, it can also arise from personal factors, such as the owner’s reputation or their relationships with customers or suppliers, which may not be transferable.
And if the business is underperforming and there is no goodwill attached to it, then using the net assets valuation method could be an accurate way of determining its value.
Method 2: Capitalised future earnings
When you buy a business, you’re not only buying its assets. You’re also buying the right to all of the profits that business might generate. Different valuation methods try to capture that.
Capitalising future earnings is the most common method used to value small businesses. The method looks at the rate of return on investment (ROI) that you can expect to get from the business.
How it works
1.Work out the average net profit of the business over the last three years using its profit-and-loss statements. You’ll need to adjust the profit for any one-off expenses or other irregular items each year.
2.Decide the annual rate of return that you’re looking for as a business owner (for example, 20%). There are no hard and fast rules about what number you should choose, except that the higher the risk, the higher your return should be. A good starting point is to compare the business with other investment opportunities — everything from safe havens like term deposits, to riskier investments like shares. You can also look at the rate of return that similar businesses in the same industry achieve.
3.Divide net profits by the rate of return to determine the value of the business, then multiply by 100.
Example
David is looking at buying a bakery business with average net profits of $100,000 per annum after adjustments. David wants an annual rate of return of 20%. The capitalised earnings valuation is:

Method 3: Earnings multiple
If you invest in shares, you might already be familiar with this method, since it’s often used to assess the value of companies whose shares are traded on a stock exchange and therefore reflect market expectations. But it can be used to value unlisted businesses.
Its big advantage is its simplicity. The difficulty lies in deciding which multiple to use.
How it works
Simply multiply the business’ earnings before interest and tax (EBIT) by your selected multiple. For example, you might value the business at twice its annual earnings — so a business with an EBIT of $200,000 might be valued at $400,000.
The multiple you choose will depend on the industry and the growth potential of the business. A service-based business might be valued at as little as one year’s earnings, while an established business with sustainable profits might sell for as much as six times earnings. (Listed companies trade at much higher multiples, because their size and liquidity makes them less risky investments.)
This method can be useful for valuing a business where there are regular sales of similar businesses to help you determine an objective earnings multiple. A business broker should be able to tell you this.
Method 4: Comparable sales
Whatever other valuation method you use, you should also look at prices for recent sales of similar businesses. Like buying a house, it makes sense to know what is happening in the market in which you’re interested.
Speak to a few business brokers and gauge their feeling about the business’ value. They might know what similar operations are selling for and how the market is placed at that particular time. Check business-for-sale listings in relevant industry magazines, newspapers or websites.
Tools and templates
Buying a business checklist
Important information
As this advice has been prepared without considering your objectives, financial situation or needs, you should, before acting on the advice, consider its appropriateness to your circumstances. All products mentioned on this web page are issued by the Commonwealth Bank of Australia; view our Financial Services Guide (PDF 59kb).
http://www.commbank.com.au/business/betterbusiness/buying-a-business/whats-it-worth/
Although there are several formulas you can use, there are no black-and-white answers on valuation techniques.
It’s important to conduct your own research, then get independent advice from a business valuer or broker. Here are four of the most commonly used valuation methods.
Method 1: Asset valuation
Method 2: Capitalised future earnings
Method 3: Earnings multiple
Method 4: Comparable sales
Method 1: Asset valuation
This approach determines the value of a business by adding up the value of its assets and subtracting liabilities. It tells you what the business would be worth if it were closed down today and its assets sold off, but it doesn’t take into account the ability of those assets to generate revenue in the future. For that reason, it may understate the true value of the business.
How it works
1.Add up the value of all the assets such as cash, stock, plant and equipment and receivables.
2.Add up liabilities, such as any bank debts and payments due.
3.Subtract the business’ liabilities from its assets to get the net asset value.
Example
Richard wants to buy a manufacturing business. Here’s an extract from the business’ balance sheet.
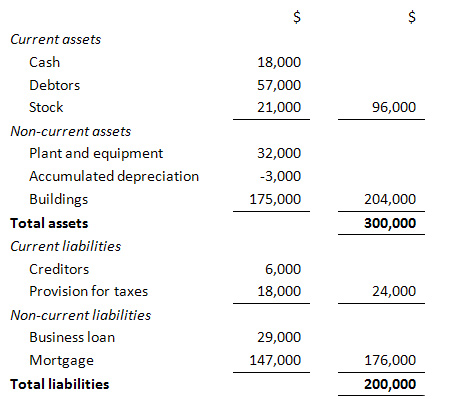
With assets of $300,000 and liabilities of $200,000, the net asset value of the business is $100,000.
What about goodwill?
This method doesn’t include a value for goodwill or the right to earn future profits, so it may understate the true value of a business. Goodwill is the difference between the true value of a business and the value of its net assets. It can be crucial to the value of retail and service-based businesses.
For example, when you are valuing a business such as a hairdressing salon, where the standard of service, location and reputation are important, the value of any goodwill would have to be added to net assets to get a valuation.
You need to consider whether goodwill can be transferred when you buy the business. While goodwill can come from physical features such as location, it can also arise from personal factors, such as the owner’s reputation or their relationships with customers or suppliers, which may not be transferable.
And if the business is underperforming and there is no goodwill attached to it, then using the net assets valuation method could be an accurate way of determining its value.
Method 2: Capitalised future earnings
When you buy a business, you’re not only buying its assets. You’re also buying the right to all of the profits that business might generate. Different valuation methods try to capture that.
Capitalising future earnings is the most common method used to value small businesses. The method looks at the rate of return on investment (ROI) that you can expect to get from the business.
How it works
1.Work out the average net profit of the business over the last three years using its profit-and-loss statements. You’ll need to adjust the profit for any one-off expenses or other irregular items each year.
2.Decide the annual rate of return that you’re looking for as a business owner (for example, 20%). There are no hard and fast rules about what number you should choose, except that the higher the risk, the higher your return should be. A good starting point is to compare the business with other investment opportunities — everything from safe havens like term deposits, to riskier investments like shares. You can also look at the rate of return that similar businesses in the same industry achieve.
3.Divide net profits by the rate of return to determine the value of the business, then multiply by 100.
Example
David is looking at buying a bakery business with average net profits of $100,000 per annum after adjustments. David wants an annual rate of return of 20%. The capitalised earnings valuation is:
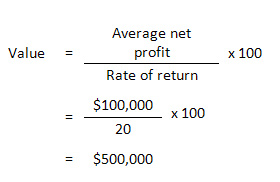
Method 3: Earnings multiple
If you invest in shares, you might already be familiar with this method, since it’s often used to assess the value of companies whose shares are traded on a stock exchange and therefore reflect market expectations. But it can be used to value unlisted businesses.
Its big advantage is its simplicity. The difficulty lies in deciding which multiple to use.
How it works
Simply multiply the business’ earnings before interest and tax (EBIT) by your selected multiple. For example, you might value the business at twice its annual earnings — so a business with an EBIT of $200,000 might be valued at $400,000.
The multiple you choose will depend on the industry and the growth potential of the business. A service-based business might be valued at as little as one year’s earnings, while an established business with sustainable profits might sell for as much as six times earnings. (Listed companies trade at much higher multiples, because their size and liquidity makes them less risky investments.)
This method can be useful for valuing a business where there are regular sales of similar businesses to help you determine an objective earnings multiple. A business broker should be able to tell you this.
Method 4: Comparable sales
Whatever other valuation method you use, you should also look at prices for recent sales of similar businesses. Like buying a house, it makes sense to know what is happening in the market in which you’re interested.
Speak to a few business brokers and gauge their feeling about the business’ value. They might know what similar operations are selling for and how the market is placed at that particular time. Check business-for-sale listings in relevant industry magazines, newspapers or websites.
Tools and templates
Buying a business checklist
Important information
As this advice has been prepared without considering your objectives, financial situation or needs, you should, before acting on the advice, consider its appropriateness to your circumstances. All products mentioned on this web page are issued by the Commonwealth Bank of Australia; view our Financial Services Guide (PDF 59kb).
http://www.commbank.com.au/business/betterbusiness/buying-a-business/whats-it-worth/
Summary:
Low Multiples
Another interesting way to assess PE of individual stocks, relative to their respective industry and country multiples
Low Multiples
04.08.09, 06:00 PM EDT
Forbes Magazine dated April 27, 2009
These stocks have estimated 2009 price-to-earnings multiples below their respective industry and country multiples. One example: Bombardier of Canada, which makes jets and railroad locomotives and coaches, trades at an estimated 2009 P/E of 6, versus 15 for all aerospace stocks and 13 for Canadian stocks.
http://www.forbes.com/forbes/2009/0427/152-global-2000-companies-cheap-and-cash-rich.html
The world's richest men say go buy stocks, global economic panic is over
Updated: Friday November 13, 2009 MYT 7:48:41 AM
The world's richest men say go buy stocks, global economic panic is over
Buy attractive stocks, they say
NEW YORK: Capitalism is still alive and well, say the world's two richest men, despite lingering shocks from the longest, deepest recession since the Great Depression.
"The financial panic is behind us," said famed investor Warren Buffett, who recently made what he called an "all-in wager" on the U.S. economy by acquiring railroad Burlington Northern Santa Fe.
"The bottom has come in stocks. Don't pass on something that's attractive today."
Sitting facing each other in an auditorium filled with nearly 1,000 cheering people at Columbia University in New York, the CEO of Berkshire Hathaway Inc. and Microsoft founder Bill Gates fielded questions from Columbia Business School students on the recession, investing and what's the next Microsoft.
There were at first reassurances that the U.S. economy had not collapsed since the last time the two sat in front of a student audience, in Nebraska in 2005.
"We proved that we can make mistakes," said Gates.
"But the fundamentals of the system, a marketplace-driven system where we invest in education and a great infrastructure for the long-term, that's continued."
Even in the country's "darkest hour," he said, American businesses were still innovating.
"Last fall was really blindsiding," Buffett said later.
Still, "I did not worry about the overall survival of our economy."
The worst recession since the 1930s may be over, but the recovery isn't expected to be strong enough to stem job losses and get businesses hiring again.
Employers shed a net total of 190,000 jobs in October, a government survey showed Thursday.
It was the 22nd straight month of losses.
And the unemployment rate jumped last month to 10.2 percent, a 26-year high.
Buffett also commended the Bush administration's actions last September, saying "only the government could have saved things" after the collapse of Lehman Brothers triggered a freeze-up in credit markets and panic on Wall Street.
In the future, however, Buffett said "there should be more downside to the head of any institution that has to go to the federal government to be saved for reasons of the greater society. And so far, we have been better at carrots and sticks in rewarding CEOs at the top. But I think some more sticks are called for."
The two endeared themselves to the audience with tips.
Buffett exhorted students to "marry the right person" and said, "The worst investment you can have is cash."
Gates, meanwhile, said he sees big opportunities in environmentally friendly energy and medicine.
"Capitalism is great," he said.
Gates wore a suit and tie, flashing the inner red lining of his jacket as he walked to his chair. Buffett, who earned a master's degree from Columbia in 1951, wore a sweater with the Columbia insignia.
Students in the audience said they were glad the two were so confident about the economy.
"That probably weighs a lot to a lot of people to hear Buffett say we're out of the crisis," said Andrea Basche, an Earth Institute student at Columbia. - AP
PLANTATION sector

Pile in as stocks pile up
Tags: Astra Agro | Brokers Call | CIMB Research | CPO | Golden Agri | Indofood Agri | Plantation | Sampoerna Agro | Sime Darby | Wilmar
Written by Financial Daily
Thursday, 12 November 2009 10:46
PLANTATION []s sector
Neutral: Malaysia’s palm oil stock figures for end-October 2009 were above both our and market estimates, which is slightly negative for the sector. However, we are keeping our 2009 crude palm oil (CPO) price forecast of RM2,240 per tonne, which is only a tad higher than the RM2,221 average achieved in 9M09. If this news of a rising stockpile triggers a correction of CPO price and planters’ share prices, investors should snap up the opportunity to accumulate selected plantation stocks ahead of a likely recovery of CPO price, potentially in 1Q10.
We remain neutral on the Malaysian plantation sector and continue to prefer the Singapore planters for their more appealing valuations. Our picks in the region remain Wilmar, Sime Darby, Indofood Agri, Golden Agri, Astra Agro and Sampoerna Agro.
Higher imports and output pushed Malaysia’s palm oil stocks to a 10-month high of 1.97 million tonnes at end-Oct, above market expectations of 1.82 million tonnes and our forecast of 1.72 million tonnes. The discrepancy came largely from a 27.5% month-on-month (m-o-m) uptick in production. We believe the key variances were higher production and imports. These statistics are negative as the rise in inventories will limit CPO price upside in the medium term.
Palm oil stocks are projected to rise further and potentially peak in November. We now estimate that Malaysia’s CPO stock level could increase 3% m-o-m to around 2.03 million tonnes in November, which we think could be the peak instead of our initial expectation of a peak of 1.9 million tonnes. This stems from the unexpected surge in production in October which may not be sustainable as we suspect some harvesting was carried over from the previous month.
Assuming steady crude oil prices, we continue to expect CPO prices to trade within a range of RM2,100 to RM2,300 per tonne in the short term. Despite the higher-than-expected palm oil stockpile, we are sticking to our view that CPO price could rally in 1Q 2010 as demand is expected to pick up, driven by the Chinese New Year festivities, the global economic recovery, lower domestic oilseed crops for India and higher biofuel mandates.
Although stocks appear to be closing in on last year’s record level, the outlook for demand is brighter than a year ago as global economies are on the mend and some governments have set or increased their biodiesel mandates. Also, the higher crude oil price of US$79 (RM267.02) per barrel compared to the year-ago level of US$60 may boost conversion to biodiesel. — CIMB Research, Nov 11
This article appeared in The Edge Financial Daily, November 12, 2009.
http://www.theedgemalaysia.com/business-news/153471-pile-in-as-stocks-pile-up.html

Adventa surges on CIMB upgrade
Adventa surges on CIMB upgrade
Tags: Adventa | CIMB | Top Glove | Upgrade
Written by Joseph Chin
Thursday, 12 November 2009 10:38
KUALA LUMPUR: Shares of Adventa surged in early trade on Thursday, Nov 12 after CIMB Equities Research initiated coverage on the glove maker with an Outperform and a target price of RM4.12.
At 10.25am, it was up 17 sen to RM2.12 with 1.58 million shares done.
The research house said the prognosis for the medical glove industry is favourable given rising healthcare needs and greater awareness of the need for hygiene, especially with the rising incidence of health scares.
"Adventa is in a great position to tap into this growth as well as the growth arising from ageing populations around the world and more demand for elective surgery," it said.
CIMB Research said due to the company's smaller size relative to its biggest rival Top Glove, it pegged it to a 30% discount to its target market price-to-earnings of 15 times.
"This gives us an end-CY10 target price of RM4.12, which implies share price upside of 111%. We begin our coverage with an OUTPERFORM recommendation, premised on the potential share price trigger of improving quarterly earnings driven by its surgical glove and OBM segment as well as its ongoing expansion," it said.
http://www.theedgemalaysia.com/business-news/153469-adventa-surges-on-cimb-upgrade.html
Comment: What gives? Perception.
Hong Leong Bank posts 1Q net profit of RM234.2 million
Hong Leong Bank posts 1Q net profit of RM234.2 million
Tags: Hong Leong Bank
Written by Joseph Chin
Wednesday, 11 November 2009 21:13
KUALA LUMPUR: HONG LEONG BANK BHD [] posted a net profit of RM234.21 million for its first quarter ended Sept 30, a slight decline of 3.2% from RM242.04 million a year ago.
Announcing its earnings on Wednesday, Nov 11, it said revenue was 7% lower at RM511.67 million from RM550.13 million. Earnings per share were 16.2 sen versus 16.7 sen.
Bank of Chengdu Co Ltd, in which Hong Leong owns a 20% stake, contributed RM31 million to the 1Q profit.
The performance showed an improvement from the fourth quarter ended 30 June,2009, with net profit up 18% to RM234 million.
Hong Leong Bank said returns on average shareholder funds remained resilient at 15.9% on an annualised basis.
"Total net income increased 3.7% q-o-q to RM512 million. Net interest income increased 9.8% q-o-qr to RM335 million. Non-interest income increased by 0.05% q-o-q to RM129 million. Cost-to-income ratio was 41.1% for 1QFY10 . Total assets were RM77 billion. Gross loans grew by 0.4% y-o-y to RM36 billion," it added.
http://www.theedgemalaysia.com/business-news/153455-hong-leong-bank-posts-1q-net-profit-of-rm2342-million.html
Warren Buffett: Financial panic is over
Warren Buffett: Financial panic is over
Written by Reuters
Friday, 13 November 2009 07:55
NEW YORK: Warren Buffett, perhaps the world's most admired investor, said on Thursday, Nov 12 the financial panic that gripped the globe last year is a thing of the past, even as the U.S. economy's struggles persist, according to Reuters.
"The financial panic is behind us," the world's second-richest person said at Columbia University's business school. "Our economy was sputtering, still is sputtering some."
Buffett, 79, nevertheless said there is greater opportunity for investments inside the United States than outside, noting that the U.S. economy is far larger than any other.
He appeared at Columbia with Microsoft Corp (MSFT.O) founder Bill Gates, the world's richest person and a Buffett friend and bridge partner.
Last month, preliminary government data showed the U.S. economy expanded in the third quarter, the first three-month period of growth since the second quarter of 2008.
Nonetheless, the U.S. unemployment rate last month reached 10.2 percent, the first double-digit reading in 26 years.
Buffett last week made a big bet on the U.S. economy when his Berkshire Hathaway Inc (BRKa.N) (BRKb.N) agreed to pay about $26.4 billion for the 77 percent of railroad company Burlington Northern Santa Fe Corp (BNI.N) that it did not already own.
"There will be more people in this country, 10, 20, 30 years from now," Buffett said. "They'll be moving more and more goods back and forth to each other and the most environmentally friendly and cost-efficient way of doing that is railroads."
Buffett said rail transport uses one-third less fuel and pollutes the air less than trucks, and that one train can supplant about 280 trucks.
Gates, who is also a Berkshire director, said other sectors might also boost the economy over the long term, including information TECHNOLOGY [], energy and medicine.
Separately, Buffett advised the U.S. government not to coddle companies that need bailouts to survive or preserve capital.
"More sticks are called for," he said.
Buffett gave Federal Reserve Chairman Ben Bernanke and U.S. Treasury Secretary Timothy Geithner "high marks" for how they managed the financial crisis.
The billionaire has praised Bernanke in the past, while mocking Geithner's stress tests for banks.
CNBC television was a host for the Columbia event. - Reuters
High-income goal needs ‘reality check’
High-income goal needs ‘reality check’
Tags: 10MP | Developed high-income nation | GDP growth | High income goals | Kenanga Research | Per capita income | reality check | Wan Suhaimie Wan Mohd Saidie | World Bank
Written by Financial Daily
Thursday, 12 November 2009 11:00
KUALA LUMPUR: The country’s high-income goals needs a reality check and it would be a very challenging task to become a developed, high-income nation by 2020, said Kenanga Research.
“It’s a deceiving notion to believe that in order for Malaysia to achieve a developed nation status, its GDP needs to grow by only an average of 6% till 2020.
“For one, our average GDP growth needs to consistently expand by at least 8% annually to meet the current World Bank’s minimum classification to achieve a high-income nation [per capita income of US$17,000 or RM57,460],” the research house said in a report yesterday.
This was assuming that Malaysia’s population would grow at an average of 2.1% annually and the ringgit appreciated at a steady rate of 5% per annum against the US dollar, the research house said.
It added that this was a simplistic assumption, which does not take into account the rapid changes in global trade and TECHNOLOGY [] as well as the gradual socio-politico shift domestically and abroad.
“Plus, the World Bank’s minimum requirement may be adjusted even higher over time, not to mention the possibility of a devaluing US currency,” it said.
Economists said the success of the private-sector-led growth under the 10th Malaysia Plan (10MP) would be viewed in totality against the backdrop of a challenging global economic backdrop.
They said existing weaknesses in the US economy, the world’s largest, would still be a key factor in dictating Malaysia’s economic fortunes going forward. This is despite the rise of China as a major source of demand for local exports.
“Though China’s economic influence is catching up and growing steadily, it may not be sufficient to offset any demand shortfall in the advanced economies. At this juncture, a more realistic long-term growth trend for Malaysia would be between 4% and 5%,” economist Wan Suhaimie Wan Mohd Saidie wrote in the Kenanga report.
He said unless Malaysia took a more aggressive stance to stem human-capital loss and sluggish private-sector investments, it would be difficult for the country to rise above its minimum growth potential of 6%. “It’s going to be tough,” he said.
The 10MP is deemed crucial because the five-year plan from 2011 till 2015, is the second last blueprint before the 11MP from 2016 to 2020, in facilitating the nation’s goal of achieving developed-nation status by 2020.
Hence, policymakers have decided to table the 10MP earlier in June 2010, six months ahead of the initial year for the national initiative. Previous plans were usually tabled during the first year of their implementation.
A key theme is competitive private-sector-led growth to spur the country’s economic fortunes while the government functions as an effective facilitator.
As such, private-investment growth is expected to increase by 10.5% a year, surpassing public investment expansion of 0.7% during the five-year plan, translating into an annual real gross domestic product (GDP) growth of 5.5% during the 10MP compared with the projected 3.2% growth under the 9MP.
Policymakers have identified the services, manufacturing, and agriculture sectors as main growth drivers under the 10MP.
In a note yesterday, CIMB Investment Bank Bhd head of economics Lee Heng Guie said, while global dynamics were not within the country’s control, policymakers had to ensure that domestic resources were optimally utilised via the better management of government funds.
“The execution risk and leakage have to be brought down to the lowest possible point to ensure the resources are optimally allocated.
“Fiscal resources should be deployed for socio-economic development, education, human-capital formation as well as to promote a sustainable eco-friendly environment,” Lee said.
Meanwhile, Kenanga Research also said it would not be a surprise if the goods and services tax (GST) were to be announced as part of the 10MP.
It said the gradual reduction and realignment of both personal income tax and corporate tax rates was a step closer towards converting Malaysia’s current tax regime to the GST system, which had been postponed indefinitely since it was first announced in the 2005 budget.
Kenanga Research said the broader tax base was expected to be able to increase the government’s coffers and would likely more than compensate the shortfall in corporate and individual tax collections.
“Singapore and Australia are role models of successful GST regimes and they are less prone to declining income during an economic downturn,” it said.
This article appeared in The Edge Financial Daily, Nov 12, 2009.
Glove makers take the lead
Glove makers take the lead
Tags: Adventa | Kossan | Supermax
Written by Joseph Chin
Thursday, 12 November 2009 16:31
KUALA LUMPUR: Glove manufacturers again saw renewed interest in late afternoon trade on Thursday, Nov 12, supported by analysts' positive outlook for the sector.
Adventa was up 29 sen to RM2.24 with 5.52 million shares done at 4.19pm after CIMB Equities Research initiated coverage on the glove maker with an "outperform" rating and a target price of RM4.12.
Supermax added 19 sen to RM3.83 with 6.54 million shares done while Kossan was up 15 sen to RM5.27.
http://www.theedgemalaysia.com/business-news/153518-glove-makers-take-the-lead.html
F&N to pass on higher cost if sugar prices go up
F&N to pass on higher cost if sugar prices go up
By Jeeva ArulampalamPublished: 2009/11/11
FRASER & Neave Holdings Bhd (F&N) (3689) will increase the prices of its food and beverage (F&B) products should the government decide to remove the sugar subsidy locally.
F&N chief executive officer Tan Ang Meng said that the cost of higher sugar prices will have to be passed on to consumers as F&B producers will not be able to absorb the cost impact.
"Whatever you eat or drink, like the prices of roti canai or teh tarik, will go up," Tan said at F&N's financial year 2008/09 results briefing in KL yesterday.
Although the quantum of the price increase for F&N products will depend on the hike in sugar prices, it will take less than a month for the cost to be factored into the F&B products.
"So the government has to balance between how much (sugar subsidy) they plan to withdraw and its subsequent impact on inflation," said Tan.
The government is said to be spending some RM720 million on sugar subsidy this year.
For its financial year ended September 30 2009, F&N saw its net profit increase 35 per cent to RM224.4 million while revenue grew 2 per cent to RM3.74 billion.
Despite the deep regional economic recession, the group posted higher revenue driven by strong volume growths for its soft drinks, mainly the 100Plus and Seasons brands.
Tan said that the dairies division operating profit improved by 59 per cent over the last year to RM140 million and is now on par with the soft drinks as a key contributor to the group's profits.
The group is planning a bonus dividend of 5 sen per share on top of a final dividend of 24 sen. This will make its total net dividend for the year at 41.75 sen.
Meanwhile, F&N will look to launch 50 new products, including tea, coffee and energy drinks, within the next two to three years, once its "exclusivity clause" with Coca-Cola expires on January 26 2010.
The new products will help cushion the loss of revenue once F&N stops selling Coca-Cola from September 2011, which accounted for 33 per cent of F&N's total soft drinks volume for the financial year just ended.
http://www.btimes.com.my/Current_News/BTIMES/articles/jfn10/Article/
Wilmar delays China IPO, to invest in Africa
Wilmar delays China IPO, to invest in Africa
Published: 2009/11/13
SINGAPORE: Wilmar International, the world's largest listed palm oil firm, signalled a promising outlook for its earnings but said the US$3.5 billion (US$1 = RM3.38) listing of its China unit is on hold due to its concern over valuations.
The palm oil giant's listing plan was the recent trigger for a rally in its shares, which retreated yesterday despite a quarterly profit that beat expectations.
"We will shelve it for the time being and wait for market conditions to improve," Wilmar's chairman and CEO Kuok Khoon Hong said after a media and analysts' briefing for its third-quarter results.
"We only will list the China operation if it commands better price than what Wilmar is commanding right now in the stock market," he added.
Analysts have estimated that Wilmar's China unit could be valued as by much as 20 times earnings, matching the parent company's current price-to-earnings multiple.
With more than 30 firms eyeing listings in either Hong Kong or India over the next few months, leading to more than US$10 billion in share sales, companies wanting to list have had to keep their hopes for high prices in check.
Analysts have said Wilmar, which has a market value of US$30 billion, has no immediate need for funds.
The company said it was optimistic about prospects for the rest of this year after a one-off gain helped it post a better-than-expected 35 per cent rise in its third quarter profit.
Analysts were less impressed. "Excluding exceptional and one-off items, Wilmar's operating performance in its third quarter 2009 was not as strong as we would expect from normal seasonality," Goldman Sachs analyst Patrick Tiah said in a research note.
"Notwithstanding, given the market's low expectations we believe consensus earnings could rise following the results," he added.
Wilmar's Kuok said the company plans to invest at least US$1 billion in China, Indonesia and Africa to expand its plantations and plants.
The company has raised profits in the last few quarters thanks to its processing and refining capabilities, outperforming rival palm oil firms that depend primarily on plantations.
Wilmar's shares have more than doubled this year, but some analysts cut their ratings after the company delayed plans in late September to float its China unit due to volatile markets.
The listing would have raised around US$3.5 billion.
CEO Kuok said earlier in a statement that he was optimistic about the firm's prospects for the rest of the financial year given the diversity of its business segments.
Wilmar, derives about half of its total sales from China, and owns oil palm plantations and runs crushing and refining plants in Indonesia and Malaysia.
The company, the second-largest on the Singapore Exchange after Singapore Telecommunications, earned US$653 million in July-September, up from US $483 million a year ago. - Reuters
Green Packet - behind the headline figures
Green Packet sets ambitious profit target
By Goh Thean EuPublished: 2009/09/24
GREEN Packet Bhd (0082), a telecommunications and broadband service provider, has set a net profit target of RM1 billion for 2013, driven by a maturing broadband and solutions business.
The company posted a net loss of RM54.98 million for the financial year ended December 31 2008.
"It's an ambitious goal. That's why we are really working hard on that. We believe both our business pillars of solutions and service provider will grow. By then, we will have more than one million subscribers on broadband space," group managing director Puan Chan Cheong told Business Times in an interview.
The company expects to sign up 200,000 subscribers by year-end, from 35,000 in the first quarter of 2009.
"By end of the third quarter, we should have more than 100,000 subscribers. We believe that we can sign up over 30,000 subscribers per month for the final quarter," he said.
Green Packet expects revenue to increase more than threefold to RM300 million this year, from RM88.43 million in 2008.
"Our first-half 2009 revenue was already 11 per cent more than what we had in the entire 2008. We expect the momentum growth to be bigger in the second half and we believe we can comfortably achieve RM300 million this year and RM1 billion two years later," he said.
The company offers broadband services to homes and offices using the WiMAX (Worldwide Interoperability for Microwave Access) technology.
To achieve its subscriber target, the company would need to expand its broadband coverage area, so that more people will have the opportunity to subscribe it.
"In terms of sites, we are also on track to hit 700 sites, or 2,100 base stations by year-end," he said.
Over the next two years, the company will be aggressively expanding its coverage and acquiring broadband customers. When its subscriber base hits the critical mass, it is expected to launch its new service - mobile voice.
"We are looking to launch mobile voice service in 2011. We can do it by ourselves, but initially, we will be looking at domestic roaming. On areas we don't have coverage, then we will fall back to existing operator's network," said Puan, who expects to sign up more than two million mobile voice customers by 2013.
It also develops WiMAX customer-premises equipment (CPE), such as the WiMAX modems. For the first half, it has delivered over 150,000 WiMAX CPEs to 35 operators worldwide.
"The estimation for WiMAX product shipment world is going to be about 1.6 million to 1.7 million this year. We aim to capture 20 per cent of the world's market shipment, or to ship some 350,000 units of CPEs this year," he said.
Besides developing CPEs and offering broadband services, it also develops telecommunications software - such as its InTouch connection management software - for operators.
The InTouch connection management solution, allows the user to integrate multiple wireless network.
Developing the solutions pillar is critical for Green Packet's bottomline growth, as it commands higher margins than some of its other businesses and it helps the company to strike a balance.
"Moving forward, we see half of our revenue coming from our service provider (WiMAX broadband) business and the other half from solutions.
"In terms of topline for our solution business, 30 per cent will come from software and 70 per cent will come from CPEs. However, for bottomline, software will contribute 50 per cent of the profit for the solution business," he said
http://www.btimes.com.my/Current_News/BTIMES/articles/gpkt21/Article/index_html
----
Green Packet: RM500m more needed to widen 4G coverage
By Zuraimi AbdullahPublished: 2009/11/13
GREEN Packet Bhd (0082), which announced its third quarter results yesterday, will need up to RM500 million in capital expenditure (capex) in the next 12-18 months to increase its 4G Wimax coverage nationwide to 65 per cent.
This does not include a RM155 million capex it plans to spend first over the next three quarters to raise the high-speed broadband service coverage to 45 per cent.
Green Packet managing director C.C. Puan said it had so far invested RM337 million to roll out the 4G service.
The company's 4G service, known as P1 and run by subsidiary Packet One Networks (Malaysia) Sdn Bhd, now covers 25 per cent of the peninsular.
Puan said about RM400 million of the RM500 million capex would be raised from vendor financing and borrowings.
The remaining RM100 million should come from equity and convertible debts, he told reporters at a briefing on Green Packet's interim results in Petaling Jaya yesterday.
The company has group cash and cash equivalents of RM174 million as of end-September. With another RM65 million from bank and vendor facilities, it has total funding of RM239 million, more than the RM155 million required for the next nine months.
Meanwhile, Green Packet's revenue for the third quarter to September 30 this year rose 11.5 per cent to RM63 million from RM56.5 million in the preceeding quarter.
But it made a net loss of RM32.9 million mainly due to the investments in P1's deployment and activities.
A turnaround is possible starting from the middle of next year as he said P1 should break even in the first quarter on 2010, which could push Green Packet into the black as early as first half of next year.
Green Packet's 4G subscribers have increased to 100,000 in 14 months and the company plans to double it to 200,000 in the next two months.
The company plans to extend its 4G service to Sabah, Sarawak and Singapore and increase exports of its 4G devices by several fold next year, Puan said.
http://www.btimes.com.my/Current_News/BTIMES/articles/ket/Article/index_html
----
Green Packet suffers bigger loss
Published: 2009/11/12
Green Packet Bhd's pre-tax loss for its third quarter ended Sept 30, 2009, rose by 200 per cent to RM32.377 million from RM10.784 million in the same quarter last year.
This was due to its investment in subsidiary Packet One Networks (M) Sdn Bhd (P1)'s deployment plan and activities, Green Packet said in a statement today.
However, its revenue increased by 246.9 per cent during the third quarter to RM63.035 million from RM18.172 previously.
Green Packet said P1's subscriber growth increased by 44 per cent in the third quarter as compared to the second quarter.
"In line with the group's business strategy, we are investing heavily in our 4G WiMAX operator, P1, which is rapidly expanding across Malaysia and gaining momentum in terms of subscribers," said Green Packet's group managing director and chief executive officer Puan Chan Cheong.
Puan said Green Packet's advertising and promotion activities had increased substantially, with the company moving to mainstream broadcast media to introduce its service packages to the masses.
"The quantum of subscriber increase is exciting, and we target for P1 to be EBITDA (earnings before interest, taxes, depreciation, and amortisation) breakeven by first quarter 2010," he said.
P1, now the only nationwide 4G WiMAX operator in the country, plans to extend its network to East Malaysia and Singapore next year.
Green Packet said it has healthy cash reserves, having recently conducted a rights issue and announced a proposed private placement expected to be completed by the end of this financial year.
The proposed private placement is expected to contribute positively to the group's future earnings and should result in an increase in the company's total issued and paid-up share capital.
"Our fund raising is part of our business strategy, which requires working capital for capital expenditure and operating expenses, including the deployment of 4G WiMAX infrastructure in Malaysia and other overseas markets," Puan said.
Green Packet said its products and solutions have increased their shipments in recent months and were profitable since the second quarter.
The group is also expected to announce contracts with East European and American operators, and launch new products before the year-end. -- Bernama
http://www.btimes.com.my/Current_News/BTIMES/articles/20091112211908/Article/index_html
Subscribe to:
Comments (Atom)