Tuesday 23 August 2011

Economic Cycle versus Stock Market Cycle


Sam Stovall's Sector Investing, 1996 states that different sectors are stronger at different points along the business cycle. The table below describes this theoretical model throughout the business cycle.
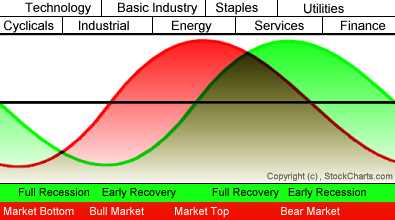
Stage: 
Consumer Expectations: 
Industrial Production: 
Interest Rates: 
Yield Curve:
Full Recession
Reviving
Bottoming Out
Falling
Normal
Early Recovery
Rising
Rising
Bottoming Out
Normal (Steep)
Full Recovery
Declining
Flat
Rising Rapidly (Fed)
Flattening Out
Early Recession
Falling Sharply
Falling
Peaking
Flat/Inverted
The graph below, courtesy of StockCharts.com , shows these relationships and the order the key sectors respond to the economic cycle. The Stock Market Cycle precedes the Economic Cycle as investors try to anticipate how the market will react to the changes to the economy.


Life Cycle of Company


Life Cycle of a Growth Stock (BBB)

What's Beyond for Bed Bath and Beyond?


Location: BlogsAsk Doug!    
Posted by: Doug Gerlach5/1/2007 3:17 PM
It's certainly true that Bed Bath & Beyond's (BBBY) price hasn't shown any consistency in the past few years, bouncing between a low of $31.56 in March 2003 and a high of $46.00 in July 2005. While it's not uncommon for stock prices to get stuck in a rut, what's a bit unusual about Bed Bath & Beyond is that the stock's earnings and revenues have been getting continually larger. As you can see from the black price bars on the graph below, BBBY's stock price has stalled since 2003.


So why hasn't the company's stock price risen along with sales and profits? One likely explanation is that the company is reaching a new stage in its company life cycle in which its EPS and Revenue growth rates will likely slow. BBBY's fiscal 2006 annual revenues were $6.6 billion, and opportunities for fast growth are harder to come by for a company of that size.

Consider the following illustration of the typical life cycle of a company. Once a new company makes it through the initial startup stage and passes the break-even point, it can grow explosively, in excess of 30% or more a year. These fast-growing companies can be excellent investment opportunities, though often it's the momentum traders and short-term focused investors who make the markets for these stocks. These kinds of stocks are often richly valued, with PE Ratios that anticipate continuing growth at very high annualized rates, and, therefore, long-term, growth-oriented investors may not have many opportunities to buy them at reasonable prices.

Ultimately, though, such rapid growth must ebb. It's simply impossible for a company to maintain such high growth on an indefinite basis. When investors begin to see that growth is slowing, they often jump ship, driving down the PE Ratio and causing the stock's price to stall.

For BBBY, the signs of slowing growth actually began appearing several years ago. On the historical graph of revenues and earnings above, you can begin to see the slowdown most evidently in 2004, with annual high and low prices stalled in a range between $33 and $47. The average annual high and low PE Ratios have also been declining each year since 2002, too: the average high PE Ratio has fallen from 37.7 to 20.7 and the average low PE Ratio has fallen from 27.0 to 14.8.

From a visual analysis of sales and earnings, it's not at all clear that the slowdown in growth and the falling prices and PE Ratios are so tightly connected. What's not apparent from the above graph is that the growth rates have been falling significantly for several years. Here is a graph of the historical growth rates for the past 1- to 9-year periods of the last decade.

Now it's obvious that the growth of the past year is much, much lower than the 9-year annualized growth rate of the company for both EPS and Revenues. (Incidentally, this graph is from Investor's Toolkit 5.)

In light of the slowing growth rates, you can see why some investors are a little reluctant to buy BBBY at the current situation. The company is in transition from being a 30% annual grower to one that grows at likely half that rate, and it can take the market several years to process the change as the company becomes a mature grower.

BBBY's sheer size does brings new competitive pressures, and Wall Street's bulls and bears are happy to debate whether or not company management is up to the challenge. Even though margins fell from 15.8% to 14.1% in 2006, BBBY's pre-tax profit margins are excellent within the retail industry. The current trailing PE Ratio of 19.9 is right around my calculated signature PE for the company, indicating that the stock is reasonably valued right now assuming an annualized EPS growth no less than 15%. Of course, the assumption that BBBY's growth will stabilize somewhere between 15% and 20% annually is key to the attractiveness of the company's long-term prospects. Even if margins fall a bit and growth is at the lower end of the range, BBBY might still be a solid long-term core holding for a portfolio.


Note: BBBY is currently rated a Buy up to $48 by the Investor Advisory Service. The comments above are Doug's alone, and do not represent the views of the independent analysts who cover BBBY for the IAS.


http://webcache.googleusercontent.com/search?q=cache:http://www.stockcentral.com/tabid/159/EntryID/6/Default.aspx

Product life cycle patterns (Rink & Swan 1979).


Turnaround and Restructuring


Turnaround and Restructuring

Zobrazit stránku: ÄŒesky
Companies often exhibit the symptoms of financial distress well before a crisis erupts. In many cases, a downward spiral is not inevitable. It can be arrested and reversed. Early detection and swift, decisive action are the keys to restoring performance and value. That is why timely and expert advice is critical.
Our turnaround and restructuring practice provides advisory and insolvency services to lenders, creditors, companies and individuals who are experiencing a wide range of difficulties, from weakening performance and reduced operating profit, to crisis marked by severe cash flow problems and the imminent threat of insolvency. Company life cycle
We are able to rapidly identify problem areas, develop value-preserving and unique solutions, and then implement them swiftly and precisely. PwC is the world's largest provider of business recovery and insolvency services.
The Prague turnaround and restructuring team has many years of experience in major restructuring projects in the Czech Republic. We have provided our services to leading companies in the steel industry, the glass and porcelain industry, and the chemical industry. We focus on implementation with the aim of helping our client rather than on producing theoretical reports on different issues. This gives us depth and breadth that are unmatched in the market place.

How investors can avoid another 'lost decade'


Gold bars - How investors can avoid another 'lost decade'
Gold has been the star performer of the decade 


The past decade has been a grim one for investors, with stock markets failing to regain the peaks seen back at the turn of the Millennium, at the height of the dotcom boom.
For pension savers, Isa investors and those with long-term savings, the market movements over the past week have mirrored the peaks and troughs seen over the past decade – with a couple of years of strong gains disappearing as the bull run fell into another punishing and protracted fall.
This "lost decade" has coincided with a period when individuals are increasingly having to make their own long-term savings, be it for pensions, funding their children's university fees or helping them get a start on the housing ladder.
This has been a particular disaster for those fast heading towards retirement, who are simply running out of time to make up lost ground. At the same time they have been hit by a double whammy of lower interest rates – meaning "safer" assets such as cash are losing value in real terms – and falling annuity rates. As a result, over the past five years many have been forced to retire on far smaller pensions than they imagined.
However, it is not all doom and gloom. For all the talk of the "lost decade" there are a number of assets, sectors and funds that have delivered strong returns during this period.
Below we look at where the smart money has gone in recent years, and assess each area's chances of outperforming in the decade ahead.

GOLD

This has been the star performer of the decade, rising in value by 606pc since the stock market peaked in 1999. Those canny enough to have bought a few gold bars as the stock market started to slip in 2000 are now sitting on substantial gains.
Other metals, such as copper, silver and platinum, have also risen in value, as have oil and agricultural commodities such as corn and coffee. Not surprisingly, funds that invest in gold and commodities have seen even more stellar gains: BlackRock Gold & General has risen by 768pc over the past 10 years, while JP Morgan Natural Resources is 610pc higher.
As long as equity markets remain in turmoil the price of gold is likely to remain high – but most experts warn that at some point there will be a sharp correction. Commodity prices, though, continue to be fuelled by demand from rapidly industrialising emerging markets, in particular China, India, Brazil and Russia.

EMERGING MARKETS

In times of market volatility share price falls can be more dramatic in these emerging economies. Over the "lost decade", though, investors have seen a positive return on their money – although much will depend of course on where and when you were invested.
Since the end of 1999 the MSCI Emerging Markets index has delivered a total return of 163pc, compared with a FTSE 100 return of just 6.72pc (this is positive only because of dividend payments) and a return of 4.78pc from the MSCI World index.
However, many funds investing in this area have done far better than the index. Henderson China Opportunities has risen by 313pc over the period. First State Global Emerging Markets, managed for most of the period by Angus Tulloch, is up by 320pc over the past 10 years, while the Indian Nifty index (its 50 biggest companies) has grown by 551pc over the past decade.
Given the demographics of the region and its potential for growth, most experts agree that it has the potential to deliver returns in future. However, markets can be volatile, so investors are often warned to bank gains after periods of strong growth, perhaps using profits to invest in other undervalued assets.

PROPERTY

Given that house prices are on the slide again, property might not feel like a particularly robust investment. But the figures show that over the past decade it has remained one of the top performing assets. Based on the Halifax Property Price Index, home owners have seen a return of 101pc on bricks and mortar since the end of 1999.
Of course there will be huge regional variations within these figures – and the vast majority of us borrow to buy our homes, so clearly have interest charges to factor in to any notional "return". And we still do need a roof over our heads: it's not as if we can cash it all in and go and live in an Isa. However, this doesn't detract from the fact that when it comes to long-term saving and retirement planning people shouldn't overlook their property.

FUNDS

Even though the UK stock market has not regained its previous highs, this doesn't mean that funds investing in British shares haven't made money over this period. Dividend income remains an important part of the total return on pensions and Isas. In addition, most fund managers won't slavishly follow an index but will be looking to invest in companies whose share price will rise faster than peers in a rising market, but won't fall like a stone when things head south.
Special situation funds, for example, try to find undervalued companies with the potential to deliver gains and good managers in this sector are among the top performers. Marlborough Special Situations has delivered a 289pc return over 10 years; Fidelity Special Situations has returned 101pc.
Another notable success story has been Neil Woodford's Invesco Perpetual High Income fund, one of the biggest and most popular unit trusts. This defensive fund, which concentrates on stocks that have the potential to deliver a rising dividend stream as well as capital growth, has returned 120pc over the past 10 years – hardly a lost decade for the thousands of private investors who have entrusted their long-term savings to this fund manager.

Life Cycle of Family


Monday 22 August 2011

The psychology of investment: caution or risk?


What makes some investors revel in danger and others flee at the first sign of market volatility?

'Mind-reading machine' can convert thoughts into speech
The psychology of investment: caution or risk? Photo: GETTY IMAGES
Evolution has programmed us to flee from danger. But the same instinct that protected early human from the sabre-toothed tiger makes for an unsuccessful investor. As global markets have fluctuated wildly, investors have been indiscriminately cashing in their investments, panic selling as times get tough.
A tenth of the fund supermarket Fidelity FundsNetwork's customers have switched their investments into less risky assets as a result of the eurozone worries, with low-risk bond funds the preferred option over equity or equity-income funds.
But if those investors kept their composure and did nothing, they would have made money as banking stocks pushed the FTSE 100 up to close last Friday on 5,320, compared to 5,247 the previous week.
But what makes some people flee to cash deposits as markets crash and others gleefully seek out opportunities among the ruin? While many of us would prefer to consider ourselves spontaneous risk-takers, when it comes to the crunch, most investors value capital preservation over high-risk, high-income investments.
"Everyone wants minimum risk and maximum return, but it is rarely possible to do both," said Neil Pedley of Vestra Wealth.
Wealth managers have the complicated task of gauging a client's risk appetite to allocate their cash correctly. Rather than take the client's word for it, wealth managers at Barclays Wealth employ personality profiling to gauge investment attitudes.
"It can be difficult for investors to be honest with themselves," said Greg Davies, who is head of behavioural finance at Barclays Wealth. "Some people like to think of themselves as composed risk-takers, but if you try to invest in a way that does not respect your natural 'type', you make decisions you are not comfortable with and you will lose money."
There are two parts of our brain that govern decision making.
1.  The first is rational, logical and more suited to decision making based on long-term goals. 
2.  The second controls emotional decision making – the fight-or-flight reflex.
In times of stress or perceived danger, humans default to the emotional brain and seek instant gratification, rather than considering long-term success. Though this "action bias" may have been a successful tactic when early human was faced with a predator, it does not help investors make money.
"When we pull our money out of markets during a crash, we get instant emotional gratification. We are happy because we have removed ourselves from the perceived danger – the risk of losing more money. However, this short-term thinking is bad for long-term goals," said Mr Davies.
As well as asking clients about their investment goals, Barclays constructs client portfolios based on the results from the personality profiling, which assesses composure in the face of risk.
The idea is that two clients could have the same amount of money to invest and the same long-term investment goals, but if one has a high level of composure and the other a low level of composure, their investments should be different. The client with the low composure is more likely to act rashly when he sees his investments fluctuate in value, so his portfolio is hedged with slower growth but low-volatility assets.
By constructing a portfolio in this way, Barclays lessens the chances of clients falling for pack mentality – buying at the highest price and selling at the lowest.
Wealth manager HFM Columbus also uses psychometric profiling to help determine clients' attitudes to investment risk, as well as the ways to best service clients, for example, are they likely to read fund literature, or would they prefer a short summary?
The test assesses five major personality traits: openness, conscientiousness, extroversion, agreeableness and emotional stability. "We are focusing principally on the 'conscientiousness' variant to ascertain how much or how little the client wishes to engage in the advice process and to ensure that we deliver the correct amount and type of information in order for them to make a decision," said director Marcus Carlton.
"We anticipate that the client's degree of conscientiousness will inform us if they are rash decision makers or if they make more studied decisions, and the profiler will also look at emotional stability in order to analyse likely reaction to unexpected outcomes – for example severe market volatility – so that we can protect clients and manage their expectations better."
You do not need a psychometric test to take advantage of this psychology. Mr Davies said investors should exercise self-knowledge and put in place a set of rules for investing.
"Most of us can help break our emotional investing habits by setting a framework in place in times of calm to be prepared for times of turbulence. You can bet those investors who are taking advantage of value stocks now will have planned their response to these situations. They will be informed and have engaged with markets for a while," said Mr Davies.

Sunday 21 August 2011

Technical Analysis: Conclusion

By Cory JanssenChad Langager and Casey Murphy

This introductory section of the technical analysis tutorial has provided a broad overview of technical analysis.
Here's a brief summary of what we've covered: 

  • Technical analysis is a method of evaluating securities by analyzing the statistics generated by market activity. It is based on three assumptions: 1) the market discounts everything, 2) price moves in trends and 3) history tends to repeat itself.
  • Technicians believe that all the information they need about a stock can be found in its charts.
  • Technical traders take a short-term approach to analyzing the market.
  • Criticism of technical analysis stems from the efficient market hypothesis, which states that the market price is always the correct one, making any historical analysis useless.
  • One of the most important concepts in technical analysis is that of a trend, which is the general direction that a security is headed. There are three types of trends: uptrendsdowntrends and sideways/horizontal trends.
  • trendline is a simple charting technique that adds a line to a chart to represent the trend in the market or a stock.
  • channel, or channel lines, is the addition of two parallel trendlines that act as strong areas of support and resistance.
  • Support is the price level through which a stock or market seldom falls. Resistance is the price level that a stock or market seldom surpasses.
  • Volume is the number of shares or contracts that trade over a given period of time, usually a day. The higher the volume, the more active the security.
  • A chart is a graphical representation of a series of prices over a set time frame.
  • The time scale refers to the range of dates at the bottom of the chart, which can vary from decades to seconds. The most frequently used time scales are intraday, daily, weekly, monthly, quarterly and annually.
  • The price scale is on the right-hand side of the chart. It shows a stock's current price and compares it to past data points. It can be either linear or logarithmic.
  • There are four main types of charts used by investors and traders: line chartsbar chartscandlestick charts and point and figure charts.
  • A chart pattern is a distinct formation on a stock chart that creates a trading signal, or a sign of future price movements. There are two types: reversal and continuation.
  • head and shoulders pattern is reversal pattern that signals a security is likely to move against its previous trend.
  • cup and handle pattern is a bullish continuation pattern in which the upward trend has paused but will continue in an upward direction once the pattern is confirmed.
  • Double tops and double bottoms are formed after a sustained trend and signal to chartists that the trend is about to reverse. The pattern is created when a price movement tests support or resistance levels twice and is unable to break through.
  • triangle is a technical analysis pattern created by drawing trendlines along a price range that gets narrower over time because of lower tops and higher bottoms. Variations of a triangle include ascending and descending triangles.
  • Flags and pennants are short-term continuation patterns that are formed when there is a sharp price movement followed by a sideways price movement.
  • The wedge chart pattern can be either a continuation or reversal pattern. It is similar to a symmetrical triangle except that the wedge pattern slants in an upward or downward direction.
  • gap in a chart is an empty space between a trading period and the following trading period. This occurs when there is a large difference in prices between two sequential trading periods.
  • Triple tops and triple bottoms are reversal patterns that are formed when the price movement tests a level of support or resistance three times and is unable to break through, signaling a trend reversal.

  • rounding bottom (or saucer bottom) is a long-term reversal pattern that signals a shift from a downward trend to an upward trend.
  • moving average is the average price of a security over a set amount of time. There are three types: simple, linear and exponential.
  • Moving averages help technical traders smooth out some of the noise that is found in day-to-day price movements, giving traders a clearer view of the price trend.
  • Indicators are calculations based on the price and the volume of a security that measure such things as money flow, trends, volatility and momentum. There are two types: leading and lagging.
  • The accumulation/distribution line is a volume indicator that attempts to measure the ratio of buying to selling of a security.
  • The average directional index (ADX) is a trend indicator that is used to measure the strength of a current trend.
  • The Aroon indicator is a trending indicator used to measure whether a security is in an uptrend or downtrend and the magnitude of that trend.
  • The Aroon oscillator plots the difference between the Aroon up and down lines by subtracting the two lines.
  • The moving average convergence divergence (MACD) is comprised of two exponential moving averages, which help to measure a security's momentum.
  • The relative strength index (RSI) helps to signal overbought and oversold conditions in a security.
  • The on-balance volume (OBV) indicator is one of the most well-known technical indicators that reflects movements in volume.
  • The stochastic oscillator compares a security's closing price to its price range over a given time period.


Read more: http://www.investopedia.com/university/technical/techanalysis11.asp#ixzz1VeCBs6Nw