Thursday, 13 April 2017

The Sales Budget

This should be in sufficient detail for management to know the sources of revenue.

The figures will be broken down into different products and different sales regions.

Each regional sales manager will have responsibility for a part of the sales budget.

Before the sales budget is done it would be normal for top management to issue budget assumptions concerning prices, competition, and other key matters.

The sales budget will be for orders taken.

There will usually be a timing difference before orders become invoiced sales.

The Profit Budget

There are usually several budgets and they all impact on each other.

The profit budget is arguably the most important.

There are two basic approaches to budgeting in a large organization, both having advantages and disadvantages..

1.   The "bottom up" method.  

  • Proposals are taken from the lower management levels.  
  • These are collated into an overall budget that may or may not be acceptable.  
  • If it is not, then top management calls for revisions.
2.  The "top down" method.
  • Top management issues budget targets.
  • Lower levels of management must then submit proposals that achieve these targets.

In practice, there is often less difference between the two methods than might be supposed.

It is important that at some stage there is a full and frank exchange of views.

Everyone should be encouraged to put forward any constructive point of view, and everyone should commit themselves to listening with an open mind.

Top management will and should, have the final decisions.

It is a common mistake for managers to be too insular and to overlook what changes competitors are making.

All the budgets are important but in a commercial organization the overall profit budget is likely to be considered the most important.


Note the following points:

  • Most budgets are for a year but this is not a requirement.  they can be for six months or for any other useful period.
  • Most budget gives monthly figures, which is the most common division, but again this is not fixed.  the divisions can be weekly, quarterly or some other period.
  • A summary budget is useful for a large organization.  The budgets leading up to these summarized figures will be more detailed.
  • Various subsidiary budgets and calculations feed figures through to the summary budget.


Standard Costing

Standard costing involves the setting of targets, or standards, for the different factors affecting costs.

Variances from the standard are then studied in detail.


For example:

Standard timber usage per unit of production                       4.00 meters
Standard timber price                                                      $2.00 per meter
Actual production                                                                   3,500 posts
Actual timber usage                                                           14,140 meters
Actual cost of timber used                                                           $27,714


Material Price Variance is                                      $566 favourable (2%)
(14,140 x $2.00) - $27,714
= $28,280 - $27,714
= $566


Material Usage Variance is                                          $280 adverse (1%)
[(14,140 meters less 3,500 x 4.00 meters) x $2]
= [(14,140 meters less 14,000 meters) x $2]
= $280


The material price variance happens because the standard cost of the 14,140 meters used was $28,280 (at $2 per meter).  The actual cost was $27,714, a favourable variance of $566.

On the other hand, 140 meters of timber too much was used resulting in an adverse material usage variance.


Joel Greenblatt: Value Investing for Small Investors


Absorption Cost

Absorption cost takes account of all costs and allocates them to individual products or cost centers.


Direct or variable costs

Some costs relate directly to a product and this is quite straightforward in principle, although very detailed record-keeping may be necessary.

Among the costs that can be entirely allocated to individual products are

  • direct wages and associated employment costs, 
  • materials and bought-in components.


Indirect costs

Other costs do not relate to just one product and these must be allocated according to a fair formula.  

These indirect costs must be absorbed by each product.

There is not a single correct method of allocating overhead costs to individual products and it is sometimes right to allocate different costs in different ways.

The aim should be to achieve fairness in each individual case.  

Among the costs that cannot be entirely allocated to individual products are

  • indirect wages (cleaners, maintenance staff, etc.), 
  • wages of staff such as salesmen and accountants, and 
  • general overheads such as rent and business rates.


Take care to allocate non-direct costs fairly

Great care must be taken in deciding the best way to allocate the non-direct costs.

There are many different ways.

The following two are common methods:

  1. Production hours
  2. Machine hours


Common Methods for allocating non-direct costs fairly

1.   Production hours

The overhead costs are apportioned according to the direct production hours charged to each product or cost center.

For example:

Consider a company with just two products.

Product A having 5,000 hours charged and Product B having 10,000 hours charged.  

If the overhead is $60,000.  Product A will absorb $20,000 and Product B will absorb $40,000.


2.  Machine hours

The principle is the same bt the overhead is allocated according to the number of hours that the machinery has been running.

For example:  

Consider a company that manufactures three types of jam.

Its overhead costs in January are $18,000 and it allocates them in the proportion of direct labour costs.


January Cost Statement
                                    

                                  Strawberry      Raspberry        Apricot         Total
Jars produced              26,000           60,000           87,000           173,000           

                                          $                    $                   $                      $
Costs                        
Direct labour                   2,000            4,000            6,000              12,000
Ingredients                      6,000           11,000          17,000              34,000
Other direct costs            2,000             3,000            6,000              11,000

Total Direct Costs         10,000           18,000         29,000              57,000

Overhead allocation         3,000             6,000           9,000              18,000

Total Cost                      13,000            24,000        38,000              75,000

Cost per jar                    50 sen            40 sen         43.7 sen           43.4 sen  


In the above, the direct labour is smaller than the overhead cost that is being allocated.

The trend in modern manufacturing is for direct costs and particularly direct labour costs, to reduce as a proportion of the total costs.  

If the overheads had been allocated in a different way, perhaps on floor area utilized, then the result would almost certainly not have been the same.

This increases the importance of choosing the fairest method of apportionment


Yield Curves and Breakeven Inflation


Real Yields = Nominal Yields - Breakeven Inflation


Wednesday, 12 April 2017

Break-even charts

In nearly all businesses, there is a close correlation between the level of turnover and the profit or loss.

The managers should know that if invoiced sales reach a certain figure the business will break even.

If invoiced sales are above that figure the business will be in profit.

The break-even point depends on the relationship between the fixed and the variable (or direct) costs.


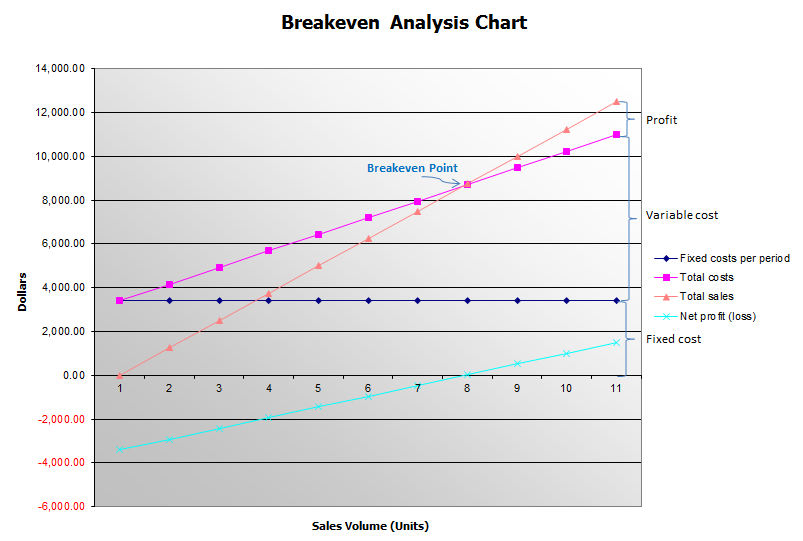
Breakeven chart

Image result

The break-even point can be calculated by drawing a graph showing how fixed costs, variable costs, total costs and total revenue change with the level of output.


Fixed costs are shown as a flat line in the chart above..

The total costs are the result of adding the variable costs to the fixed costs.

The revenue is the result of sales.

The break-even point is when the total costs line crosses the revenue line.  It is at this point where these lines cross.

Profit and loss can also be read from the chart.

In practice, the relationships are rarely quite so straightforward, as some of the costs may be semi-variable.


More charts:


Related image


Related image


Related image


The uses of costing

It costs time and money to produce costing information and it is only worth doing if the information is put to good use.

The following are some of these uses.

  1. To control costs
  2. To promote responsibility
  3. To aid business decisions
  4. To aid decisions on pricing

1.  To control costs

Possession of detailed information about costs is of obvious value in the controlling of those costs.


2.  To promote responsibility

Management theorists agree that power and responsibility should go together, although often they do not do so

Timely and accurate costing information will help top management hold all levels of management responsible for the budgets that they control.

Care should be taken that managers are not held responsible for costs that are not within their control.  This does sometimes happen.


3.  To aid business decisions

Management must decide what to do about the unprofitable product.


4.  To aid decisions on pricing

We live in competitive times and the old 'cost plus' contracts are now virtually never encountered.

What the market will bear is usually the main factor in setting prices.

Nevertheless, detailed knowledge concerning costs is an important factor in determining prices.

Only in exceptional circumstances will managers agree to price goods at below cost.

They will seek to make an acceptable margin over cost.

Accurate costing is vital when tenders are submitted for major contracts and errors can have significant consequences.

Massive costing errors on the Millennium Dome at Greenwich were a spectacular example of what can go wrong.


Marginal Costing: Selling price > Variable or Direct cost ---> part of the Fixed cost is absorbed by the margin.

Marginal costing is a useful way of emphasizing the marginal costs of production and services.

This information is of great help in making pricing decisions.

If the selling price is less than the variable cost (direct cost),

  • the loss will increase as more units are sold, and
  • managers will only want to do this in very exceptional circumstances, such as a supermarket selling baked beans as a loss leader.


If the selling price is greater than the variable cost,

  • then the margin will absorb part of the fixed cost, and,
  • after a certain point profits will be made.


Why some goods are sold very cheaply at certain time?

Marginal costing explains why some goods and services are sold very cheaply.

It explains,f or example, why airline tickets are sometimes available at extremely low prices for last-minute purchasers.

  • Once an airline is committed to making a flight, an extremely high part of the cost of that flight can properly be regarded as a fixed cost.  The pilot's salary will be the same whether the plane is empty or full.  
  • The variable cost (direct cost) is only the complimentary meals and few other items.  
  • It therefore makes sense to make last-minute sales of unsold seats at low prices.
  • As long as the selling price is greater than the variable cost, a contribution is made (absorbing part of the fixed cost).

A basic understanding of the principles of costing is important in business management.

Most non-financial managers instinctively know that costing is important.

Unfortunately, it is probably also true that most non-financial managers do not know very much about it.

This is a pity because it affects so many business decisions.

For example, the fixed costs of running a cruise ship do not vary (or realistically only vary slightly) according to the number of passengers is the reason that large last-minute price reductions are often available. (Think of that when you book your holiday.)

A basic understanding of the principles of costing is important in business management.

The Working Capital Management: Success in managing debtors, stock and creditors affect cash.

The four largest elements affecting working capital are usually

  • debtors, 
  • stock, 
  • creditors and 
  • cash.


Success in managing the first three affect cash, which can be reinvested in the business or distributed.


Debtors

Many local businesses are plaqued by slow payment of invoices and it is a problem in many other countries too.

A statutory right to interest has been in place for a number of years but nothing seems to make much difference.

An improvement can significantly affect working capital.

It is a great problem for managers, who sometimes are frightened of upsetting customers and feel that there is little that they can do.

This is  completely the wrong attitude.

Customer relations must always be considered, but a great deal can be done.

Some practical steps for credit control are summarized below:


  • Have the right attitude; ask early and ask often.
  • Make sure that payment terms are agreed in advance.
  • Do not underestimate the strength of your position.
  • Give credit control realistic status and priority.
  • Have well-thought out credit policies.
  • Concentrate on the biggest and most worrying debts first.
  • Be efficient; send out invoices and statements promptly.
  • Deal with queries quickly and efficiently.
  • Make full use of the telephone, your best aid.
  • Use legal action if necessary.

This may sound obvious but it usually works.

Be efficient, ask and be tough if necessary.


Stock

The aim should be 
  • to keep stock as low as is realistically feasible and 
  • to achieve as high a rate of stock turnover as is realistically feasible.

In practice, it is usually necessary to compromise between 
  • the wish to have stock as low as possible, and 
  • the need to keep production and sales going with a reasonable margin of safety.

Exactly how the compromise is struck will vary from case to case.  

Purchasing and production control are highly skilled functions and great effort may be expended on getting it right.

"Just in time deliveries" is the technique of arranging deliveries of supplies frequently and in small quantities.  In fact, just in time to keep production going.

It is particularly successful in japan where, for example, car manufacturers keep some parts for production measured only in hours.

It is not easy to achieve and suppliers would probably like to make large deliveries at irregular intervals.  

It may pay to approach the problem with an attitude of partnership with key suppliers, and to reward them with fair prices and continuity of business.

Finished goods should be sold, delivered and invoiced as quickly as possible.


Creditors

It is not ethical advice, but there is an obvious advantage in paying suppliers slowly.

This is why slow payment is such a problem and, as has already been stated, the control of debtors is so important.

Slow payment is often imposed by large and strong companies on small and weak suppliers.

Slow payment does not affect the net balance of working capital,but it does mean that both cash and creditors are higher than would otherwise be the case.

Apart from moral considerations, there are some definite disadvantages in a policy of slow payment:
  • Suppliers will try to compensate with higher prices or lower service.
  • Best long-term results are often obtained by fostering mutual loyalty with key suppliers; it pays to consider their interests.
  • If payments are already slow, there will be less scope for taking longer to pay in response to a crisis.
For these reasons it is probably not wise to adopt a consistent policy of slow payment, at least with important suppliers.

It is better to be hard but fair and to ensure that this fair play is rewarded with 
  • keen prices, 
  • good service and 
  • perhaps prompt payment discounts.

There may be scope for timing deliveries to take advantage of payment terms.  

For example, if the terms are 'net monthly account', a 30 June delivery will be due for payment on 31 July.  At 1 July delivery will be due for payment on 31 August.


Tuesday, 11 April 2017

The Management of Working Capital. Is it important?

The effective management of working capital can be critical to the survival of the business and it is hard to think of anything more important then that.

Many businesses that fail are profitable at the time of their failure and failure often comes as a surprise to the managers.

The reason for the failure is a shortage of working capital.

Furthermore, effective management of working capital is likely to improve profitability significantly.

The percentage return on capital employed increases as capital employed is reduced.

Effective management of working capital can reduce the capital employed.

It increases profits as well as enabling mangers to sleep soundly without worries.

The four largest elements affecting working capital are usually

  • debtors, 
  • stock, 
  • creditors and 
  • cash.

Success in managing the first three affect cash, which can be reinvested in the business or distributed.

The Cash-Flow Forecast

It is extremely important that cash receipts and payments are effectively planned and anticipated.

This has not been done in nearly all businesses that fail.

A good manager will plan that sufficient resources are available but that not too many resources are tied up.

This can be done in isolation but it is better done as part of the overall budgeting process.


Cash-Flow Forecast will yield many benefits

The preparation of a detailed Cash-Flow Forecast will yield many benefits.

Calculating and writing down the figures may suggest ideas as to how they can be improved.

For example,

  • the figures for cash payments from trade debtors will be based on the estimate of the average number of days' credit that will be taken.
  • This will pose the question of whether or not payments can be sped up.


Are the Cash-Flow Forecast results acceptable?

When the Cash-Flow Forecast is finished it will be necessary to consider if the results are acceptable.

  • Even if resources are available the results might not be satisfactory, and improvements will have to be worked out.
  • If sufficient resources are not available, either changes must be made or extra resources arranged.  Perhaps, an additional bank overdraft can be negotiated.

Either way, a well-planned document will help managers to take action in good time.


Best illustrated in a table format

The principles of a Cash-Flow Forecast are best illustrated with an example in a table format.

Variations in the layout are possible but a constant feature should be the running cash or overdraft balance.

Do not overlook contingencies and do not overlook the possibility of a peak figure within a period.

What is cash?

Cash includes the notes and coins in the petty cash box.

It also includes money in the bank current accounts, and money in various short-term investment accounts that can be quickly be turned into available cash.

It is common for a Balance Sheet to show only a tiny amount for cash.  This is because the business has an overdraft and only such things as the petty cash are included.

Practical management usage of the term cash includes a negative figure for an overdraft.

A Cash-Flow Forecast can often result in a series of forecast overdrafts.

The distinction between Profit and Cash. A business can be profitable but short of cash.

Cash is completely different from profit, a fact that is not always properly appreciated.

It is possible, and indeed quite common, for a business to be profitable but short of cash.

Among the differences are the following:

  1. Money may be collected from customers more slowly (or more quickly) than money is paid to suppliers.
  2. Capital expenditure (unless financed by hire purchase or similar means) has an immediate impact on cash.  The effect on profit, by means of depreciation, is spread over a number of years.
  3. Taxation, dividends and other payments to owners are an appropriation of profit.  Cash is taken out of the business which may be more or less than the profit.
  4. An expanding business will have to spend money on materials, items for sale, wages, etc. before it completes the extra sales and gets paid.  Purchases and expenses come first.  Sales and profit come later.

Four Key Questions when using Financial Information and Interpreting Accounting Ratios

There are many traps in using financial information and interpreting accounting ratios.

You are advised to approach the job with caution and always keep in mind four key questions:

  1. Am I comparing like with like?
  2. Is there an explanation?
  3. What am I comparing it with?
  4. Do I believe the figures?


1.  Am I comparing like with like?

Financial analysts pay great attention to the notes in accounts and to the stated accounting policies.

One of the reasons for this is that changes in accounting policies can affect the figures and hence the comparisons.

For example:
  • Consider a company that writes off research and development costs as overheads as soon as they are incurred.
  • Then suppose that it changes policy and decides to capitalize the research and development, holding it in the Balance Sheet as having a long-term value.
  • A case can be made for either treatment but the change makes it difficult to compare ratios for different years.


2.  Is there an explanation?

Do not forget that there may be a special reason for an odd-looking ratio.

For example:
  • Greetings card manufacturers commonly deliver Christmas cards  in August with an arrangement that payment is due on 1 January.
  • The 30 June Balance Sheet may show that customers are taking an average of 55 days' credit.
  • The 31 December Balance Sheet may show that customers are taking an average of 120 days' credit.
  • This does not mean that the position has deteriorated dreadfully and the company is in trouble
  • The change in the period of credit is an accepted feature of the trade and happens every year.
  • It is of course important, particularly as extra working capital has to be found at the end of each year.


3.  What am I comparing it with?

A ratio by itself has only limited value.

It needs to be compared with something.

Useful comparisons may be with the company budget, last year's ratio, or competitors' ratios.


4.  Do I believe the figures?

You may be working with audited and published figures.

On the other hand, you may only have unchecked data rushed from the accountant's desk.

This sort of information may be more valuable because it is up to date.

But beware of errors.

Even if you are not a financial expert, if it feels wrong, perhaps it is wrong.


Accounting Ratios - these are among the most important

There are many useful ratios that can be taken from accounts.

The following are among the most important but there are many others.

  • Profit turnover
  • Return on Capital Employed 
  • Stock turn
  • Number of Days' Credit Granted
  • Number of Days' Credit Taken
  • Dividend per Share
  • Price/earnings ratio

When going through a set of accounts, it is a good idea to pick out relevant figures, work out the ratios and try to draw conclusions.

For all the ratios, if you have access to frequently produced management accounts, the ratios will be more useful.


Questions to ask yourself regarding Accounting Ratios:


  1. What was the ratio of Profit to Turnover?
  2. What was the Return on Capital Employed?
  3. What was the Stock Turn?
  4. What was the number of days' credit granted?  (Ignore possible GST or VAT implications)
  5. What is the working capital?  Does this give cause for concern?


Dividend per share

For example;

Total dividends  $2 million
Number of issued shares  10 million
Dividend per share  20 sen.

This is the total dividends for the year divided by the number of shares in issue.

Any preference shares are normally disregarded.

Price/earnings ratio

For example:

Profit after tax  $5 million
Number of issued shares 10 million
Earnings per share 50 sen
Current share price $7.50
Price/earnings ratio 15

This is one of the most helpful of the investment ratios and it can be used to compare different companies.

The higher the number the more expensive the shares.

It is often useful to do the calculation based on anticipated future earnings rather than declared historic earnings, although of course you can never be certain what future earnings will be.

The calculation is the current quoted price per share divided by earnings per share.

Gearing

For example:

Loans  $6 million
Shareholders' funds $3 million
Gearing 200%


The purpose of this ratio is to compare the finance provided by the banks and other borrowing with the finance invested by shareholders.

It is a ratio much used by banks, who may not like to see a ratio of 1 to 1 (or some other such proportion) exceeded.

The ratio is sometimes expressed as a proportion as in 1 to 1.

Sometimes it is expressed as a percentage:  1 to 1 is 50% because borrowing is 50% of the total.

Gearing is said to be high when borrowing is high in relation to shareholders' funds.

This can be dangerous but shareholders' returns will be high if the company does well  

This is what is meant by being highly geared.

Number of days' credit taken

In this case the figure for closing trade creditors is compared with that for the annual purchases.  

Annual costs of sales  $6 million
Trade creditors  $1.0 million
Number of days' credit taken

The calculation is (1.0 / 6.0) x 365 = 61 days


Number of days' credit granted

For example:

Annual turnover including GST  $10 million
Trade debtors $1.5 million
Number of days' credit  55

The calculation is:  (1.5 / 10) x 365 = 55 days

Obviously, the lower the number of days the more efficiently the business is being run.

The figure for trade debtors normally comes from the closing Balance Sheet and care should be taken that it is a figure typical of the whole year.

If $1.5 million of the $10 million turnover came in the final month, the number of days' credit is really 31 instead of 55.

The calculation is:  (1.5 / 1.5 ) x 31 = 31 days

Care should also be taken that the GST-inclusive debtors figure is compared with the GST-inclusive turnover figure.

GST is normally excluded from the Profit and Loss Account.


GST = General Sales Tax
In other countries, it is the VAT or Value Added Tax.

Stock Turn or Inventory Turn

For example:

Annual turnover  $10 million
Annual cost of sales (60%)  $6 million
Stock value $1.5 million
Stock turn 4


This measures the number of times that total stock is used (turned over) in the course of a year.

The higher the stock turn the more efficiently the business is being run, though adequate safety margins must of course be maintained.

It is important that the terms are completely understood and that there are no abnormal factors.

Normally the definition of stock includes all finished goods, work in progress and raw materials.

The stock value will usually be taken from the closing Balance Sheet but you need to consider if it is a typical figure.

If the business is seasonal, such as a manufacturing of fireworks, it may not be.  

A better result may be obtained if the average of several stock figures throughout the year can be used.

Profit Turnover

For example:

Annual turnover $10 million
Annual profit before tax $1 million
Profit before tax to turnover 10%


This uses Profit before tax but it may be more useful to use Profit after tax.

Perhaps you want to define profit as excluding the charge for bank interest (EBIT or Earnings before Interest and Tax).

You should select the definition most relevant to your circumstances.

Return on Capital Employed

For example:

Capital employed $5 million
Annual profit after tax $1 million
Return on capital employed 20%

The profit may be expressed before or after tax.

Capital employed is the net amount invested in the business by the owners and is taken from the Balance Sheet.

Many people (including Warren Buffett) consider this the most important ratio of all.

It is useful to compare the result with a return that can be obtained outside the business.

If a bank is paying a higher rate, perhaps the business should be closed down and the money put in the bank.

Note that there are 2 ways of improving the return.  In the example above:

  • the return on capital employed would be 25% if the profit was increased to $1.25 million.
  • it would also be 25% if the capital employed was reduced to $4 million.

Reading the content of the Annual Report

The content of the Annual Report and Accounts is governed by the law and accounting standards, though directors do still have some discretion.

Listed companies are required to use international accounting standards.

If you are looking at the Report and Accounts of a listed company you will see the following:
  • Independent Auditor's Report
  • Balance Sheet (it might be called Statement of Financial Position)
  • Statement of Comprehensive Income or it might be called Income Statement (this corresponds with the Profit and Loss Account)
  • Statement of Changes in Equity
  • Statement of Cash Flows
  • Notes to the financial statements
  • Chairman's Statement
  • Directors' Report
  • Business Review
  • Directors' Remuneration Report
There is so much detail that there is really no substitute for diving in and having a look at the Report and Accounts of your chosen company.

Try not to get bogged down.  Best of luck.


Additional Notes:

Can you locate the following in the Report and Accounts of the company you are interested?
  • the pre-tax profit (Profit and Loss Account)
  • details of the fixed assets (Balance Sheet and supporting notes)
  • the amount of any exports (the notes)
  • is it an unqualified audit report? (the Audit Report)
  • details of any political or charitable donation (the Directors' Report)
  • was there a cash outflow in the period? (the Cash Flow Statement)
  • details of the share capital (Balance Sheet and supporting notes)
  • the amount of the capital employed (the Balance Sheet).

Consolidated Accounts

A large group may have a hundred or more companies.

It would obviously give an incomplete picture if each of these companies gave information just about its own activities.

This is especially true when companies in a group trade with each other.

This is why the holding company must include consolidated accounts as well as its own figures.

The effect of inter-group trading is eliminated and the Consolidated Balance Sheet gives the group's position in relation to the outside world.

This does not remove the obligation for every group company to prepare and file its own accounts.

Such accounts must include the name, in the opinion of the directors, of the ultimate holding company.

Cash Flow Statement

There are sometimes disputes about the figures in the Profit and Loss Account and Balance Sheet.

This is one reason why cash is so important.  

Cash is much more a matter of fact rather than of opinion.

It is either there or it is not there.

Whether the cash came from (banks, shareholders, customers) is also a matter of fact.

So too is where the cash went to (dividends, wages, suppliers, etc.).

The Cash Flow Statement gives all this information.

Late filing of financial accounts

Unfortunately, a small minority of companies file their accounts late or even not at all.

This is an offence for which the directors can be punished and the company incur a penalty, but it does happen.

It is often companies with problems that file late.

Why profit is listed with the liabilities in the Balance Sheet?

Assets and Liabilities in the Balance Sheet

  • Assets in the Balance Sheet are the debit balances in the bookkeeping system.
  • Liabilities in the Balance Sheet are credit balances in the bookkeeping system.


Credit and Debit Balances in the Profit Statement

  • In the Profit Statement, sales and income are the credit balances.
  • In the Profit Statement, costs are the debit balances.
  • The net total of all the balances is the profit or loss.
  • This one figure (profit or loss) goes into the Balance Sheet as a single item.
  • A profit is a credit which is listed with the liabilities.


Explanation on why profit (a credit balance in the Profit Statement) is listed with liabilities in the Balance Sheet

  • The explanation is that the profit belongs to someone outside the business. 
  • If the Balance Sheet is for a company, the profit belongs to the shareholders.
  • It may one day be paid to them in the form of a dividend or by return of capital on the winding up of the company.

Debit and Credit Balances

The first rule of double-entry bookkeeping is that for every debit there must be a credit.

This means that an accounting entry always involves one account being debited and another account being credited.

Let us consider what happens when a $20,000 car is purchased.

  • The Motor Vehicle account (which is an asset) is debited with $20,000.
  • The Bank Account is credited with $20,000.

Two accounting rules to Understand Balance Sheets

In order to understand the Balance Sheets, you must be familiar with the following two fundamental accounting rules:


  • For every debit there must be a credit.
  • Balance Sheet assets are debit balances and Balance Sheet liabilities are credit balances.

Depreciation

Fixed assets are assets that will have a value to the business over a long period, usually understood to be any time longer than a year.

They do usually lose their value:

  • either with the passage of time (e.g. a lease),
  • with use (e.g. a piece of machinery that wears out) or
  • due to obsolescence (e.g. computers).


Therefore, they are written off over a number of years.

Depreciation is a book entry and no cash is involved.

The entry is:

  • debit depreciation (thus reducing profit)
  • credit the asset (thus reducing the value of the asset).


Fixed assets are grouped together in the Balance Sheet and one total is given for the net value of all of them.

Examples of fixed assets are:

  • freehold property
  • plant and machinery
  • computers
  • motor vehicles

Prudent Reserves

When something happens that causes an asset to lose value, it is written off.

  • For example, if some stock (asset) is stolen, the value of the stock in the Balance Sheet is reduced.

The same thing must happen if a prudent view is that an asset has lost some of its value.

  • For example, if some of the stock is obsolete and unlikely to sell for full value.
  • Normally, the Balance Sheet will just show the reduced value, which will be explained with notes.


Stock reserve

The creation of a stock reserve reduces the profit.

  • If it is subsequently found that the reserve was not necessary, the asset is restored to its full value and the profit is correspondingly increased in a later period.


Bad debt reserve

It is often necessary to create a bad debt reserve to cover money that may not be collectable from customers.

  • This bad debt reserve reduces the profit.
  • For example, loan loss reserve or provision by the banks.


Working Capital

This is the difference between current assets and current liabilities.

It is extremely important.

  • A business without sufficient working capital cannot pay its debts as they fall due. 
  • In this situation it might have to stop trading even if it is profitable.


Possible alternatives might include:

  • raising more capital,
  • taking out a long-term loan, or
  • selling some fixed assets.

Monday, 10 April 2017

Try to get a long-term loan

A bank overdraft is repayable on demand.

A long-term loan is repayable at a future date, or more likely in installments over a period.

If times are hard (or even if they are not), there are obvious advantages to having a long-term loan instead of an overdraft, or as well as an overdraft.

So long as you do not breach the terms of the agreement, you cannot be forced to pay it back quickly.

This gives you peace of mind.

Get your customers to pay on time

Take it seriously and give the task the time and resources necessary.

Tel yourself that you are entitled to be paid on time and that you are being cheated if you are not.

Agree the terms in advance and make it clear that they should be honoured.

A good motto is "ask early and ask often".

If all else fails take legal action.

A tough but fair line will probably not upset your customers, but it might.

Ask yourself if you really want those customers.

Never forget the importance of working capital

Working capital is the difference between assets realizable in the short term and liabilities payable in the short term.

It includes cash held and money owed.

Quickly realizable assets are the next best thing to cash.

If you can get the working capital right, you should be safe.

Try hard to achieve this.

Never forget the importance of cash

"Cash is King"

Losses may eventually force a business to close but in the short term, lack of cash is likely to be the critical factor.

You should hoard cash and you should plan your cash flow very carefully - daily if necessary.

Talk to your bank early and explain your plans.

Cash should be the number one priority.

Keep an eye on the accounting ratios

These are always useful, but are particularly so if a business is in trouble.

You should know what is acceptable and you should monitor trends over a period.

If things are going wrong, this may spotlight the dangers and indicate where remedial action is needed.

Gearing and the number of days' credit given and taken may be especially useful.

Do not overlook the value of marginal costing

When times are tough there is likely to be pressure on sales and margins.

In this situation, marginal costing could be very helpful.

It may be essential to cut fixed costs and it may be necessary to adjust prices.

Marginal costing should help you make the right decisions.

Prevention is better than cure

It is good to be able to get out of financial difficulties but it is better not to have financial difficulties in the first place.

The intelligent and timely use of financial information can help avoid them.

It is tempting not to plan and budget in the good times, but it is probably a mistake.

Do not drown in financial detail

You may be given a vast amount of financial information, particularly if you work for a large company.

This could be because someone believes that it is useful or just because the system automatically provides it.

Remember the old saying about not being able to see the wood for trees.

Learn to concentrate on what is important and give little or no attention to the rest.

That way you will get the key financial information and still have time to do your job.

This is particularly important when things are tough and your time is at a premium.

Use the financial figures quickly

Financial data should help you survive tough times and it will be more valuable if you can get it quickly and use it quickly.

It is sometimes better to have slightly inaccurate or incomplete information quickly than perfect information some time later.

Talk this over with your financial colleagues.  Make time to look at it and act on it when it comes.

Be sceptical about expert advice

Experts will probably give you good advice, but do not overlook the possibility that they may be mistaken.


  • For centuries, experts said that the world was flat, but Christopher Columbus proved them wrong.
  • Experts (who were paid a lot of money) or some of them at least, failed to foresee and plan for the economic mess that has plaqued much of the world in 2008/2009.
You may not be a financial expert but you are probably an expert at your particular job.  If the advice feels wrong, perhaps it is wrong.

Investment Decisions

Some investment decisions are easy to make.

  • Perhaps, a government safety regulation makes an item of capital expenditure compulsory.
  • Or perhaps, an essential piece of machinery breaks down and just has to be replaced.
Many other investment decisions are not nearly so clear cut and hinge on whether the proposed expenditure will generate sufficient future cash savings to justify itself.

There are many very sophisticated techniques for aiding this decision.  Here are three techniques that are commonly used:

  • Payback
  • Return on investment
  • Discounted cash flow.

Payback
This has the merit of being extremely simple to calculate and understand.  It is a simple measure of the period of time taken for the savings made to equal the capital expenditure.

Return on investment
This takes the average of the money saved over the life of the asset and expresses it as a percentage of the original sum invested.

Discounted cash flow.
This technique takes account of the fact that money paid or received in the future is not as valuable as money paid or received now.  For this reason, it is considered superior to payback and to return on investment.  However, it is not as simple to calculate and understand.  Discounted cash flow involves bringing the future values back to its Net Present Value.

Accounting for a Major Project Lasting 4 Years in the Construction Sector

In accounting, costs must be fairly matched to sales.

This is so that the costs of the goods actually sold, and only those costs, are brought into the Profit and Loss Statement.


A Major Project lasting 4 years

Contractor will be paid $60 m
Costs over the 4 years are expected to be $55 m
Anticipated profit is $5 m.

It is almost certain the contractor will receive various stage payments over the 4 years.

This poses a multitude of accounting problems and there is more than one accounting treatment.

The aim must be to bring in both revenue and costs strictly as they are earned and incurred.

Accounting standards provide firm rules for the published accounts.

  1. The full $60 m revenue will not be credited until the work is completed.
  2. In fact, there will probably be a retention and it will be necessary to make a reserve for retention work.
  3. The final cost and profit may not be known for some years.
  4. Conventions of prudent accounting should ensure that profits are only recognized when they have clearly been earned.
  5. Losses on the other hand should be recognized as soon as they can be realistically foreseen.  


Failure to act on this convention has led to scandals and nasty surprises for investors.  The collapse of some big companies being examples.


Prudence and the matching of costs to income - the Principles:

  • Accruals are costs incurred, but not yet in the books.
  • Prepayments are costs in the books, but not yet incurred.
  • Profit is reduced by expected bad debts.
  • Depreciation is a book entry to reduce the value of fixed assets.
  • Profit accounting may differ from cash accounting.
  • Profit Statements should be prudent.
  • Costs must be matched to income.


Additional Notes:

Accruals (costs not yet entered)
Invoices are submitted after the event and some will not have been entered into the books when they are closed off.  This problem is overcome by adding in an allowance for these costs.  The uninvoiced costs are called accruals.

An example is a company whose electricity bill is around $18,000 per quarter.  Let us further assume that assume that accounts are made up to 31 December and that the last electricity bill was up to 30 November.  The accountant will accrue $6,000 for electricity used but not billed.  If electricity invoices in the period total $60,000 the added $6,000 will result in $66,000 being shown in in the Profit Statement.

Prepayments (cost entered in advance)
Costs may have been entered into the books for items where the benefit has not yet been received.  

For example, consider an insurance premium of $12,000 paid on 1 December for 12 months's coer in advance.  If the Profit Statement is made up to 31 December the costs will have been overstated by 11/12 x $12,000 = $11,000.  The accountant will reduce the costs accordingly.  These reductions are called prepayments.

Bad debt reserves and sales ledger reserves
Many businesses sell on credit and at the end of the period of the Profit Statement money will be owed by customers  Unfortunately not all this money will necessarily be received.  Among the possible reasons are:

  • bad debts
  • an agreement that customers may deduct a settlement discount if payment is made by a certain date.
  • the customers may claim that there were shortages, or that they received faulty goods; perhaps goods were supplied on a sale-or-return basis.
The prudent accountant will make reserves to cover these eventualities, either a bad debt reserve or sales ledger reserve.  Sales (and profit) will be reduced by an appropriate amount.

Time will tell whether the reserves have been fixed at a level that was too high, too low, or just right.  If the reserves were too cautious there will be an extra profit to bring into a later Profit Statement.  If the reserves were not cautious enough there will be a further cost (and loss) to bring into a later Profit Statement.

Friday, 7 April 2017

Buffett slams Wall Street 'monkeys', says hedge funds, advisors have cost clients $100 billion


Warren Buffett, chairman and chief executive officer of Berkshire Hathaway Inc.
Andrew Harrer | Bloomberg | Getty Images
Warren Buffett, chairman and chief executive officer of Berkshire Hathaway Inc.
Warren Buffett on Saturday devoted more than four pages of his 29-page annual shareholder letter to criticism of active managers on Wall Street, excoriating what he perceived as exorbitant fees they charge for returns that fail to live up to lofty assumptions.
Meanwhile the legendary stock picker extolled the virtues of passive investing and its advantages for regular investors. The 'Oracle of Omaha' even compared active managers to monkeys, and estimated that financial advisors, in their futile search for ways to beat the market, had cost clients $100 billion in wasted fees in the last 10 years.
"When trillions of dollars are managed by Wall Streeters charging high fees, it will usually be the managers who reap outsized profits, not the clients," stated the widely-read letter released on Saturday morning. "Both large and small investors should stick with low-cost index funds."
SEC HEDGE FUNDS
Chris Kleponis | Bloomberg | Getty Images
'The results were dismal'
Buffett started this critical section of the letter with an update on a 10-year wager against Wall Street's active management he made nine years ago, with the proceeds going to a charity. This is how the billionaire described his original challenge:
"I publicly offered to wager $500,000 that no investment pro could select a set of at least five hedge funds – wildly-popular and high-fee investing vehicles – that would over an extended period match the performance of an unmanaged S&P-500 index fund charging only token fees. I suggested a ten-year bet and named a low-cost Vanguard S&P fund as my contender. I then sat back and waited expectantly for a parade of fund managers – who could include their own fund as one of the five – to come forth and defend their occupation. After all, these managers urged others to bet billions on their abilities. Why should they fear putting a little of their own money on the line?"
To his surprise, only one person stepped up to take the other side of the bet: Protégé Partners' Ted Seides, a 'fund of funds' manager. According to the bet, Seides selected five funds of hedge funds, whose results after fees would be averaged and compared to Buffett's selection, a Vanguard S&P index fund.
Here's what happened, according to the letter: 
"The compounded annual increase to date for the index fund is 7.1%, which is a return that could easily prove typical for the stock market over time...The five funds-of-funds delivered, through 2016, an average of only 2.2%, compounded annually. That means $1 million invested in those funds would have gained $220,000. The index fund would meanwhile have gained $854,000."
In fact, none of the basket of funds came even close, according to Buffett:
"The results for their investors were dismal – really dismal. And, alas, the huge fixed fees charged by all of the funds and funds-of-funds involved – fees that were totally unwarranted by performance – were such that their managers were showered with compensation over the nine years that have passed," Buffett wrote. "As Gordon Gekko might have put it: 'Fees never sleep.'"
Investors seem to be heeding Buffett's anti-active advice, as more than $20 billion flowed out of U.S. active equity funds in January despite a rising stock market, according to Morningstar. In the last 12 months, more than half a trillion dollars have flowed into passive funds, while active funds have experienced outflows, Morningstar's data showed. 
In his letter, Buffett criticized how the whole Wall Street complex is still set up to send pension funds, endowments and other investor types into under-performing active vehicles. He claimed that the wealthy investor classes are getting ripped off the most:
"In many aspects of life, indeed, wealth does command top-grade products or services. For that reason, the financial 'elites' – wealthy individuals, pension funds, college endowments and the like – have great trouble meekly signing up for a financial product or service that is available as well to people investing only a few thousand dollars. This reluctance of the rich normally prevails even though the product at issue is –on an expectancy basis – clearly the best choice. My calculation, admittedly very rough, is that the search by the elite for superior investment advice has caused it, in aggregate, to waste more than $100 billion over the past decade. Figure it out: Even a 1% fee on a few trillion dollars adds up. Of course, not every investor who put money in hedge funds ten years ago lagged S&P returns. But I believe my calculation of the aggregate shortfall is conservative."
Buffett stated that he knows of only 10 managers that he spotted early on who could outperform the S&P 500 over the long term, and they did so. He acknowledged there are more out there who may be able to beat the market, but they are the clear exception. 
"Further complicating the search for the rare high-fee manager who is worth his or her pay is the fact that some investment professionals, just as some amateurs, will be lucky over short periods," Buffett wrote.
"If 1,000 managers make a market prediction at the beginning of a year, it's very likely that the calls of at least one will be correct for nine consecutive years. Of course, 1,000 monkeys would be just as likely to produce a seemingly all-wise prophet. But there would remain a difference: The lucky monkey would not find people standing in line to invest with him."
The billionaire heaped praise on Jack Bogle, the founder of the Vanguard Group who started the first index fund 40 years ago.
"If a statue is ever erected to honor the person who has done the most for American investors, the hands down choice should be Jack Bogle," the letter stated. "In his early years, Jack was frequently mocked by the investment-management industry. Today, however, he has the satisfaction of knowing that he helped millions of investors realize far better returns on their savings than they otherwise would have earned."
"He is a hero to them and to me," Buffett added.


John Melloy | @johnmelloy
Saturday, 25 Feb 2017
CNBC.com

http://www.cnbc.com/2017/02/25/buffett-slams-wall-street-monkeys-says-hedge-funds-cost-100-billion.html

Wednesday, 22 March 2017

Why did Buffett buy Apple Inc. ( AAPL)? - A Cash Cow that turned 24.8% of its Revenues into Free Cash Flow for its Owners.

At the price of US 139.84 per share and with 5,500 million shares outstanding, Apple is priced by the market at a whopping US 769.12 Billion.

It is the company with the highest market capitalisation in a stock market in the world today.

Apple continues to innovate in its products and it is expected to deliver some new surprises in the future.

Despite some negative news in recent years, it has proven its critics wrong in growing its revenues, profit before tax and EPS share over the last 5 years.

The revenue growth showed consistency, however, the profit before tax and EPS were more volatile and less consistent, being affected by efficiency and costs leading to profit margins that were variable over the period.

Though its revenues had grown from US 156 billion in its FY 2012 to US 214 billion in its FY 2016, its net income grew from US 41.7 billion to US 45.7 billion over the same period.

Its profit before tax margins continued to be maintained at high levels of 28.6% and its latest ROE was 38.3%.

Apple started its share buybacks over the years and had reduced the number of shares outstanding from 6,617 million shares in 2012 to 5,500 million shares in 2016.

Due to its huge free cash flow generated yearly and its huge cash reserves, this share buyback should benefit the shareholders who are still holding to its shares.

Apple distributed little dividend in the past.  In 2012, its dividends were US 2.5 billion.  Since 2013, Apple had distributed dividends of US 10.6 billion, US 11.1 billion, US 11.6 billion and US 12.2 billion yearly to 2016.

Over these 5 years from 2013 to 2016, its dividend payout was a total of 22.1% of its earnings.

Apple still retains a lot of its earnings, some being used to buyback its own shares.

This company is a true cash cow.  Its FCF for the year ending Sept 2016 was US 53.1 billion on a revenue of US 214 billion.  This gave a FCF/Revenue of 24.8%.  A remarkably high and cash generating company.

At today's market capitalisation of US 769.12 billion (US 139.84 per share), its FCF to market cap yield is 6.89%.

At today's price of US 139.84 per share, and using the EPS of FY 2016 of US 8.31 per share, Apple is trading at a PE of 16.8x.

When Warren Buffett bought into Apple at the end of 2016, its share price was around US 110 per share.

At US 100 per share then, Warren Buffett bought into Apple which is a great company at a fair price.  At that price, the upside and downside were about even.  The dividend yield was 2.4% and the potential total upside return around 11.1% per year (2.4% from dividends and 8.7% from capital appreciation) for the next 5 years.

At US 139.84 today,  the upside is much less compared to the downside.  The dividend yield is 1.9% and the total projected potential return around 4,5 %per year (2.6% from dividends and 1.9% from capital appreciation) over the next 5 years.


Aeon Credit (22.3.2017)

The revenue, profit before tax and EPS continue to grow.

In its latest quarter, it grew its quarterly revenue 14% and its quarterly EPS 27.4% when compared to the previous year same quarter.

Its share price peaked at RM 18.86 per share in 2013.

Since then its share prices have been range bound between RM 10 to RM 15 per share.

Its EPS continued to grow at a good rate during the same period from 93.1 sen per share to 158.5 sen per share.

The rising EPS and the flat share prices over the last 3 years, resulted in Aeon Credit trading at very low PE of below 10.

At today's closing price of RM 16.60 per share, it is trading at a PE of 10.5.

This stock pays dividend over the years.  Its dividend payout ratio has been around 38%.

It has increased its dividends yearly over the years from 25 sen per share in 2012 to 59.5 sen per share in 2016 (more than double over this period).

At its present price of RM 16.60 per share, its dividend yield is 3.58%.

This dividend yield should appeal to those who are investing for income too.

Projecting into the future, Aeon Credit should continue to grow its revenues, profit before tax and EPS.

Those who own Aeon Credit for the long term should enjoy a satisfactory total return from its capital appreciation and its growing dividends.


Friday, 17 March 2017

Benjamin Graham's teachings on Market Fluctuations and your investing

Market Fluctuations

            Fluctuations of Common Stock Prices
Since common stocks are subject to wide price swings, the investor should seek to profit from these opportunities.  However, attempting to time the market usually ends in unsatisfactory results.  Graham believes that market timing is pure speculation and is not an investing activity.  The best an investor can do is the change the bond and stock proportions in his portfolio after major market swings. 
Formulas do not work, although they have been in vogue since the 1950s.  When the market reached new highs in the mid-1950s, many formula investors sold their equities according to formula only to witness the market grow increasingly higher.  Any approach to the market that is easily described is sure to fail (except for Graham’s method). 
The investor also can focus on the price of a security. Graham recommends this practice.  Short-term fluctuations should not matter.  Over a period of 5 years, the investor should not be surprised if the average value of his portfolio increases more than 50% from its low point or decreases 1/3 from its high point.
Market advances and declines tempt investors to make foolish decisions.  Varying the proportion of stocks and bonds between the 25%-75% ratio occupies an investor’s time during turbulent markets and prevents him from making gross errors in judgement.  The true investor takes comfort that his actions are opposite from the actions of the crowd.
The better a firm’s record and its prospects, the less relationship that its price will have to its book value.  The more successful the company, the more likely its share price is to fluctuate.  More often than not, a fast growing firm’s market price will exceed its intrinsic value.  So, the better the quality of the stock, the more speculative it will be.  This explains the erratic price behavior of some of the most successful and impressive enterprises, such as IBM and Xerox.
The investor should purchase issues close to their tangible asset values and at no more than 33% above that figure.  These purchases logically are related to a company’s balance sheet and not to its earnings.  Any premium over book value may be thought of as a fee for liquidity that accompanies any publicly traded stock.   
            Just because a stock sells at or below its net asset value does not warrant that it is a sound purchase.  In addition to below market values, the investor also must demand a strong financial position, a satisfactory p/e ratio, and an assurance that the firm’s earnings will be sustained over the years.  This is not an entirely difficult bill to fill except under dangerously high market conditions.  At the end of 1970 more than half of the DJIA met these investment criteria.  However, the investor will forgo the most brilliant, high growth prospects.
            With a portfolio purchased at close to book value, the investor can take a more detached view of market fluctuations.  In fact, so long as the earning power of the portfolio remains satisfactory, the investor can use these market vagaries to buy low and sell high.
As seen with the stock fluctuations of A & P over many years, the market often goes wrong.  Although the stock market may fall, a true investor is rarely forced to sell his shares.  Rather, the investor is free to disregard the market quotes.  Thus, the investor who allows himself to be unduly worried about the market transforms his basic advantage into a disadvantage.  In fact, the investor who owns common stock owns a piece of these companies as a private owner would, and a private owner would not sell his business when it is undervalued by the market.  A quoted stock provides an option for the investor to sell at a given price and nothing more.  The investor with a diversified portfolio of good stocks should neither worry about sizeable declines nor become excited about sizeable advances.   An investor never should sell a stock just because it has gone down or purchase it because it has gone up.
Graham provides the parable of “Mr. Market”, who like the stock market, quotes you a price for your shares each and every day.  Mr. Market will either buy your shares or sell you his.  The price will depend upon Mr. Market’s mood.  You can ignore his efforts, or you can take advantage of him when he quotes you a price that you believe is priced advantageously.  Finally, one should not forget the effect of management on a firm’s results.  Good management produces acceptable results and bad management does not.

Fluctuation of Bond Prices
            Short-term bonds, defined as those with a duration of less than 7 years, are not significantly affected by changes in the market.  This applies to US Savings Bonds, which can be redeemed at anytime.  Long term bonds, however, may experience wide price swings as a result of fluctuations in the interest rate.  Thus, long term bonds may seem attractive when discounted, but this practice often leads to speculation and losses.
Low yields correspond with high bond prices and vice versa; prices and yields are inversely related.  The period from 1960 to 1975 is marked by reversing swings in the price of bonds so much so that it reminded Graham of Newton’s law: “every action has an opposite and equal reaction.”  Of course, nothing on Wall Street actually occurs the same way twice. 
Graham acknowledges the impossibility of attempting to predict bond prices, even if common stock prices were predictable.  Therefore, the investor must choose between long- term and short-term bonds chiefly on the basis of personal preference.  If the investor wishes to ensure that his market values will not decrease, then the investor is best served by US Savings Bonds.  With higher yield long term bonds, the investor must be prepared to see their market values fluctuate. 
Convertible issues should be avoided.  Their prices fluctuate widely and unpredictably based upon the price of the underlying common stock, the credit standing of the firm, and the market interest rate.  Because convertible issues experience huge swings in market value, they are largely speculative investments.