Investing is simple but not easy.
It is
important to have a strong philosophy, strategy and method. Stay discipline.
Stock
Selection
Just follow
the teachings of Charlie Munger and Warren Buffett. They teach their 4 tenets:
Their focus
is on great businesses with strong economic moats managed by honest managers
bought at fair or undervalued prices. Their
teaching is so simple, and they are surprised not many follow their investing
style.
Invest for
the long term. Also reinvest all
dividends and returns for the long term.
Why long-term? The power of
compounding is truly magical and this is especially so after a long period of
investing.
Only invest the money that you do not need to use in the short term, e.g., the next 5 years. This is to avoid you having to sell to raise cash for emergency use at the time when the market prices may not be favourable for you. You should have a sum of money set aside for emergency use.
Portfolio
Management
Monitor the business of the companies you own. Keep track of their quarterly results. Read the news that are relevant to your companies. This will not take up a lot of your time.
In general,
for the majority of the well selected stocks, you can hold for the long
term.
There maybe
an uncommon occasion when a particular stock need to be sold urgently due to
permanent deterioration of its business or fraudulent accounting (dishonest management).
Sell early.
Sometimes,
a stock has risen to a very high price.
Yes, you may wish to sell some or all of the stock. Yet, if you choose not to sell, it is also
alright too, especially if you are holding the selected great company for the long term. You may find that in a few years, the stock
may have risen to new high prices.
Very occasionally, you
have identified a fantastic new great investment with very high upside and low
downside relative to your present stocks in your portfolio and which you wish to put in a lot of capital. You may wish to
sell some preexisting stocks in your portfolio to redeploy into this new investment.
Sell and replace your losers and underperformers, let the winners run.
These strategies ensure that your portfolio is high quality and well managed optimally, to meet your investing objectives.
Investing
style of Peter Lynch
Yes, Peter
Lynch is a great investor and teacher, and you can benefit from employing his
methods too: cyclical plays, asset plays
and turnarounds.
You have to think
differently from the crowd. Get in ahead
of the smart investors (institutions) and the herd. By the time they spotted these and repricing
comes around, you are ready to cash out.
[GCB, Hai-O, APM, KAF, and others were among these types of stocks that have been rewarding in the past. ]
How many
stocks are investable for the long term in the stock market?
Around 2%. That is, in Bursa, just around 20 stocks. You just need 7 to 10 stocks in your portfolio and you are well diversified. Focus investing. Invest a meaningful amount into each stock.
Worldwide, there are about 36,000 stocks. Only 900 are investable, that is, 25 out of 1,000 are investable for the long term.
Speculation
/ Intelligent speculation / Short term trading
For those
who must play, ensure you set aside a sum of money separate from your long-term
investing for the above purpose and most importantly, never add more money to
this activity. This is to avoid
permanent harm to your financial health.
Majority of players historically lose money in these activities.
Stay
within your circle of competence
Very
important to know the company you invest into.
Must know the boundary of your own circle of competence and never stray
outside it. Keep educating and learning.
Know
yourself
Know yourself.
Keep
your investing simple and safe (KISS).
You do not need to spend excessive amount of time analysing a company if you have a well defined philosophy, strategy and method. Use check lists.
Organise the analysis of the stock in the format you like. Better still, seek out the sites where the information are available in the format you like: pay if you must.
20% of the time spent provides
you 80% of the information on the company.
Be disciplined. Be smart.
Be
decisive
When the
opportunity presents, and with your right preparations and knowledge, have the
courage to act. Be decisive.
Happy
investing for the long term. Yes, you
also need a bit of luck .. just a wee bit.
😊
A currency’s strength is determined by the interaction of a variety of local and international factors such as the demand and supply in the ; the of the central bank; the inflation and growth in the domestic economy; and the country’s . Taking all factors into consideration, the currency strength can be evaluated in three dimensions:
As the local production activities add further value to the country’s economy, higher purchasing power encourages spending. The surge in the supply and demand stimulates import and export, flourishing the international trade volumes.
The national currency gains utility in the trade-partner countries, which, in turn, drive their central banks to create reserves for it. Such acceptability enables commerce via a direct exchange of currencies without the mediation of a stronger currency like the U.S. Dollar.
It also provides room for manoeuvre in case a trading partner’s currency value fluctuates due to external circumstances. As a result, the national currency strengthens in the money markets and gains value in the Forex pairs.
The U.S. Dollar is currently considered as the strongest currency in the world. The U.S. economy has the largest consumer market, and the USD serves as the primary trade and reserve currency all around the globe.
Around 60% of the world’s central bank reserves, 40% of debt, 90% of , and 80% of global trade is denominated in dollars. When the world experiences a crisis, everyone looks to the U.S dollar as a shelter from risks. However, many countries and foreign companies borrow in U.S dollars and earn revenue or taxes in their domestic currencies, therefore dollar strength increases default risk.
https://www.avatrade.com/education/trading-for-beginners/currency-strength#:~:text=A%20currency's%20strength%20is%20determined,the%20country's%20balance%20of%20trade
Company X is a private limited company that owns a lot of assets. It owns plantations, factories, shop houses and various businesses. Its net book value is very high. If it can sell off everything at the fair market price, it should be worth a lot of money.
It has many shareholders. Many are from the same related brothers and sisters. There are also many outsiders who own shares in the company.
The company makes good profit every year and is cash rich. It is well managed. It chooses to distribute a small portion of the yearly profits as dividends and retains the major portion as cash which is kept in the bank. Every year its net book value increases due to its retained earnings. The shareholders get their dividends without fail, though these have not increased through the years, despite the company earnings having improved over the period.
The management remains sound and those in control of the management and the directors enjoy their fees for their services, which are fair and reasonable.
The company continues to grow its assets and earnings over the years. Its assets, which are land, properties and businesses have appreciated a lot over the very many years.
Alas, some shareholders wish to cash out. Who are the buyers? Yes, some of the shareholders are still accumulating the shares in the company regularly. There are also many who also are not willing to buy, not because the company is not good and also not because it is overvalued. They do not wish to tie their money up in the company as they cannot see how they will be rewarded in the coming years. Except for the dividends received yearly, which weren't much when you compared with the yields from the risk free fixed deposit rates, they just cannot see how they can cash out of this company at a fair price. The buyers have indicated that they are always available for those who wish to cash out, but the price offered is about half that of the net book value. This state of affair existed for many years and continues till today.
Are there similarities we can observe in some of the listed companies who are deemed value traps too?
| ||||||||||||||||||||||||||||||||||||||||||||||||||||||||||||||||||||||||||||||||||||||||||||||||||||||||||||||||||||||||||||||||||||||||||||||||||||||||||||||||||||||||||||||||||||||||||||||||||||||||||||||||||||||||||||

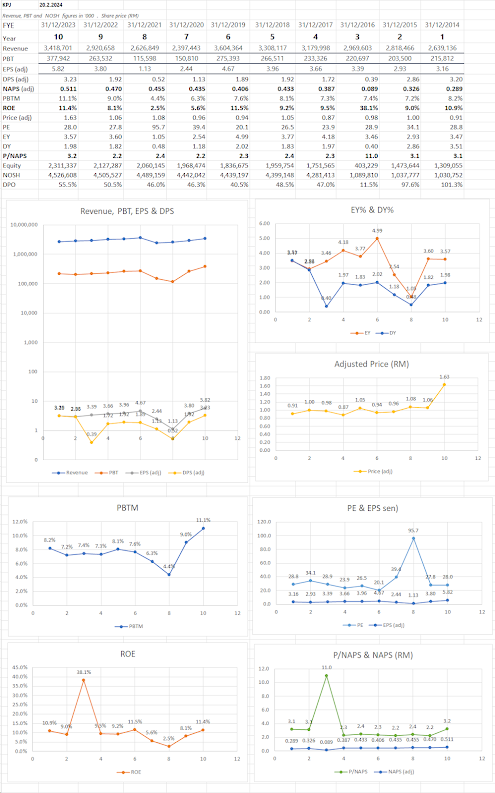
Petronas Dagangan
Dividends (sens) per share received each year:
2014 55.50
2015 62.00
2016 62.00
2017 78.00
2018 94.00
2019 70.00
2020 61.00
2021 40.00
2022 40.00
2023 NA
Year end share price of PBB
Year 2013 RM 31.44
Year 2018 RM 26.50
Year 2023 RM 23.00
Returns to shareholders of Petdag
10 year period from end of 2013 to end of 2023
Capital depreciation = RM 23.00 - RM 31.44 = - RM 8.44
Total dividends received = RM 5.625
Total loss = - RM 8.44 + RM 5.625 = - RM 2.815
Loss % = - RM 2.815 / RM 31.44 = - 8.95%
The loss of capital was attenuated by the dividends received over the last 10 years.
5 year period from end of 2018 to end of 2023
Capital loss = RM 23.00 - RM 26.50 = - RM 3.50
Total dividends received = RM 2.11
Total loss = - RM 3.50 + RM 2.11 = - RM 1.39
Gain % = - RM 1.39 / RM 26.50 = - 5.24%
The loss of capital was attenuated by the dividends received over the last 5 years.
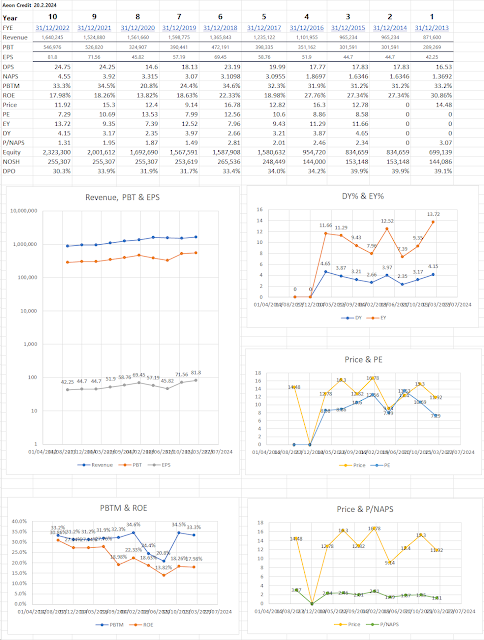
Public Bank Berhad
Dividends (sens) per share received each year:
2014 10.41
2015 11.00
2016 11.60
2017 11.80
2018 13.20
2019 14.00
2020 8.00
2021 20.50
2022 19.70
2023 14.00
Year end share price of PBB
Year 2013 RM 3.76
Year 2018 RM 4.95
Year 2023 RM 4.25
Returns to shareholders of PBB
10 year period from end of 2013 to end of 2023
Capital appreciation = RM 4.25 - RM 3.76 = RM 0.49
Total dividends received = RM 1.34
Total gains = RM 0.49 + RM 1.34 = RM 1.83
Gain % = RM 1.83 / RM 3.76 = 48.7%
Dividends provided the bulk of the returns to shareholders over the last 10 years.
5 year period from end of 2018 to end of 2023
Capital loss = RM 4.25 - RM 4.95 = - RM 0.70
Total dividends received = RM 0.762
Total gain = - RM 0.70 + RM 0.762 = RM 0.062
Gain % = RM 0.062 / RM 4.95 = 1.25%
The loss of capital was attenuated by the dividends received over the last 5 years.