Thursday 31 January 2019

Understanting Risk Aversion

Risk aversion- Various Definitions

Description: In economics and finance, risk aversion is the behavior of humans, who, when exposed to uncertainty, attempt to lower that uncertainty. It is the hesitation of a person to agree to a situation with an unknown payoff rather than another situation with a more predictable payoff but possibly lower expected payoff.

Definition: A risk averse investor is an investor who prefers lower returns with known risks rather than higher returns with unknown risks. In other words, among various investments giving the same return with different level of risks, this investor always prefers the alternative with least interest.

What is Risk Averse: Risk averse is the description of an investor who, when faced with two investments with a similar expected return, prefers the one with the lower risk.

Risk Averse: A risk-averse investor dislikes risk and, therefore, stays away from high-risk stocks or investments and is prepared to forego higher rates of return. Investors who are looking for "safer" investments typically invest in savings accounts, bonds, dividend growth stocks and certificates of deposit (CDs).

Description: A risk averse investor avoids risks. S/he stays away from high-risk investments and prefers investments which provide a sure shot return. Such investors like to invest in government bonds, debentures and index funds.


What is Risk Averse?

Someone who is risk averse has the characteristic or trait of preferring to avoiding loss over making a gain. This characteristic is usually attached to investors or market participants who prefer investments with lower returns and relatively known risks over investments with potentially higher returns but also with higher uncertainty and more risk. A common concept tied to risk, one which compares thee risk level of an individual investment or portfolio to the overall risk level in the stock market, is the concept of beta.


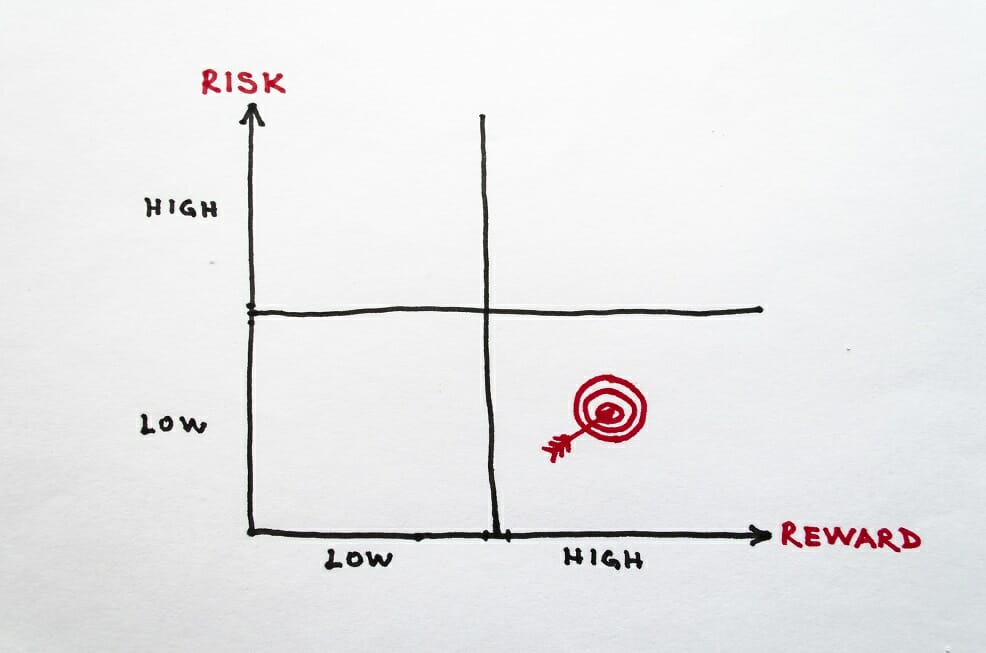
Risk Averse definition and chart


Types of Investments Risk Averse Investors Choose

A risk averse investor tends to avoid relatively higher risk investments such as stocks, options, and futures. They prefer to stick with investments with guaranteed returns and lower-to-no risk. These investments include, for example, government bonds and Treasury bills. Below are two lists that classify lower and higher risk investments. Keep in mind that while the relative risk levels of various types of investments generally remain constant, there can be situations where a usually low-risk investment has a higher risk, or vice versa.


Safer, low-risk investments
Bonds
Certificates of Deposit
Treasury securities
Life Insurance
Investment Grade Corporate Bonds
Bullet Loans
ETFs*

In addition to these specific investments, any type of debt instrument issued by a company will generally be considered a safe, low-risk investment. These debt instruments are typically well-suited for a risk averse investing strategy.

These instruments are lower risk at least partly due to their characteristic of absolute priority. In the event of dissolution or bankruptcy of a company, there is a definite order of payback to the company’s creditors and investors. Legally, the company must first pay of debtors before paying off preferred shareholders and common shareholders (equity investors).


Higher risk investments
Stocks
Penny Stocks
Mutual Funds
Financial Derivatives (Options, warrant, futures)
Commodities
ETFs*


*Some ETFs are higher risk, but most ETFs, especially those invested in market indexes, are considered quite safe, especially when compared to investments in individual stocks. This is because they typically experience relatively lower volatility, due to their diversified nature. Keep in mind, however, that some ETFs are invested in significantly higher risk securities. Hence, the inclusion of ETFs in both the low and high risk categories.

Wednesday 30 January 2019

General Portfolio Policy (Benjamin Graham)

General Portfolio Policy: The Defensive Investor

Graham opens the chapter defining two different kinds of investors: the “active” investor, which is the kind of investor that actively seeks new investments and invests serious time into studying investments, and the “passive” or “defensive” investor, the kind of investor that wants to invest once (or on a highly regular basis) and just let his or her portfolio run on autopilot.
Regardless of the activity that you apply to your investments, Graham sticks hard with his recommendation from the earlier chapter: 50% stocks, 50% bonds (or a close approximation thereof, with an absolute maximum of 75% in either side). It’s important to remember with a recommendation like that that Graham is very conservative in his investing, dreading the idea of an actual loss in capital. Only in the most dire of down markets (like 2008, for example) would such a portfolio actually deliver a loss to the investor.

Things that enterprising investors should focus on. (Benjamin Graham) 2

Portfolio Policy for the Enterprising Investor: The Positive Side

Graham says that there are four clear areas of activity that an enterprising investor (read: not an ultra-conservative investor) should focus on:
1. Buying in low markets and selling in high markets.
Graham says, in essence, that this is a good strategy in theory, but that it’s essentially impossible to accurately predict (on a mathematical basis) when the market is truly “low” and when it’s truly “high.” Why? Graham says that there’s inadequate data available to be able to accurately predict such situations – he basically believes fifty years of data is needed to make such claims, and as of the book’s writing, he did not believe adequate data was available in the post-1949 modern era. 
2. Buying carefully chosen “growth stocks.”
What about growth stocks – ones that are clearly showing rampant growth? Graham isn’t opposed to buying these, but says that one should look for growth stocks that have a reasonable P/E ratio. He wouldn’t buy a “growth stock” if it had a price-to-earnings ratio higher than 20 over the last year and would avoid stocks that have a price-to-earnings ratio over 25 on average over the last several years. In short, this is a way to filter out “bubble” stocks (one where irrational exuberance is going on) when looking at growth stocks.
3. Buying bargain issues of various types.
Here, Graham finally gets around to the idea of buying so-called “value stocks.” For the most part, Graham focuses on market conditions as they existed in 1959, pointing towards what would constitute value stocks then. A brief bit on page 169, Graham discusses “filtering” the stocks listed by Standard and Poor’s (essentially a 1950s precursor to the S&P 500) and identifying 85 stocks that meet basic value criteria, then buying them and finding that, over the next two years, most of them beat the overall market.
That’s an index fund. Graham had basically conceived of the idea in the 1950s – it worked then, and it works now.
4. Buying into “special situations.”
Graham largely suggests avoiding “topical” news as a reason to buy or sell, mostly because it’s hard for investors to gauge how exactly such news will truly affect the stock’s price. Instead, one should simply file away interesting long-term news for later use if you’re going to evaluate the stock. For example, recalling that a company is still paying off an incurred debt from ten years ago and that debt is about to be paid off might be an indication of an upcoming jump in profit for the company – and a possible sign of a good value.

Things that enterprising investors should focus on. (Benjamin Graham) 1

Ben Graham has a lot of ideas about what you should avoid.  Defensive investors should avoid everything but large, prominent companies with a long history of paying dividends. Even enterprising investors should avoid junk bonds, foreign bonds, preferred stocks, and IPOs.
To put it simply, Graham doesn’t like risk. It comes through time and time again in every chapter of the book – do the footwork, minimize risk, and don’t swing for the fences.
So what kind of real-world investing does that lead to? Graham finally gets down to actual tactics here, finally pointing toward some specific investment choices that he actually supports! At last!

Things that even enterprising investors should avoid. (Benjamin Graham) 2

Portfolio Policy for the Enterprising Investor: Negative Approach


So, what should you avoid?
First, avoid junk bonds. If they have anything less than a stellar bond rating, don’t bother, even if they appear to return very well. Junk bonds put your principal at risk, and the point of buying bonds is to have a safe portion of your portfolio.
Second, avoid foreign bonds. Here, there are stability issues, and it’s often hard to adequately judge the risk of buying bonds from government and private entities operating under rules unfamiliar to you. 
Third, avoid preferred stocks. Preferred stocks are ones that have a higher priority in the event of a liquidation of the business, but often come at a premium price. Almost always, Graham doesn’t feel these are worth any sort of premium. Of course, in the United States, preferred stock is generally not sold directly to individual investors, only to large institutions, so it’s largely a moot point.
Finally, avoid IPOs. To put it simply, new issues do not have any track record upon which to adequately judge the company. The “hype” of an IPO is all you really have to judge the issue on. Instead, let others jump into that feeding frenzy and wait until time has shown which companies swim and which ones sink.
Those are some good rules for anyone to follow, particularly if you’re concerned about not losing the money you invest. Most of these investments have a pretty significant amount of risk and in Graham’s world, one shouldn’t put the principal at undue risk.

Things that even enterprising investors should avoid. (Benjamin Graham) 1

Graham’s view of a conservative investor is very conservative. Focus primarily on big, blue chip stocks that pay a dividend and counterbalance that with roughly an equal amount of bonds. Very conservative, indeed.

But what about those of us who are less conservative and want to seek out other investments? After all, isn’t The Intelligent Investor supposed to be a guide to value investing, not just “buy blue chips and wait”?

Graham starts to head down this path here as he turns his sights from the very conservative investor to the … less conservative investor, the type of person who would actually follow value investing principles and seek out investments that show every sign of being undervalued – and then invest in them.

But first, a chapter of cautionary advice. Graham is nothing if not cautious, after all. The focus here is on things that even enterprising investors should avoid.

The Defensive Investor and Common Stocks (Benjamin Graham)

The Defensive Investor and Common Stocks
Graham’s advice, tends to focus on people who are willing to put in that extra time – and if you’re willing to do that, he has a lot of wisdom to share.
First of all, diversify. You should own at least ten different stocks, but more than thirty might be a mistake, as it becomes difficult to follow all of them carefully and also seek out new potential stock investments.
Second, invest in only large, prominent, and conservatively financed companies. Look for ones with little debt on the books and ones with a large market capitalization.
Third, invest only in companies with a long history of paying dividends. If a company rarely pays dividends, your only way to earn money from that company is if the market deems the stock to be valuable, and you shouldn’t trust that the market will do so.
Graham seems to point strongly towards the thirty stocks that make up the Dow Jones Industrial Average as a good place to start looking, as they usually match all of these criteria. I’d personally stretch that to include stocks that make up the S&P 500, but the Dow is a great place to find very large blue chip companies that are very stable and have paid dividends for a long time.
Other than that, Graham pooh-poohs many other common strategies. Buying growth stocks? Nope. Dollar-cost averaging? Good in theory, not great in practice. Portfolio adjustments? Be very, very careful – and only do annual evaluations. In short, be very, very wary and play it very, very cool.
Remember, this is Graham’s advice for the defensive, very conservative investor.

Strong, thorough research is the most important part about owning stocks. (Benjamin Graham)

The Intelligent Investor by Benjamin Graham


There’s one big underlying theme to this book. Yet, it keeps coming to the forefront again and again. It’s the one point that I believe Graham wants people to take home from this book.
Strong, thorough research is the most important part about owning stocks.
If you can’t – or aren’t willing to – put in a lot of time studying individual stocks, identifying ones that genuinely have potential to return good value to you over time, and keep careful tabs on those individual stocks, then you shouldn’t be investing in stocks.
Over and over again, Graham makes this point, in both obvious and subtle ways. He’s a strong, strong believer in knowing the company. If you don’t have clear, concrete reasons for buying a stock, then you shouldn’t be buying that stock, period.
What if you don’t have that time? This book was written before the advent of index funds, but I tend to think that broad-based index funds can be a reasonable replacement for the stock portion of your portfolio.

Monday 28 January 2019

Advantages of Long Term Investing into Growth Stocks


Advantages of Long Term Investing into Growth Stocks

80% Success with Stock Selection
15% Annual Portfolio Return
Simple Procedures
Carefree Portfolio Maintenance


KISS Investing (Kiss It Simple and Safe)

1. You buy a company earning $1 per share ($1 EPS)

2. You buy that share for 20 X EPS ($1.00) = $20.00

3. The company grows earnings to $2 per share (EPS = $2)

4. You still sell it for 20 X EPS (20 X $2 =$40)

5. It's worth $40 and your money has doubled!

That's the secret.


The Two Most Important Tests of a Company's Value

1. What is the potential reward?

2. How much risk must I take to obtain it?


The Only Two Times You Should Sell a Stock

1. You want or need the money.

2. The company fails to perform as you predicted.

"Fails to perform as you predicted" means the quality deteriorates or the return potential deteriorates.

You hold a quality stock until you want or need the money unless the quality or potential return deteriorates.

Approximately one in five of the stocks you pick will develop unforeseen problems and need to be sold.


The Two Strategies of Portfolio Management

1. Defense - Has the quality deteriorated?

2. Offense - Has the return potential deteriorated?

Defensive portfolio management deals with making sure the growth you found and forecast is actually occuring. There will always be short term interuptions in growth which result in buying opportunities, but stocks with long term, serious problems must be caught early and delt with decisively by selling them.

Offensive portfolio management deals with grossly overvalued situations and is less urgent to pursue. Here your focus is to capture excess profit when a stock temporarily becomes overvalued by REPLACING it with another stock of equal or grater quality and greater return potential.

Missing a defensive portfolio management problem can result in serious harm to the return of your portfolio, whereas missing an offensive portfolio management problem only results in a little lost extra profit. You'll still own a quality stock.


Speculation vs. Investing

The difference between a speculator or day-trader and an investor.


A graph shows several years of weekly high - low price changes for a company that has been steadily growing its sales and earnings.

There was a lot of price fluctuations on a week to week basis, but the trend was clear. The price went up over the long term. Price follows earnings.

Speculators or day-traders try to predict the short term price directions and prosper by buying low and selling high. They don't need growth stocks. Long term investors do.

Long term investors use strategies to find these growth stocks and then pick purchase entry points and ride the long term upward trend in price.

Aeon Credit - Understanding its business.

Aeon Credit operates in the financing industry in the following segments:

1. Vehicle Easy Payment (VEP) segment (main segment)
-Motorcycle easy payment (MEP)
-Car easy payment, mainly used cars (CEP)

2. Household appliances General Easy Payment (GEP)

3. Personal loans

4. Credit cards

5. Other incomes:
-Recoveries
-Fees from credit card processing
-Insurance fees
-Aeon Big loyalty program processing fees.


--------------------


Consumer sentiment could weigh on the business of the provider of mirco credit financing’s loan growth.

Aeon Credit’s loan growth will continue to be driven by its vehicle easy payment (VEP) segment which is the largest contribution to the group’s revenue.

The research firm noted Aeon Credit’s loan portfolio comprised primarily of VEP which made up more than half of the micro credit financing provider’s total loans.

Aeon Credit’s VEP include motorcycle easy payment (MEP) and car easy payment (CEP) mainly used cars.

Aeon Credit also provide financing for the purchase of household appliances under general easy payment (GEP), personal loans and credit cards.

Aeon Credit’s other income line include recoveries as well as fee income from credit card processing fees, insurance fees and Aeon Big loyalty programme processing fees.


-------------------

The parent AEON FINANCIAL SERVICES JAPAN owns 59.7% of the company.

They operate in the financing industry for automobile, motorcycles, general easy payment (GEP), credit and personal financing.

They collect an effective gross yield of
- 14% for automobile,
- 21% for personal financing,
- 27% for GEP and
- 21-27% for motorcycles.

This business is highly profitable as they are able to cater to the financing needs of households.


-----------------


Re: Aeon Credit
« April 23, 2016, 01:04:41 PM »


TA (Total Asset) = RM 6097.5 m


Rev/TA 15.8%
EBIT/TA 7.6%
Finance Cost/TA 2.7%
PBT/TA 4.9%
Tax/TA 1.2%
PAT/TA 3.7% :thumbsup: (Return on Total Assets)


Total Borrowings 4908.1
Cost of borrowings 3.3%


Total receivables 5394.9
Finance Cost/Total receivables 3.0%

http://www.investlah.com/forum/index.php/topic,75807.msg1477954.html#msg1477954


---------------------------


« September 28, 2018, 12:48:06 PM »

Ratios & Margins AEON Credit Service (M) Bhd
All values updated annually at fiscal year end


Valuation
P/E Ratio (TTM) 12.43
P/E Ratio (including extraordinary items) 13.07
Price to Book Ratio 2.18

EPS (recurring) 2.52
EPS (basic) 1.43
EPS (diluted) 1.38


Efficiency

Profitability
Gross Margin +70.72
Operating Margin +54.03
Pretax Margin +29.26
Net Margin +21.04

Return on Assets 3.82
Return on Equity 23.21
Return on Total Capital 10.13
Return on Invested Capital 5.09

Interest Coverage 3.24


KEY STOCK DATA
P/E Ratio (TTM) 12.38 (09/28/18)
EPS (TTM) RM1.31
Market Cap RM3.97 B
Shares Outstanding 249.74 M
Public Float 72.70 M
Yield 2.47% (09/28/18)
Latest Dividend RM0.20 (07/19/18)
Ex-Dividend Date 06/27/18


----------------------


http://www.investlah.com/forum/index.php/topic,52325.msg1016913.html#msg1016913

Aeon Credit versus LPI


----------------------


20.12.2018
ACSM - Quarterly Results for the Third Quarter ended 30.11.2018.pdf

Performance Review
The Company‟s revenue recorded 11.6% and 8.7% growth for the current quarter and nine months ended 30 November 2018 as compared with the previous year corresponding period. Total transaction and financing volume in the current quarter and nine months ended 30 November 2018 had increased by 49.5% to RM1.488 billion and by 26.4% to RM3.887 billion respectively as compared with the previous corresponding period ended 30 November 2017.

The gross financing receivables as at 30 November 2018 was RM8.313 billion, representing an increase of 15.41% from RM7.203 billion as at 30 November 2017. The net financing receivables after impairment was RM7.737 billion as at 30 November 2018 as compared to RM7.034 billion as at 30 November 2017.

Nonperforming loans (NPL) ratio was 2.05% as at 30 November 2018 compared to 2.48% as at 30 November 2017.

Other income was recorded at RM27.999 million for the current quarter and RM105.574 million for the nine months ended 30 November 2018 respectively, mainly comprising bad debts recovered, commission income from sale of insurance products and loyalty programme processing fees.

Ratio of total operating expense against revenue was recorded at 55.6% for the current quarter as compared to 60.9% in the preceding corresponding period. The decrease is mainly due to increase in revenue.

The Company recorded a profit before tax of RM118.072 million for the current quarter and RM357.068 million for the nine months ended 30 November 2018, representing a growth of 23.9% and 21.9% respectively as compared with previous year corresponding period.

Funding cost for the current quarter was higher as compared to the preceding corresponding quarter mainly due to higher borrowings in line with the growth of receivables. The nominal value of borrowings as at 30 November 2018 was RM6.348 billion as compared to RM5.513 billion as at 30 November 2017.


--------------

How to read its accounts to understand its business.


Look at how much they have grown its financing receivables.

Here is how to study its accounts:

Interest income earned
less Interest costs incurred
less provision for loan losses
Net Interest income earned
Add Non interest (fees) income earned
Gross income
less Operating Expenditure
Profit Before Tax
less Tax
Profit After Tax

Reinvestment risk

An old post discussing reinvestment risks posted in May 16, 2017.  Data of Aeon Credit then was unadjusted for capital changes that have occurred since.


http://www.investlah.com/forum/index.php/topic,78077.msg1522231.html#msg1522231


Aeon Credit  May 16, 2017

FY                      HPr      LPr      adjDPS (sen)

28-Feb-17       18.06     12.94       63
29-Feb-16       15.62     11.92       63.23
20-Feb-15       14.86     11.00       28.22
20-Feb-14       18.00     10.30       46.3
20-Feb-13       18.86     10.38       32.15
20-Feb-12       13.72       5.50      25
20-Feb-11         5.75       3.09      22.08
20-Feb-10         3.48       3.02      18.75


 May 16, 2017
The price of Aeon Credit peaked in 2013. After then, it went on a decline.

I remembered discussing this company with fellow forum participant, cockcroach (who has since disappeared, hopefully temporarily).

Cockcroach sold his Aeon Credit around 16.00 per share.#


After selling a share at a certain price, when can we say we have made a profit from the sale?

For those who are long term invested into stocks, what do they do with the cash from the sale?

1. By selling a share at a certain price, have I made a profit?

Yes, since I bought the stock at a lower price in the past.

No, since I bought the stock at a higher price in the past.


2. What would you do with the cash from the sale?

I am out of the market, forever. In that case, you would have realised a gain or a loss, which is definite.

I am in the market for the long run. I would have to reinvest this cash into another stock or the same stock.


3. When would you have realised a gain, after selling a stock, if you were to be in the market for the long term?

I would have realised a gain, IF I am able to buy the same stock back at a lower price than I sold.

I would have realised a loss, IF I were to buy the same stock back at a higher price than I sold.

I would have also to take into account the dividends I did not receive (if any) while I was holding cash and out of the stock for that period.


4. Can you predict the short term volatility of the share prices of your stock?

I believe I cannot. Those who can, are either having uncanny abilities or are lying.


AEONCR November 03, 2017
Price 14.30
Market Capital (RM): 3.536b
Number of Share: 247.25m
EPS (cent): 119.03 *
P/E Ratio: 12.01
ROE (%): 24.54
Dividend (cent): 63.000 ^
Dividend Yield (%): 4.41
Dividend Policy (%): 0
NTA (RM): 4.850
Par Value (RM): 0.500

Price of 14.30 above is equivalent to 14.10 today when adjusted for capital changes.


AEONCR 27.1.2019
Price 15.98
Market Capital (RM): 4.007b
Number of Share: 250.78m
EPS (cent): 139.29 *
P/E Ratio: 11.47
ROE (%): 24.61
Dividend (cent): 41.130 ^
Dividend Yield (%): 2.57
Dividend Policy (%): 0
NTA (RM): 5.660
Par Value (RM): 0.500


Since Nov 2017, the share price of Aeon Credit has gained 13.3% (15.98/14/10 = 113%), excluding dividends received.


#(16.00 per share is equivalent to 15.78 per share today, adjusted for capital changes.)

Sunday 20 January 2019

Regret Theory


Fear of regret, or simply regret theory deals with the emotional reaction people experience after realizing they've made an error in judgment.

Faced with the prospect of selling a stock, investors become emotionally affected by the price at which they purchased the stock.

  • So, they avoid selling it as a way to avoid the regret of having made a bad investment, as well as the embarrassment of reporting a loss.  We all hate to be wrong, don't we?

What investors should really ask themselves when contemplating selling a stock is:
"What are the consequences of repeating the same purchase if this security were already liquidated and would I invest in it again?"

  • If the answer is "no," it's time to sell; otherwise, the result is regret of buying a losing stock and the regret of not selling when it became clear that a poor investment decision was made – and a vicious cycle ensues where avoiding regret leads to more regret.

  • Regret theory can also hold true for investors when they discover that a stock they had only considered buying has increased in value.


Some investors avoid the possibility of feeling this regret by following the conventional wisdom and buying only stocks that everyone else is buying, rationalizing their decision with "everyone else is doing it."

  • Oddly enough, many people feel much less embarrassed about losing money on a popular stock that half the world owns than about losing money on an unknown or unpopular stock.

Friday 11 January 2019

Growth versus Value: Why invest unless you see value?

Growth companies are those that are growing sales and earnings every year. 

Value companies are trading at low prices. These low prices are usually the result of tough times at the company but occasionally just because the market's a weird place. 

Often, the best growth investments are smaller companies. 

The best value plays are usually large companies. Not always, but most of the time. 


Growth companies: 

The PEs of growth companies tend to fluctuate hugely. When the growth slowed or the companies hit a rough patch, the shares of growth companies can fall by a large amount. 

  • Can you spot these companies in the early stages of their growth paths? 


Value companies: 

Large good companies were selling at bargain prices during the recent global financial crisis in 2008/2009. These companies are "safe" to buy during these periods when they are undervalued. They usually will rebound during recovery of the market. Some companies met some headwind or rough patch during their financial year and their share prices were sold down hugely, offering bargain prices for the savvy investors. 

  • Did you spot the values in these times in these stocks? 
  • Did you seize these opportunities or were you seized by fear of loss and the unknown? 


The division between growth and value companies is not always clear-cut. 

  • Many can also be classified as stocks that have business growth selling at reasonable prices (GARP). 
  • Another phenomenon to note is that investors tend to invest into value companies when they also starting to show some growth in their business. 
  • Similarly, investors buy into growth companies at the point when they are starting to show some value. :-) 


Therefore, growth and value investing are basically two sides of the same coin. They are joined at the hip, according to Buffett. 


Above all else, why invest unless you see value in either?

"Gentlemen who prefer bonds don't know what they've missing."

Theoretically, it makes no sense to put any money into bonds, even if you do need income.


Take the case of a asset allocation of 50 percent of the money invested in stocks that grow at 8% and 50 percent in bonds that don't appreciate at all, the combined portfolio had a growth rate of 4 percent - barely enough to keep up with inflation.

What would happen if we adjusted the mix?

By owning more stocks and fewer bonds, you would sacrifice some current income in the first few years.  But this short-term sacrifice would be more than made up for by the long-term increase in the value of the stocks, as well as by the increases in dividends from those stocks.  

Since dividends continue to grow, eventually a portfolio of stocks will produce more income than a fixed yield from a portfolio of bonds. 

Peter Lynch


Additional notes:


1.  Once and for all, we have put to rest the last remaining justification for preferring bonds to stocks - that you can't afford the loss in income.
2.  But here again, the fear factor comes into play.
3.  Stock prices do not go up in orderly fashion, 8 percent a year.  Many years, they even go down.
4.  The person who uses stocks as substitute for bonds not only must ride out the periodic corrections, but also must be prepared to sell shares, sometimes at depressed prices, when he or she dips into capital to supplement the dividend.
5.  This is especially difficult in the early stages, when a setback for stocks could cause the value of the portfolio to drop below the price you paid for it.
6.  People continue to worry that the minute they commit to stocks, another BIG ONE will wipe out their capital, which they can't afford to lose.
7.  This is the worry that will keep you in bonds, even after you've studied and are convinced of the long-range wisdom of committing 100% of your money to stocks.


Let's assume, that the day after you've bought all your stocks, the market has a major correction and your portfolio loses 25% of its value overnight.
1.  You berate yourself for gambling away the family nest egg, but as long as you don't sell, you're still better off than if you had bought a bond.
2.  Computer run simulation shows that 20 years later, your portfolio will be worth $185,350 or nearly double the value of your erstwhile $100,000 bond.

Or, let's imagine an even worse case:  a severe recession that lasts 20 years, when instead of dividends and stock prices increasing at the normal 8 percent rate, they do only half that well.
1.  This would be the most prolonged disaster in modern finance.
2.  But, if you stuck with the all-stock portfolio, taking out your $7,000 a year, in the end you'd have $100,000.  This still equals owning a $100,000 bond.

Ref:  Pg 55 Beating the Street, by Peter Lynch.


FOR YOUR IMMEDIATE ACTION!!!

1.  TALK YOURSELF OUT OF OWNING ANY BONDS.
2.  AT LEAST, YOU SHOULD DECIDE TO INCREASE THE PERCENTAGE OF ASSETS INVESTED IN STOCKS, WHICH IS A STEP IN THE RIGHT DIRECTION.

Sunday 6 January 2019

How does the bear market affect my investments?


Generally, a bear market will cause the securities you already own to become undervalued. The decline in their value may be sudden, or it may be prolonged over the course of time, but the end result is the same: What you already own is worth less [according to the market.] 


This leads to two fundamental truths: 
1.) A bear market is only bad if you plan on selling your stock or need your money immediately. 
2.) Falling stock prices and depressed markets are the friends of the long-term investor. 

In other words, if you invest with the intent to hold your investments for years down the road, a bear market is a great opportunity to buy. [It always amazes me that the "experts" advocate selling after the market has fallen. The time to sell was before your stocks lost value. If they know everything about your money, why they didn't warn you the crash was coming in the first place?] 


So what do I do with my money in a bear market? 

The first thing you need to do is to look for companies and funds that are going to be fine ten or twenty years down the road. If the market crashed tomorrow and caused Gillette's stock price to fall 30%, people are still going to buy razors. The basics of the business haven't changed. 


This proves the third fundamental truth of the market: 

3.) You must learn to separate the stock price from the underlying business. They have very little to do with each other over the short-term. 

When you understand this, you will see falling stock markets like a clearance sale at your favorite furniture store... load up on it while you can, because before long, the prices will go back up to normal levels.

This Expert Called the Market Plunge. Here’s What He Sees in 2019.

This Expert Called the Market Plunge. Here’s What He Sees in 2019.

The New York Stock Exchange last month, the worst December for stocks since 1931. James Stack, president of InvesTech Research, is anticipating a bear market.CreditHiroko Masuike/The New York Times
Image
The New York Stock Exchange last month, the worst December for stocks since 1931. James Stack, president of InvesTech Research, is anticipating a bear market.CreditCreditHiroko Masuike/The New York Times
A year ago, in the wake of President Trump’s tax cut, euphoric investors pushed the Dow Jones industrial average past 25,000, a record. The Dow had just gained 25 percent in 2017, and the Nasdaq had leapt 28 percent. Volatility was so low that there wasn’t a single day in 2017 when the S&P 500 fluctuated more than 2 percent.
Not everyone was celebrating.
“If there are any certainties, one will be that this party will eventually come to an end,” James Stack, president of InvesTech Research, told me a year ago. “And when it ends, it will end badly, and with high volatility.”
Mr. Stack turned out to be right. He lowered his recommended asset allocation for United States stocks from 82 percent last January to 72 percent in September, when stocks hit new all-time highs. He urged investors to raise cash in October, and at the end of November he recommended an even more defensive posture — including putting money in a fund whose value would rise when stock prices dropped. That brought his recommended net exposure to stocks to just 55 percent, the lowest since the depths of the last bear market in early 2009.
Stocks plunged in December, posting their worst monthly loss since the financial crisis and the worst December since 1931 and the Great Depression.
ADVERTISEMENT

Yet most economic indicators are benign. Unemployment is an exceptionally low 3.7 percent. Wages are rising. Inflation remains below the Federal Reserve’s 2 percent target. The Fed raised rates a quarter point in December, citing “a very healthy economy.”
Given Mr. Stack’s track record last year, I reached out to him this week for his current views. Even though valuations have come down and macroeconomic indicators “have remained remarkably strong,” he said, he’s still defensive and hasn’t changed his bearish allocation. He believes that the worst isn’t over and that the Dow and S&P 500 will soon be down 20 percent from their peaks, retreating into a bear market. (The Nasdaq Composite and the Wilshire 2000 index of small-cap stocks are already there.)
And that was before a revenue warning from Apple sent markets into another steep fall on Thursday.
“A lesson from history is that the market leads the economy by a lot longer than investors realize,” Mr. Stack said. If the economy is headed toward recession, as the latest stock market declines suggest it may be, “we won’t see the first economic warning signs until the first three to five months” of 2019. Among the leading indicators he’s watching for signs of weakness are consumer confidence, housing starts and unemployment claims.
On Thursday, the Institute for Supply Management manufacturing index, a leading indicator of industrial activity, fell sharply. That suggests that “serious cracks” are starting to appear in the economy, Mr. Stack said.
ADVERTISEMENT
Mr. Stack is right that bear markets typically precede recessions by many months: CNBC calculated in 2016 that bear markets since World War II had begun on average about eight months before a recession. That means that if a bear market did begin after major indexes peaked last fall, a recession might not start until June or even later. Even then, recessions are often over before economic data confirms their existence.
That’s when bear markets are, in fact, followed by recessions, which often isn’t the case. As the economist Paul Samuelson famously said, “The stock market has forecast nine of the last five recessions.”
Since World War II, there have been 13 bear markets. They were followed within a year by a recession just seven times. As a predictor of recessions with just 54 percent accuracy, bear markets are little better than flipping a coin.
Indeed, Mr. Stack’s data show that two down years in a row are quite rare: There have been only four instances since 1928, suggesting that stocks may well be in positive territory by the end of 2019, even if a bear market does materialize in the meantime.
ADVERTISEMENT
Which is one reason the Wharton economist Jeremy Siegel told me that he’s bullish on the stock market this year. He predicts it could rise between 5 percent and 15 percent, even if there is an economic slowdown.
Stocks are much cheaper now than they were before the December sell-off. The ratio between stock prices and projected earnings for companies in the S&P 500 is about 17, down from over 19 a year ago and the lowest in the past five years.
[Stocks rose Friday after the release of a strong December jobs report and comments by the chairman of the Federal Reserve that the central bank would be flexible on raising interest rates this year.]
Mr. Stack, however, argued that in the event of an economic downturn — or even a significant slowdown — “those projected earnings will go out the window.”
ADVERTISEMENT
“I would not call today’s market undervalued,” he added.
Mr. Siegel bases his forecast of a market rally on the belief that the Fed will stop raising short-term interest rates. “I think the Fed got the message from the markets that it should not have hiked in December,” he said.
Mr. Stack, too, said he was surprised the Fed raised rates in December. “I think the Fed will stand down and put future rate increases on hold,” he said, “which could stabilize the market, at least for the time being.”
But Mr. Stack’s technical indicators are still pointing toward a bear market. He’s also worried about the shaky housing market, with price drops and slowing sales showing up in major cities.
“We’re not trying to time the market, but we’re very comfortable with our defensive allocation,” he said. Although he predicted higher volatility a year ago, he was nonetheless surprised by the extremes reached in December, without even “a single hard warning sign of recession on the horizon.”
“Can you imagine,” he asked, “how volatile it will be when we do have those warnings?”

https://www.nytimes.com/2019/01/04/business/market-forecast-2019.html