2009 to 2022
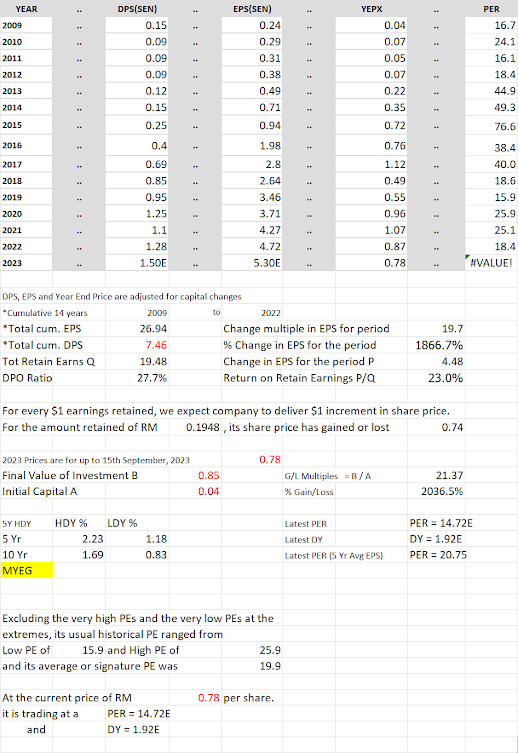
It EPS grew from 0.24 sen in 2009 to 4.72 sen in 2022. It had grown its EPS 19.7x.
Its EPS grew 11.7x, at a fast rate from 0.24 sen in 2009 to 2.8 sen in 2017. Its EPS dropped from 2.8 sen inn 2017 to 2.64 sen in 2018. From 2018, its EPS grew from 2.64 sen to 4,72 sen in 2022; it grew 1.8x.
Its PE expanded from PE of 16.1 in 2009 to PE of 76.6 in 2015. From 2015/16, its PE contracted from this highest PE to PE of 18.4 in 2022.
Excluding the extremely high PEs and extremely low PEs, the usual historical PE for MYEG ranged from low PE of 15.9 to high PE of 25.9 and its average or signature PE was 19.9.
It paid out 27.7% of its earnings as dividends and grew its earnings by 4.72 sen - 0.24 sen = 4.48 sen. It retained 26.94 sen - 7.46 sen = 19.48 sen. The return on its retained earnings is thus, 4.48 sen / 19.48 sen = 23%.
Its usual DY ranged from low DY of 0.83% to high DY of 2.23%.
At the current price of RM 0.79 per share, it is trading at a PE of 14.8x and its DY is 1.91%.

No comments:
Post a Comment