Wednesday, 12 September 2012

Why do profitable firms go bust?


How to Invest like Warren Buffett? Some basic principles.


How to Invest Safely in Stocks and make Money Work 4 You


Investing in Stocks - explained in 3 minutes


The Best Paying Jobs of the Future


The Best Paying Jobs of the Future

The U.S. unemployment rate peaked at 10% in October 2009 and has since slowly improved, flirting with 8% earlier this month. Despite the downward trend, the rate is still more than double prerecession levels. As the economy continues to recover and more people return to the workforce, many are trying to find the right career — one that is hiring and pays well.

Knowing which jobs will be in high demand and pay the most is a good place to start. To serve as a guide, 24/7 Wall St. identified the best paying jobs of the future. These jobs will grow the most in the next decade, some as much as 60% by 2020. They also have median salaries that are close to double the national average of $34,450, and in some cases more.

[More from 24/7 Wall St: America’s 10 Disappearing Jobs]

Many of these occupations will be in highest demand because of changes in the nation’s population and in the way the country’s businesses operate. Last year, the first baby boomers turned 65. As this generation gets older, increasing medical needs will require more health care professionals. Of the 10 high-paying, high-growth occupations we reviewed, six are in the medical field.

Because most of these positions are in the medical field, many require at least a master’s degree, and in many cases a doctoral degree. However, four have less demanding educational requirements, including the three that are growing the most. A career as a sonographer, projected to grow 43.5% with a median salary of $64,380, typically just requires an associate’s degree.

24/7 Wall St. identified the best paying jobs that also will have the highest demand for new workers in the future based on the Bureau of Labor Statistics’ National Employment Matrix, which forecasts job growth between 2010 and 2020 for the bureau’s more-than 1,000 listed jobs. The Matrix was used to identify the professions that are going to grow the most as a percentage of 2010 employment figures by 2020. Of those, we then narrowed the list to jobs that also had a median annual income of at least $60,000 in 2010, 75% higher than the $34,450 national median average, and at least 5,000 positions. Using the BLS Occupational Employment Statistics, 24/7 Wall St. also identified the states with the highest concentration of jobs as of May 2011.

These are the best paying jobs of the future.

1. Biomedical Engineers

Thinkstock> Pct. increase: 61.7%
> Total new jobs (2010-2020): 9,700
> Median income: $81,540
> States with the most jobs per capita: Massachusetts, Utah, Minnesota


The work of biomedical engineers typically involves designing or maintaining biomedical equipment, such as artificial organs and X-ray machines. These jobs often require a great deal of technical knowledge in fields such as biology, engineering, math and chemistry. Because of this, a bachelor’s degree is typically needed. The professional requirements come with impressive compensation. The median income for such jobs was $81,540 and the top 10% earned more than $126,990. Between 2010 and 2020, the number of biomedical engineers is projected to rise by 61.7%, more than four times the projected growth rate for all jobs, which is 14%. To explain its growth projections for the profession, the BLS cites the baby boomer generation’s growing demand for biomedical devices and procedures as it “seeks to maintain its healthy and active lifestyle.”

[More from 24/7 Wall St: American Cities Adding the Most Jobs]

2. Diagnostic Medical Sonographers

> Pct. increase: 43.5%
> Total new jobs (2010-2020): 23,400
> Median income: $64,380
> States with the most jobs per capita: Rhode Island, Florida, South Dakota


Diagnostic medical sonographers work in hospitals and other facilities, conducting ultrasounds on patients and analyzing the resulting images. The BLS projects an increase of 43.5% in the number of positions between 2010 and 2020, which would raise the total number of such jobs to 77,100. Explaining the driving factors behind the growth, the BLS states that “as ultrasound technology evolves, it will be used as a substitute for procedures that are costly, invasive or expose patients to radiation.” Sonographers typically need an associate’s degree, and many employers prefer candidates to have professional certification. The top 10% of sonographers made more than $88,490 annually.

3. Market Research Analysts and Marketing Specialists

Thinkstock> Pct. increase: 41.2%
> Total new jobs (2010-2020): 116,600
> Median income: $60,570
> States with the most jobs per capita: Delaware, Massachusetts, New York


Market research analysts work in most industries, monitoring and forecasting marketing and sales trends, as well as collecting and analyzing data on their companies’ products or services. To become a market research analyst, a bachelor’s degree is typically required, though many analysts have a master’s degree. Citing increases in the use of market research across all industries, the BLS projects the number of positions in the field will rise to almost 400,000 by 2020. Top-earning market research analysts made more than $111,440 annually.

4. Physical Therapists

> Pct. increase: 39.0%
> Total new jobs (2010-2020): 77,400
> Median income: $76,310
> States with the most jobs per capita: Rhode Island, Vermont, Maine


Physical therapists assist patients by helping to address and correct dysfunctional movement and pain. They are required to have a postgraduate professional degree, typically a Doctor of Physical Therapy, and a license. Those completing these prerequisites join one of the fastest-growing professions in the country — by 2020, the number of positions is expected to rise by 39%. The BLS states that “demand for physical therapy services will come, in large part, from the aging baby boomers, who are staying active later in life than previous generations did.” The top 10% of physical therapists earned more than $107,920.

5. Dental Hygienists 

Thinkstock> Pct. increase: 37.7%
> Total new jobs (2010-2020): 68,500
> Median income: $68,250
> States with the most jobs per capita: Michigan, Utah, Idaho


From 2010 to 2020, the number of dental hygienists is projected to rise by 37.7% to more than 250,000. Factors driving increased demand for this occupation include ongoing research linking oral health to general health, as well as an aging population keeping more of its teeth. Dental hygienists typically do not need a professional degree or previous work experience, though they often need an associate’s degree and a license. Typical job responsibilities include cleaning teeth and taking dental X-rays.

[More from 24/7 Wall St: America’s Worst Companies to Work For]

6. Audiologists

> Pct. increase: 36.8%
> Total new jobs (2010-2020): 4,800
> 2010 Median annual wage: $66,660
> States with the most jobs per capita: New Mexico, Colorado, West Virginia


Audiologists treat patients who have problems with their hearing, balance or ears. A doctoral degree is necessary, as is a state license, though exact requirements differ by state. Explaining projected job growth, the BLS notes that “hearing loss increases as people age, so an aging population is likely to increase demand for audiologists.” There are not very many audiologists, and a projected 36.8% increase in jobs would bring the total number of audiologists to 17,800 by the end of the decade. Annual salaries exceeded $102,210 for the top 10% of audiologists.

7. Medical Scientists, Except Epidemiologists

Thinkstock> Pct. increase: 36.4%
> Total new jobs (2010-2020): 36,400
> Median income: $76,700
> States with the most jobs per capita: Massachusetts, California, Washington


Though the roles of medical scientists vary from job to job, all study biological systems to understand their effects on human health. Medical scientists often work for the federal government, at research universities or in the private sector. By 2020, the number of medical scientists is projected to increase to more than 136,000, as the population of the United States grows and ages and the demand for prescription drugs rises. Educational requirements are quite high, with most positions asking for either a doctorate or a medical degree. The annual pay of the top 10% of medical scientists was $142,800.

8. Veterinarians

> Pct. increase: 35.9%
> Total new jobs (2010-2020): 22,000
> Median income: $82,040
> States with the most jobs per capita: Montana, Colorado, Iowa


In addition to pets, veterinarians tend to sick livestock, laboratory animals and other critters. The BLS projects that the number of veterinarians will increase by 22,000, or 35.9%, between 2010 and 2020. A rising national pet population, as well as the need for additional food supply inspection as the U.S. population grows, are among the reasons for the strong job growth. To practice, veterinarians must obtain a Doctor of Veterinary Medicine degree, currently awarded by just 28 colleges nationwide, as well as a state license.

9. Occupational Therapists

Thinkstock> Pct. increase: 33.5%
> Total new jobs (2010-2020): 36,400
> Median income: $72,320
> States with the most jobs per capita: Maine, Massachusetts, New Hampshire


“Occupational therapists treat patients with injuries, illnesses, or disabilities through the therapeutic use of everyday activities. They help patients develop, recover, and improve the skills needed for daily living and working,” according to the BLS. Becoming an occupational therapist requires a master’s degree, which generally takes two years to complete. The number of occupational therapists is expected to reach 145,200 by 2020, as an aging baby-boomer generation looks to maintain its independence and stay active.

10. Optometrists

> Pct. increase: 33.1%
> Total new jobs (2010-2020): 11,300
> Median income: $94,990
> States with the most jobs per capita: Hawaii, North Dakota, Montana


Optometrists specialize in the care of eyes and vision. Their responsibilities include diagnosing eye injuries and diseases, as well as prescribing glasses and contact lenses. In order to practice, they are required to have a Doctor of Optometry degree, presently awarded by just 20 accredited programs, and must be licensed by the National Boards in Optometry. Those who meet these qualifications are often extremely well-compensated: the top 10% of optometrists earned in excess of $166,400. With vision problems becoming more frequent as people grow older, the number of optometrists is expected to rise by 33.1% between 2010 and 2020.


Happiness


Some old-age truths about happiness — Kua Ee Heok

September 12, 2012
SEPT 12 — Six months ago, I was referred a 67-year-old doctor who was profoundly depressed after suffering a heart attack. His cardiologist requested an urgent psychiatric consultation because he was suicidal.
A general practitioner, he had always wanted to own an elegant house in Queen Astrid Park. In his pursuit of happiness, he worked assiduously, took a large bank loan and was planning the renovation of the bungalow when he collapsed in his clinic after experiencing an acute chest pain. While recuperating, he wondered whether he could work again and worried about the financial burden.
During our psychological therapy session, he confided about having been preoccupied for many years with the “dream house” since visiting a patient living in that prestigious part of Singapore.
He writhed in mental anguish — his happiness had been shattered.
Happiness and depression are on the two ends of the emotion spectrum. Recently, there has been a surge in research into this bipolarity of emotion, with the advent of new brain scanning techniques.
As neuroscientists ponder the convoluted brain neurotransmitter systems of dopamine and serotonin regulating our emotions, we know that happiness is personal and intrapsychic — a psychological term referring to the internal psychological processes of the individual.
People externalise their happiness by sharing with friends, giving to the less fortunate or helping neighbours.
Happiness is a topical issue not only in the heartland kopitiam but, also, the hallowed halls of the United Nations in New York. Many countries, including Bhutan and Britain, have constructed their own Happiness Index. In the homes of many elderly Chinese are three deities — Fu, Lu and Shou — who personify their aspirations of wealth, happiness and longevity.
As you listen to the Singapore national conversation over the next few months, a central theme I suspect will be “happiness”, or the lack of it, and it will pervade the issues of jobs, housing, public transport and foreigners.
Factors associated with happiness and satisfaction in late life have also intrigued many researchers in the field of gerontology. A few years ago, the Department of Psychological Medicine of the National University Health System conducted a study of elderly people living in the Chinatown and Toa Payoh districts.
About 72 per cent of the Chinatown elderly and 69 per cent of the Toa Payoh elderly indicated that they were happy and satisfied with life. However, their reasons for life satisfaction were quite different.
The Chinatown elderly lived in smaller HDB flats and preferred to meet friends in community centres or the void decks; their main reasons for life satisfaction were family or social relationships and good health.
The Toa Payoh elderly were living in bigger flats and their main reasons for life satisfaction were the comfortable homes and good health. When we assessed the rate of depression in both groups, the prevalence was 5 per cent in the Chinatown elderly and 9 per cent in the Toa Payoh elderly.
There was more social interaction among the Chinatown elderly who tended to congregate at public places to chat, watch television, read the papers or play mahjong. The Toa Payoh elderly did not interact as much with neighbours and seemed more isolated and lonely. In short, the Chinatown elderly, although poorer, were happier with lower prevalence of depressive disorder.
You may wonder how many of the Chinatown elderly will participate or are even cognisant of the imminent national conversation. With their long years and wisdom, they can tell us something about happiness, if we have time to listen and understand their dialects.
Because of the change in family structure, more Singapore elderly will be living alone in future and cannot expect much support from close relatives. Living alone and loneliness were issues explored in a recent study in the Jurong district by our research team. We found that a sense of loneliness, and not living alone, was a risk factor for depression which could lead to suicidal ideation.
Many people lament the passing of the kampong or village socio-ecological community of interdependence. In the past, living in a village allowed people to interact and cooperate in caring for their neighbours. With modernity, the ethos of the kampung spirit is lost.
It may be possible to resurrect the same community spirit within blocks of flats by identifying, within each block, the frail and the able-bodied elderly. If the latter can become informal carers of the former, a future tradition could grow within the precinct. And this is the challenge — to build not just a cohesive and inclusive but also caring community, which is the soul of the nation.
As for the doctor, I reviewed him last month and he had improved after four months of psychological therapy. No longer depressed or suicidal, he had begun to recalibrate his priorities in life and felt the “dream house” was no longer at the top of the list.
He decided to work part-time and looked forward to thrice-a-week morning walks at the Botanic Gardens, Labrador Park and MacRitchie Reservoir with his friends from church. His joie de vivre now was admiring the beauty of nature, and spending more time with family and friends.
In fact, his wife persuaded him to stay in their present apartment and sell the bungalow, which should fetch a princely sum today. He is a case study to repudiate the myth that suicide is not preventable.
Before he left my clinic, he reflected on the dark days when he wanted to take his life and, with a wry smile, quipped: “Everybody wants to go to heaven but nobody … nobody really wants to die.”
I agreed. — Today
* Dr Kua Ee Heok is a professor in the Department of Psychological Medicine, National University of Singapore, and senior consultant psychiatrist in the National University Health System.

How do I calculate the adjusted closing price for a stock?

When trading is done for the day on a recognized exchange, all stocks are priced at close. The price that is quoted at the end of the trading day is the price of the last lot of stock that was traded for the day. This is called a stock's closing price. The final stock price that is quoted can be used by investors to compare a stock's performance over a period of time. This period is usually from one trading day to another.

During the course of a trading day, many things can happen to affect a stock's price. Along with good and bad news relating to the operations of a company, any sort of distribution that is made to investors will also affect stock price. These distributions can include cash dividendsstock dividends and stock splits.

When distributions are made, the adjusted closing price calculations are quite simple. For cash dividends, the value of the dividend is deducted from the last closing sale price of the stock. For example, let's assume that the closing price for one share of XYZ Corp. is $20 on Thursday. After close on Thursday, XYZ Corp. announces a dividend distribution of $1.50 per share. The adjusted closing price for the stock would then be $18.50 ($20-$1.50).

If XYZ Corp. announces a 2:1 stock dividend instead of a cash dividend, the adjusted closing price calculation will change. A 2:1 stock dividend means that for every share an investor owns, he or she will receive two more shares. In this case, the adjusted closing price calculation will be $20*(1/(2+1)). This will give you a price of $6.67, rounded to the nearest penny.

If XYZ Corp. announces a 2:1 stock split, investors will receive an extra share for every share they already own. This time the calculation will be $20*(1/(1x2)), resulting in an adjusted closing price of $10.

We have examined the simplest and most common corporate actions that can affect a stock's closing price. However, if a more complicated action, such as a rights offering, is announced, the adjusted closing price calculation can become quite confusing. Historical price services provided by financial sites such as Yahoo! Finance eliminate the confusion by calculating adjusted closing prices for investors.


Read more: http://www.investopedia.com/ask/answers/06/adjustedclosingprice.asp#ixzz26D2HFoLa


Definition of 'Adjusted Closing Price'

A stock's closing price on any given day of trading that has been amended to include any distributions and corporate actions that occurred at any time prior to the next day's open. The adjusted closing price is often used when examining historical returns or performing a detailed analysis on historical returns.Investopedia Says

Investopedia explains 'Adjusted Closing Price'

The adjusted closing price is a useful tool when examining historical returns because it gives analysts an accurate representation of the firm's equity value beyond the simple market price. It accounts for all corporate actions such as stock splits, dividends/distributions and rights offerings.

Read more: http://www.investopedia.com/terms/a/adjusted_closing_price.asp#ixzz26D39i2sh

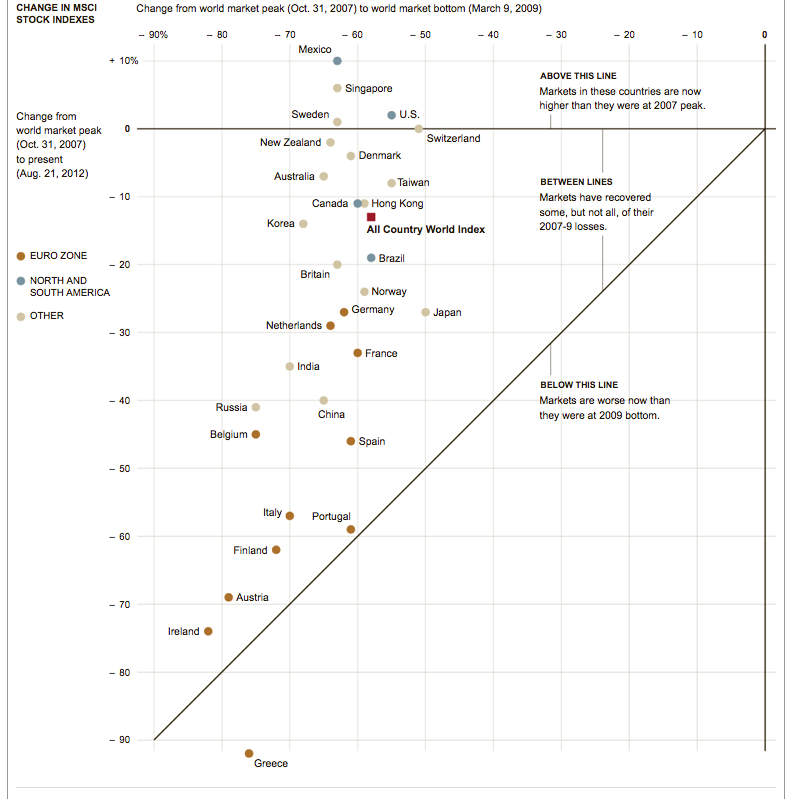
The stock markets of Singapore, US, Mexico and Sweden are above their 2007 highs

This chart shows different countries and their struggle with the bounce back from the Great Financial Crisis.
The chart shows the performance of 30 markets as measured by MSCI indexes, and of the MSCI All Country World Index, which includes all markets MSCI classifies as developed or emerging.


Click to enlarge

The X Axis shows how deep the plunge for the countries. As you can see the ones who was best insulated was Japan at –50% and the worse Ireland at > –80%
The Y Axis shows the returns since the market top in Oct 2007. Only 4 countries including Singapore and US is positive. The amazing thing was the PIIGS are still at 2009 doldrums.


Tuesday, 11 September 2012

Head to Head: The Supermarkets (Tesco, Sainsbury and Morrison, U.K.)


LONDON -- In this series, some of your favorite FTSE 100 (UKX) shares go head to head in a three-round contest for superiority.
In Round 1, the firms fight on earnings; in Round 2, on dividends; and Round 3 is a battle of the balance sheets. The winner will be the company that has racked up most points at the end of the contest.
In a twist to the usual format, we have three companies stepping into the ring today: Tesco(LSE: TSCO.L  ) , J Sainsbury (LSE: SBRY.L  ) and Wm Morrison (LSE: MRW.L  ) .
Fears about the fragile economy and eurozone worries have driven investor demand for defensive companies -- companies that perform reasonably well in all economic conditions -- including supermarkets.
The shares of Tesco, Sainsbury and Morrison have outperformed the FTSE 100 index over the last six months. The Footsie is flat over the period, but Tesco is up 11%, Sainsbury 13% and Morrison 3%.
Let's take our seats at ringside.
Round 1: Earnings
Tesco
Sainsbury
Morrison
Recent share price347p331p292p
Last year price-to-earnings (P/E) ratio9.211.811.4
Current year forecast P/E10.211.310.7
Four-year average earnings-per-share growth (%)897
Current year forecast EPS growth (%)-158
Forecast operating margin (%)5.43.25.1
Source: Digital Look. Winners in bold.
Tesco scores points for its low P/E and industry-leading operating margin. It just loses out to Sainsbury on historic earnings growth but falls down badly on forecast earnings growth, where Morrison takes the point.
Nevertheless, Tesco's P/E and margin give it a comfortable victory in the first round.
Round 2: Dividends
Tesco
Sainsbury
Morrison
Last year dividend yield (%)4.34.93.7
Current year forecast dividend yield (%)4.35.04.0
Four-year average dividend growth (%)8823
Current year forecast dividend growth (%)1310
Forecast dividend cover2.31.82.3
Source: Digital Look. Winners in bold.
Sainsbury starts the second round strongly, out-pointing its rivals by some margin on historic and forecast dividend yield. However, Morrison is equally dominant in winning points for historic and forecast dividend growth -- and pips Sainsbury to victory in the round by sharing a point with Tesco for dividend cover.
Mustering just half a point, this is a poor round for Tesco after its commanding performance in the first round.
Round 3: Balance sheet
Tesco
Sainsbury
Morrison
Price-to-book ratio1.61.11.3
Net gearing (%)533532
Source: Digital Look. Winners in bold.
Tesco weakens further in the final round, with Sainsbury and Morrison sharing the points. Overall, Tesco has won one round, Morrison has won one round, and Sainsbury and Morrison have drawn a round. The points tally comes out as Morrison 4.5, Sainsbury 4.0, and Tesco 3.5.
Post-match assessmentThis was a narrow victory for Morrison in a hard-fought contest. Tesco scored particularly well for its earnings rating and Sainsbury particularly well for its dividend yield. But Morrison's all-round performance won the day. Morrison was very strong in the areas of forecast earnings and past and forecast dividend growth, supported by good dividend cover and conservative gearing.
Morrison is also the pick of the supermarkets in the eyes of U.K. master investor Neil Woodford, whose funds have beaten the wider market by over 300% in the last 15 years. In fact, Woodford has increased his stake in Morrison this year.
Meanwhile, U.S. investing legend Warren Buffett has also bought a trolley-load of shares in a U.K. supermarket this year. Does Buffett see eye to eye with Woodford? Find out in this special Motley Fool report -- "The One U.K. Share Warren Buffett Loves" -- which you can download for free.

Tesco's recovery plan may be working - Kantar


Tue Sep 11, 2012 7:46am EDT

* Tesco UK market share 30.8 pct in 12 weeks to Sept. 2
    * Asda remains fastest growing of big four grocers
    * Grocery inflation 2.9 pct

    LONDON, Sept 11 (Reuters) - The recovery plan unveiled by Tesco, Britain's biggest retailer, after a profit warning in January is showing signs of working, industry data showed on Tuesday.
    Market researcher Kantar Worldpanel said Tesco's share of the grocery market edged down 0.1 percentage point year-on-year to 30.8 percent in the 12 weeks to Sept. 2.
    This was "a relatively small decline compared with most of 2012 and evidence of some success in its fight-back," Kantar director Edward Garner said.
    In April, Tesco slashed expansion plans for its British chain and said it would spend over 1 billion pounds ($1.6 billion) improving stores and online shopping in a bid to reverse a decline in market share. 
 
    Tesco's sales rose 2.8 percent over the 12-week period,Kantar said, behind growth of 4.5 percent at Wal-Mart's Asda, Britain's No. 2 supermarket chain, and growth of 3.8 percent at Sainsbury, the No. 3 player.    Wm Morrison Supermarkets, Britain's No. 4 grocer, was the laggard, with growth of 1.1 percent, reflecting its lack
of an online offer and only a small number of convenience outlets.
    Kantar said the total grocery market grew 3.3 percent over the 12 weeks, above its inflation measure of 2.9 percent.
    "Despite ongoing pressures, things seem to be looking up in the grocery market and shoppers are not having to trade down to the same extent as they have done over the past year," said Garner.
    However, Kantar noted the inflation measure may have bottomed out with poor grain harvests driving inflationary spikes ahead.
    
      Following is a summary of market share and sales (pounds):
                  12 wks to     12 wks to     pct change
                  Sept 2 2012   Sept 4 2011   
 Total till roll  30.79 bln     30.15 bln     2.1 pct
 Total grocers    23.49 bln     22.74 bln     3.3 pct
 Total multiples  22.98 bln     22.22 bln     3.4 pct
 
      Market share (percent)
                  12 wks to     12 wks to     pct change
                  Sept 2 2012   Sept 4 2011   in sales
 Tesco            30.8          30.9          2.8
 Asda             17.6          17.4          4.5
 Sainsbury        16.4          16.3          3.8
 Morrison         11.5          11.7          1.1
 Co-operative     6.8           7.1           -1.2
 Waitrose         4.6           4.4           7.8
 Aldi             2.9           2.4           26.6
 Lidl             2.8           2.6           10.9
 Iceland          2.0           1.9           8.5


http://www.reuters.com/article/2012/09/11/britain-grocers-kantar-idUSL5E8KBA9020120911?feedType=RSS&feedName=cyclicalConsumerGoodsSector&rpc=43