| ||||||||||||||||||||||||||||||||||||||||||||||||||||||||||||||||||||||||||||||||||||||||||||||||||||||||||||||||||||||||||||||||||||||||||||||||||||||||||||||||||||||||||||||||||||||||||||||||||||||||||||||||||||||||||||
Thursday, 4 January 2024
Dutch Lady: Investment returns
How to read a balance sheet like a CFO: A risk-based approach

Wednesday, 3 January 2024
Returns to shareholders of Petronas Dagangan over the last 10 years and 5 years
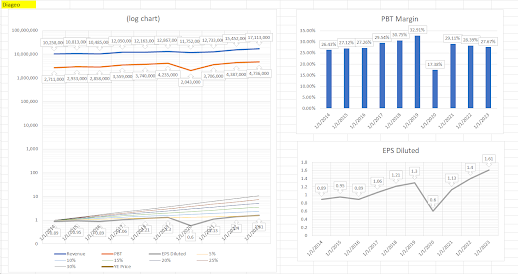
Petronas Dagangan
Dividends (sens) per share received each year:
2014 55.50
2015 62.00
2016 62.00
2017 78.00
2018 94.00
2019 70.00
2020 61.00
2021 40.00
2022 40.00
2023 NA
Year end share price of PBB
Year 2013 RM 31.44
Year 2018 RM 26.50
Year 2023 RM 23.00
Returns to shareholders of Petdag
10 year period from end of 2013 to end of 2023
Capital depreciation = RM 23.00 - RM 31.44 = - RM 8.44
Total dividends received = RM 5.625
Total loss = - RM 8.44 + RM 5.625 = - RM 2.815
Loss % = - RM 2.815 / RM 31.44 = - 8.95%
The loss of capital was attenuated by the dividends received over the last 10 years.
5 year period from end of 2018 to end of 2023
Capital loss = RM 23.00 - RM 26.50 = - RM 3.50
Total dividends received = RM 2.11
Total loss = - RM 3.50 + RM 2.11 = - RM 1.39
Gain % = - RM 1.39 / RM 26.50 = - 5.24%
The loss of capital was attenuated by the dividends received over the last 5 years.
Returns to shareholders of Public Bank Berhad over the last 10 years and last 5 years
Public Bank Berhad
Dividends (sens) per share received each year:
2014 10.41
2015 11.00
2016 11.60
2017 11.80
2018 13.20
2019 14.00
2020 8.00
2021 20.50
2022 19.70
2023 14.00
Year end share price of PBB
Year 2013 RM 3.76
Year 2018 RM 4.95
Year 2023 RM 4.25
Returns to shareholders of PBB
10 year period from end of 2013 to end of 2023
Capital appreciation = RM 4.25 - RM 3.76 = RM 0.49
Total dividends received = RM 1.34
Total gains = RM 0.49 + RM 1.34 = RM 1.83
Gain % = RM 1.83 / RM 3.76 = 48.7%
Dividends provided the bulk of the returns to shareholders over the last 10 years.
5 year period from end of 2018 to end of 2023
Capital loss = RM 4.25 - RM 4.95 = - RM 0.70
Total dividends received = RM 0.762
Total gain = - RM 0.70 + RM 0.762 = RM 0.062
Gain % = RM 0.062 / RM 4.95 = 1.25%
The loss of capital was attenuated by the dividends received over the last 5 years.
Friday, 24 November 2023
HOW TO VALUE A COMPANY: 6 METHODS
1. Book Value
2. Discounted Cash Flows
3. Market Capitalization
4. Enterprise Value
5. EBITDA
6. Present Value of a Growing Perpetuity Formula
In finance, growth is powerful.
https://online.hbs.edu/blog/post/how-to-value-a-company
Thursday, 26 October 2023

Wednesday, 25 October 2023


Monday, 23 October 2023
How Warren Buffett Made His First $1,000,000
Tuesday, 3 October 2023
Process of Portfolio Management

Capital Market Expectations
To help investors assess the potential investment returns and determine the long-term outlook, formulate expectations for risk and return of various asset classes.
Asset Allocation Strategy
There are two strategies to consider here, strategic and tactical.
A strategic asset allocation strategy is a long-term strategy that necessitates regular rebalancing to ensure you do not deviate from your goals.
A tactical asset allocation strategy, on the other hand, takes a more active approach that reacts to changing market conditions. This means that despite having a long-term plan, you make frequent changes for short-term gains.
Feedback
Any changes are thoroughly examined to ensure they are consistent with long-term objectives.
Monitoring and Rebalancing
A portfolio manager should regularly monitor and evaluate risk exposures within the portfolio to rebalance it according to the strategic asset allocation.
Performance Evaluation
Evaluating a portfolio using absolute and relative returns gives a complete picture of its strengths and weaknesses. Such help portfolios reach their full potential and give investors the confidence that their funds are managed well.
https://www.financestrategists.com/financial-advisor/portfolio-management/#:~:text=There%20are%20four%20main%20portfolio,educated%20choice%20about%20an%20investment.