Monday, 11 March 2024

Enduring multi-baggers and Transitory multi-baggers.

Stocks for the long run.

The power of compounding is truly remarkable, almost magical for those with the ability to identify these companies with earnings power over the long term.


Do you know that DLady was priced RM 1.60 per share, Nestle RM 6 to RM 8 per share and Petdag RM 2.00 per share in the 1990s?


Today, DLady is RM 23.00 per share, Nestle is RM 120.00 per share and Petdag is RM 22.00 per share.

The prices of these stocks have dropped from their highest.  DLady has dropped from its historical high price of RM 75.00 per share.  Nestle has dropped from its high of RM 160+ per share.  Similarly, Petdag has dropped from its high price of RM 30+ per share a few years ago.


DLady has dropped a lot and there are various reasons for these. 


How can you exploit any opportunities depend on how you approach your investing. 


Enduring multi-baggers and Transitory multi-baggers.


ENDURING multi-baggers are those companies whose wealth creation is long-lasting and correction from the peak valuation is limited.
In fact, they continue to exist as multi-baggers even after the correction.
The enduring multi-bagging companies are typically few and difficult to be spotted, and most of the time they appear to be expensive at the time of buying because of the lack of faith in their longevity and size of growth.


TRANSITORY multi-baggers, on the contrary, are easier to be spotted but they always end up giving nasty end results.
Corrections are typically almost 100 per cent.
Cyclicals broadly come under this category.
The tragedy with this class of companies is that if you cannot sell in time, nothing is left in your hand.
But as correction is inevitable, market as a whole is left high and dry with a bad experience.
These companies are plenty and easy to be found, and they attract a lot of crowd.


Ten-baggers operate in growth industries.


Ten-baggers are shares where you make 10 times your money (I believe the phrase is derived from baseball). Such opportunities are rare, but I have been fortunate enough over the years to be involved in a few such situations: DLady, Nestle, Petdag and others.

There tend to be some common characteristics among these winners. The businesses all operate in growth industries and the company in question must be able to grow the top line. No one ever made a tenfold return on a pure margin improvement, or cost-cutting story with no sales growth.

Turnarounds are, however, a rich source of 10-baggers. For these to work, one's timing has to be immaculate, and the underlying business has to be sound - just desperately unloved by the stock market.


Patience is needed.


Such returns need patience. A hedge fund that churns its holdings every few months will never enjoy a 10-bagger. And therein lies the greatest danger: selling too early to enjoy the 1,000 per cent gain.

When you have doubled or trebled your money, it is so tempting to cash in profits. It must have been tempting in the early 1950s to take profits on Glaxo shares, just a few years after their 1947 flotation. Or to have done the same for Tesco which floated in the same year. Or sell Racal in the late 1960s after its 1961 market debut, decades before it spun off Vodafone. Yet each of those shares rewarded patient investors with epic performances over many decades, all 20-baggers at least, not even allowing for dividend.

One of the advantages that private equity enjoys is that it is forced to take a reasonably long-term view, and so is usually unable to rush for the exit at the first opportunity. Venture capital's other edge over quoted investors is debt: gearing in successful situations always amplifies the return to equity-holders. Typically, buy-outs have structures where 70 per cent of the capital is borrowed.

Quoted companies probably have the reverse capitalisation, with equity providing three-quarters of the funding. And as ever in investing, those who regularly find 10-baggers say you should stick to your own sphere of competence: buy what you understand.


Usual rules apply:  Quality, Management & Valuation


But the usual rules apply: look for real companies with competent management and a proven business model.

You won't find a 10-bagger among much of the over-hyped, speculative froth. Search for the solid operation with strong fundamentals and a high quality of earnings.

Very few acquisitive vehicles are 10-baggers. Management in such firms focuses on doing deals rather than organically growing its core business. This can produce reasonable returns, but rarely delivers the stellar, long-run performance that can come from a strong business franchise in an attractive niche. 


And balance sheets matter: 10-baggers must be able to fund expansion internally or through debt. Companies that are forever issuing equity dilute their stock performance.


So good luck in your search for the next blockbuster. It may well be an obscure, neglected company now, but with the potential for greatness. The secret is to spot that potential.

Tuesday, 5 March 2024

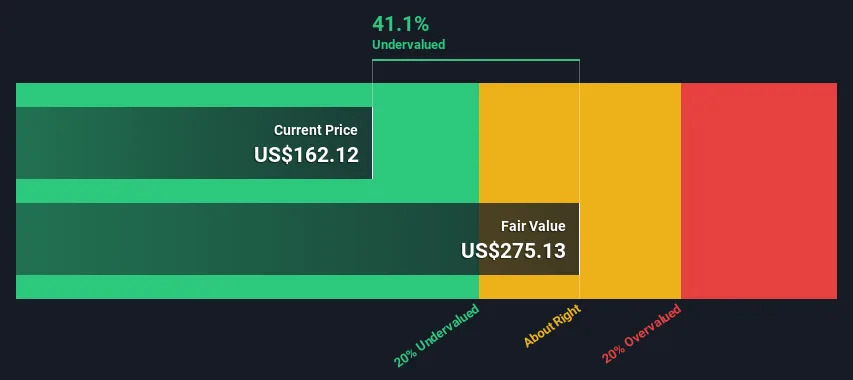
Is There An Opportunity With Johnson & Johnson's (NYSE:JNJ) 41% Undervaluation?

Comment:   

An example of using 2 stage growth model and discount cash flow method in valuing a company.

The discount cash flow method is based on 2 assumptions:   future cash flows and the applied discount rate.  

It is not an exact science.  One should you conservative assumptions in your valuation.

Charlie Munger mentioned that he had never seen Warren Buffett using the DCF method in his valuation.   There are better and easier ways to value a company.  Often you will know if a company is cheap or very expensive, even without having to do elaborate studies.   (An analogy is you do not need to know the weight to know that this person is overweight or obese or underweight.)  

Keep your valuation simple.  It is better to be approximately right than to be exactly wrong.

The article below shares how to do valuation in detail.

Happy investing.  


Key Insights

  • Using the 2 Stage Free Cash Flow to Equity, Johnson & Johnson fair value estimate is US$275

  • Johnson & Johnson is estimated to be 41% undervalued based on current share price of US$162

  • Analyst price target for JNJ is US$174 which is 37% below our fair value estimate

Does the March share price for Johnson & Johnson (NYSE:JNJ) reflect what it's really worth? Today, we will estimate the stock's intrinsic value by taking the forecast future cash flows of the company and discounting them back to today's value. We will use the Discounted Cash Flow (DCF) model on this occasion. There's really not all that much to it, even though it might appear quite complex.

We generally believe that a company's value is the present value of all of the cash it will generate in the future. However, a DCF is just one valuation metric among many, and it is not without flaws. If you want to learn more about discounted cash flow, the rationale behind this calculation can be read in detail in the Simply Wall St analysis model.

Check out our latest analysis for Johnson & Johnson

What's The Estimated Valuation?

We're using the 2-stage growth model, which simply means we take in account two stages of company's growth. In the initial period the company may have a higher growth rate and the second stage is usually assumed to have a stable growth rate. To start off with, we need to estimate the next ten years of cash flows. Where possible we use analyst estimates, but when these aren't available we extrapolate the previous free cash flow (FCF) from the last estimate or reported value. We assume companies with shrinking free cash flow will slow their rate of shrinkage, and that companies with growing free cash flow will see their growth rate slow, over this period. We do this to reflect that growth tends to slow more in the early years than it does in later years.

A DCF is all about the idea that a dollar in the future is less valuable than a dollar today, so we discount the value of these future cash flows to their estimated value in today's dollars:

10-year free cash flow (FCF) estimate

2024

2025

2026

2027

2028

2029

2030

2031

2032

2033

Levered FCF ($, Millions)

US$22.8b

US$23.9b

US$24.5b

US$25.0b

US$26.4b

US$27.2b

US$28.0b

US$28.7b

US$29.4b

US$30.2b

Growth Rate Estimate Source

Analyst x5

Analyst x6

Analyst x5

Analyst x3

Analyst x3

Est @ 2.99%

Est @ 2.78%

Est @ 2.63%

Est @ 2.53%

Est @ 2.46%

Present Value ($, Millions) Discounted @ 6.0%

US$21.5k

US$21.3k

US$20.6k

US$19.9k

US$19.8k

US$19.2k

US$18.6k

US$18.1k

US$17.5k

US$16.9k

("Est" = FCF growth rate estimated by Simply Wall St)
Present Value of 10-year Cash Flow (PVCF) = US$193b

We now need to calculate the Terminal Value, which accounts for all the future cash flows after this ten year period. For a number of reasons a very conservative growth rate is used that cannot exceed that of a country's GDP growth. In this case we have used the 5-year average of the 10-year government bond yield (2.3%) to estimate future growth. In the same way as with the 10-year 'growth' period, we discount future cash flows to today's value, using a cost of equity of 6.0%.

Terminal Value (TV)= FCF2033 × (1 + g) ÷ (r – g) = US$30b× (1 + 2.3%) ÷ (6.0%– 2.3%) = US$838b

Present Value of Terminal Value (PVTV)= TV / (1 + r)10= US$838b÷ ( 1 + 6.0%)10= US$469b

The total value, or equity value, is then the sum of the present value of the future cash flows, which in this case is US$663b. To get the intrinsic value per share, we divide this by the total number of shares outstanding. Relative to the current share price of US$162, the company appears quite good value at a 41% discount to where the stock price trades currently. The assumptions in any calculation have a big impact on the valuation, so it is better to view this as a rough estimate, not precise down to the last cent.

dcf
dcf

The Assumptions

The calculation above is very dependent on two assumptions. The first is the discount rate and the other is the cash flows. If you don't agree with these result, have a go at the calculation yourself and play with the assumptions. The DCF also does not consider the possible cyclicality of an industry, or a company's future capital requirements, so it does not give a full picture of a company's potential performance. Given that we are looking at Johnson & Johnson as potential shareholders, the cost of equity is used as the discount rate, rather than the cost of capital (or weighted average cost of capital, WACC) which accounts for debt. In this calculation we've used 6.0%, which is based on a levered beta of 0.800. Beta is a measure of a stock's volatility, compared to the market as a whole. We get our beta from the industry average beta of globally comparable companies, with an imposed limit between 0.8 and 2.0, which is a reasonable range for a stable business.

SWOT Analysis for Johnson & Johnson

Strength

  • Debt is not viewed as a risk.

  • Dividends are covered by earnings and cash flows.

Weakness

  • Earnings declined over the past year.

  • Dividend is low compared to the top 25% of dividend payers in the Pharmaceuticals market.

Opportunity

  • Annual earnings are forecast to grow for the next 3 years.

  • Good value based on P/E ratio and estimated fair value.

Threat

  • Annual earnings are forecast to grow slower than the American market.

Next Steps:

Valuation is only one side of the coin in terms of building your investment thesis, and it shouldn't be the only metric you look at when researching a company. The DCF model is not a perfect stock valuation tool. Preferably you'd apply different cases and assumptions and see how they would impact the company's valuation. For instance, if the terminal value growth rate is adjusted slightly, it can dramatically alter the overall result. What is the reason for the share price sitting below the intrinsic value? For Johnson & Johnson, there are three pertinent aspects you should consider:

  1. Risks: Every company has them, and we've spotted 1 warning sign for Johnson & Johnson you should know about.

  2. Future Earnings: How does JNJ's growth rate compare to its peers and the wider market? Dig deeper into the analyst consensus number for the upcoming years by interacting with our free analyst growth expectation chart.

  3. Other Solid Businesses: Low debt, high returns on equity and good past performance are fundamental to a strong business. Why not explore our interactive list of stocks with solid business fundamentals to see if there are other companies you may not have considered!

PS. The Simply Wall St app conducts a discounted cash flow valuation for every stock on the NYSE every day. If you want to find the calculation for other stocks just search here.


 editorial-team@simplywallst.com (Simply Wall St)

https://uk.finance.yahoo.com/news/opportunity-johnson-johnsons-nyse-jnj-110049724.html

Saturday, 2 March 2024

Selling is often a harder decision than buying


Selling is often a harder decision than buying

"If you have bought a good quality stock at bargain or reasonable price, you can often hold forever." 

Investing is fun.  For every rule, there is always an exception. 

The main reasons for selling a stock are:

1.  When the fundamental has deteriorated permanently,  (Sell urgently)
2.  When it is overpriced, whereby the upside gain will be unlikely or very small and the downside loss will be big or certain.

We shall examine reason No. 2 through the property market.  The property market is also cyclical.  There were periods of booms and dooms. 


If you have a good piece of property that is always 100% tenanted and which gives you good consistent return (let's say 2x or 3x risk free FD rates), would you not hold this property forever?  The answer is probably yes.

Then, when would you sell this property?

Note that the valuation of property, as with stocks, is both objective and subjective.

Would you sell when someone offered to buy at 500% above your perceived market price?  

Probably yes, as this is obviously overpriced.  You could cash out and probably easily re-employ the money to earn better returns in another property (or properties) or other assets. 

Would you sell when someone offered to buy at 50% above your perceived market price? 

Maybe yes or maybe no.  You can offer your many reasons.  

However, all these will be based on the perceived future returns you can hope to get from this property in the future.  This is both objective based on past returns obtained and subjective and speculative on future returns.

However, unlike reason No.1 when you would need to sell urgently to another buyer to prevent sustaining a permanent loss, you need not sell just because someone offered to buy the property at high price. (However, there are also those who "flip properties" for their earnings; they will sell quickly for a quick profit.)  You will not suffer a loss but only a diminished return at worse.  You can take your time to work out the mathematics.  

You maybe surprised that you may still achieve a return higher at a time in the near future by rejecting the present immediate gain based on the present high price offered.  

Also, you would need to price in the lost opportunity cost when the property is sold at this price, even though it is 50% above the perceived normal market price.  Could you buy a similar quality property with the same sustainable increasing income or return by offering the same price?


Similarly, the same line of thinking can be applied to your selling of shares.  

When should you sell your shares?  

Yes, definitely when the fundamentals have deteriorated permanently.  The business has suffered for various reasons and going forward, the earnings will be permanently impaired and deteriorating.  

Yes, when the price is very very overpriced.  However, you need not sell your shares in good quality companies that you bought at fair or bargain price.  As long as the fundamentals are strong and the business is adding value, selling now at a higher price may mean losing the return that you could have obtained in the future years from owning this stock and the opportunity cost of reinvesting the cash into another stock of similar quality and returns.  

Once again, the importance of sound reasoning and doing the mathematics in making a decision whether to sell or not.

Is it not true, that the really big fortunes from common stocks have been garnered by those
  • who made a substantial commitment in theearly years of a company in whose future they had great confidence and
  • who held their original shares unwaveringly while they increased 10-fold or 100-fold or more in value?

The answer is "Yes."


Additional notes: 

Other reasons for selling a stock (or property) are:
  • To raise cash to reinvest into another asset with better return.
  • A certain stock (or property sector) may be over-represented in your portfolio due to recent rapid price rises and you need to reduce its weightage to reduce your risk of over-exposure in this single stock (or property sector).


Footnote:
 

This is a true story. A rich man was approached by a buyer to sell his property. A few neighbouring lots were sold for $1.6 m the last 2 years. What offer will ensure that you sell your property to me?  Please let me know. The unwilling owner replied, "$5 million". There is a lesson here too. :-)


Friday, 1 March 2024

KSL at a glance


How to invest in the stock market?

Traditionally, stocks have provided high returns and have been a mainstay of most investors’ portfolios. Since a share of stock merely represents an ownership interest in an actual business, owning a portfolio of stocks just means we’re entitled to a share in the future income of all those businesses. If we can buy good businesses that grow over time and we can buy them at bargain prices, this should continue to be a good way to invest a portion of our savings over the long term. 

Following a similar strategy with international stocks (companies based outside of the country e.g, United States and others) for some of our savings would also seem to make sense (in this way, we could own businesses whose profits might not be as dependent on our local economy or our local currency)

QL at a glance


Wednesday, 28 February 2024

PPB at a glance


MYEG at a glance


INARI at a glance


THPLANT at a glance


BMGREEN at a glance


A Check-List


CBIP at a glance


HARTALEGA at a glance


Berkshire Hathaway Inc. 2023 Shareholder Letter


Operating Results, Fact and Fiction

Let's begin with the numbers. The official annual report begins on K-1 and extends for 124 pages. It is filled with a vast amount of information - some important, some trivial.

Among its disclosures many owners, along with financial reporters, will focus on page K-72. There, they will find the proverbial "bottom line" labeled "Net earnings (loss)." The numbers read $90 billion for 2021, ($23 billion) for 2022 and $96 billion for 2023.

What in the world is going on?

You seek guidance and are told that the procedures for calculating these "earnings" are promulgated by a sober and credentialed Financial Accounting Standards Board ("FASB"), mandated by a dedicated and hard-working Securities and Exchange Commission ("SEC") and audited by the world-class professionals at Deloitte & Touche ("D&T"). On page K-67, D&T pulls no punches: "In our opinion, the financial statementspresent fairly, in all material respects (italics mine), the financial position of the Company . . . . . and the results of its operations . . . . . for each of the three years in the period ended December 31, 2023"

So sanctified, this worse-than-useless "net income" figure quickly gets transmitted throughout the world via the internet and media. All parties believe they have done their job - and, legally, they have.

We, however, are left uncomfortable. At Berkshire, our view is that "earnings" should be a sensible concept that Bertie will find somewhat useful - but only as a starting point- in evaluating a business. Accordingly, Berkshire also reports to Bertie and you what we call "operating earnings." Here is the story they tell: $27.6 billion for 2021; $30.9 billion for 2022 and $37.4 billion for 2023.

The primary difference between the mandated figures and the ones Berkshire prefers is that we exclude unrealized capital gains or losses that at times can exceed $5 billion a day. Ironically, our preference was pretty much the rule until 2018, when the "improvement" was mandated. Galileo's experience, several centuries ago, should have taught us not to mess with mandates from on high. But, at Berkshire, we can be stubborn.

Make no mistake about the significance of capital gains: I expect them to be a very important component of Berkshire's value accretion during the decades ahead. Why else would we commit huge dollar amounts of your money (and Bertie's) to marketable equities just as I have been doing with my own funds throughout my investing lifetime?

I can't remember a period since March 11, 1942 - the date of my first stock purchase - that I have not had a majority of my net worth in equities, U.S.-based equities. And so far, so good. The Dow Jones Industrial Average fell below 100 on that fateful day in 1942 when I "pulled the trigger." I was down about $5 by the time school was out. Soon, things turned around and now that index hovers around 38,000. America has been a terrific country for investors. All they have needed to do is sit quietly, listening to no one.

It is more than silly, however, to make judgments about Berkshire's investment value based on "earnings" that incorporate the capricious day-by-day and, yes, even year-by-year movements of the stock market. As Ben Graham taught me, "In the short run the market acts as a voting machine; in the long run it becomes a weighing machine."