
Sunday, 28 August 2011


US Home Prices and Income, 1987 – 2008
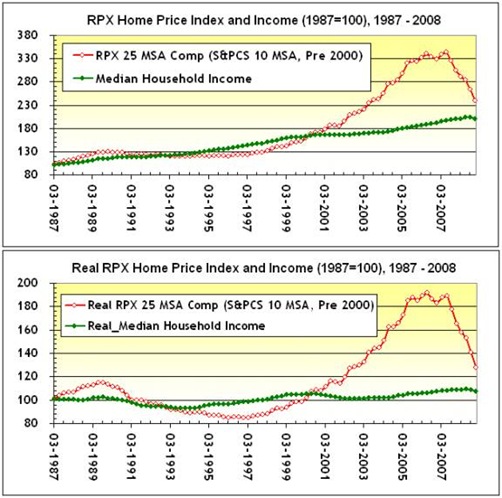
Home Prices and Income, 1987 – 2008, Nominal [top] and Real [bottom]
As the bottom chart of inflation-adjusted home prices and income demonstrates, even as real household income meandered along a relatively flat path, home prices exploded after 2001. This was due, in part, to:
- A steep yield curve;
- The widespread use of ARMS;
- Flexible mortgage underwriting standards; and
- Mortgage product innovations (subprime, Alt-A, Option ARMs).
All of the above encouraged home ownership. By 2006, prices had peaked, and began to correct.


Benefiting from Investor Over-reaction in major market crisis
Many investors overreact during times of crises. Retail investors especially tend to panic and sell out at the bottom and then buy at the top when the market rebounds. The fear of losing out on a rally and recoup some of their losses forces them to act this way. This classic scenario occurred in the aftermath of the recent financial crisis.After seeing their portfolio values decline consistently for many months some investors threw in the towel and sold out right when the market was hitting the lows in March 2009. These investors couldn’t be more wrong. From the lows of March 10, 2009 the S&P 500 rallied a spectacular 80% by April of 2010. The moral of the story here is that investors should not panic and sell out when the market is already down significantly. The market rewards patient investors who hold investments for the long-term as opposed to trying to time the market in the short-term for a quick profit.

In general, how does the markets perform post major crises?
The chart below shows the 1-year and 2-year returns of Dow Jones Industrial Average(DJIA) after 12 major post-war crises:
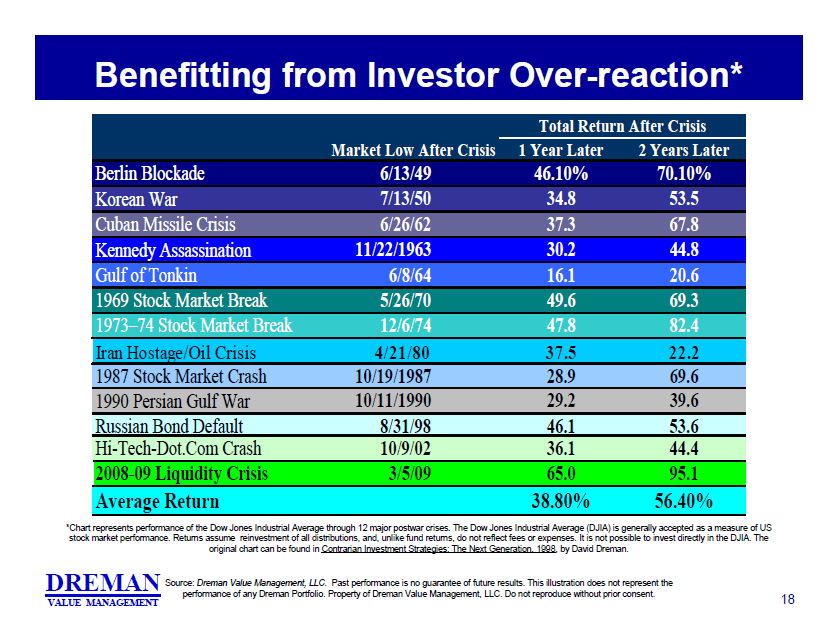
The returns assume reinvestment of dividends and distributions. Similar to the S&P 500, the Dow Jones Index gained 65% and 95% in 1 year and 2 years respectively after the 2008-09 global financial crisis. Overall the index was up by double digits in the periods mentioned after each of the crises shown in the chart above.
http://topforeignstocks.com/2011/06/25/stock-market-performance-post-major-crises/
Phrases of Market Phases
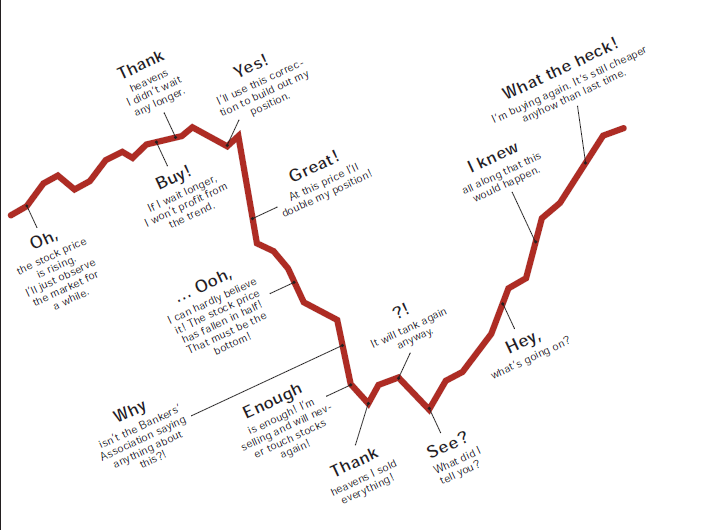
Investing in the markets is not suitable for everyone.One should have a strong stomach when markets dive and not get carried away with greed when markets soar.The chart shows the various stages of emotions that most investors experience with investing in equities.
http://topforeignstocks.com/category/strategy/page/2/


Subscribe to:
Posts (Atom)