Friday, 3 October 2025
Summary of Security Analysis by Benjamin Graham (6th Edition)
Individual summary of each chapter in Benjamin Graham's *Security Analysis* (6th Edition). This classic text is divided into parts; we'll follow that structure.
---
### **Introduction & Part One: Survey and Approach**
#### **Chapter 1: The Scope and Limitations of Security Analysis**
* **Core Focus:** Defining the very essence of security analysis and its boundaries.
* **Key Takeaways:**
* Security analysis is the detailed examination of facts to form a reasoned judgment on a security's attractiveness and intrinsic value.
* It involves three functions: **Descriptive** (gathering facts), **Critical** (evaluating facts), and **Selective** (making a buy/sell judgment).
* The central concept is **Intrinsic Value**—the value justified by a company's assets, earnings, and dividends—which is distinct from its often-irrational market price.
* The famous analogy: the market is a **"voting machine"** (driven by sentiment) in the short run, but a **"weighing machine"** (reflecting intrinsic value) in the long run.
* The critical principle to combat uncertainty is the **"Margin of Safety"**—only investing when the price is significantly below the calculated intrinsic value.
#### **Chapter 2: Fundamental Elements in the Problem of Analysis**
* **Core Focus:** Identifying the four relative factors that define any analytical decision.
* **Key Takeaways:**
* No security is good or bad in isolation. Its merit depends on the interplay of four elements: **The Security, The Price, The Time, and The Person** (the investor).
* **Price is paramount.** A superb company can be a poor investment at an inflated price, and a mediocre company can be excellent at a deep discount.
* Analysis must prioritize **Quantitative Factors** (measurable data like assets and earnings) over **Qualitative Factors** (subjective assessments like management quality), as the latter are often speculative and already reflected in the price.
#### **Chapter 3: Sources of Information**
* **Core Focus:** Outlining the essential sources of reliable data for analysis.
* **Key Takeaways:**
* The analyst must be a thorough investigator, relying on **official and verifiable sources**.
* The most important documents are **Annual Reports** and **SEC Filings (10-K, 10-Q)**, which contain audited financial statements.
* Understanding the specific **terms of a security** (from its indenture or charter) is crucial.
* Additional sources include financial manuals (e.g., Moody's) and trade publications for industry context.
* The analyst's role is **critical**: they must read the fine print and verify figures, not just accept information at face value.
---
### **Part Two: Fixed-Value Investments**
*This section focuses on bonds and preferred stocks, investments intended to preserve capital and provide steady income.*
#### **Chapter 4: The Unsecured Bond and the Selection of Fixed-Value Investments (Summary)**
* **Core Focus:** Establishing the criteria for selecting safe fixed-income investments.
* **Key Takeaways:**
* Safety is not determined by the *name* of the security (e.g., "bond") but by the **issuer's financial capacity to pay**.
* The primary test for safety is a **history of substantial earnings** above interest requirements, not the presence of physical collateral.
* Graham introduces quantitative standards (e.g., earnings coverage ratios) to measure this safety buffer.
#### **Chapter 5: The Selection of Fixed-Value Investments: Second and Third Principles (Summary)**
* **Core Focus:** Introducing additional, qualitative principles for bond selection.
* **Key Takeaways:**
* **Second Principle: The "Human Factor":** The competence and integrity of the management team matter, though this is difficult to quantify.
* **Third Principle: The "Margin of Safety":** This principle is just as critical for bonds as for stocks. The investor must ensure the company's value is well in excess of its debt.
#### **Chapters 6-9: Specific Applications (Summary)**
* **Core Focus:** Applying the core principles to various types of fixed-income securities.
* **Key Takeaways:**
* These chapters analyze **high-yield bonds**, **preferred stocks**, and other senior securities.
* They demonstrate how to apply earnings coverage tests and asset-value tests in different scenarios.
* A key insight is that a **preferred stock** should be analyzed with the same rigor as a bond, as it is also a fixed-value investment.
---
### **Part Three: Senior Securities with Speculative Features**
*This section covers securities that are a hybrid, having both fixed-income and speculative characteristics.*
#### **Chapters 10-13: Convertible and Privileged Issues (Summary)**
* **Core Focus:** Analyzing securities that offer conversion rights or other privileges (e.g., warrants).
* **Key Takeaways:**
* The value of a convertible security has two components: its **value as a senior security** (bond or preferred stock) and its **value from the conversion option**.
* Graham warns against overpaying for the conversion privilege. The **Margin of Safety** should be based on the security's fixed-income value first and foremost.
* These securities are often issued when straight debt would be difficult to place, signaling potential weakness.
---
### **Part Four: Theory of Common Stock Investment**
#### **Chapter 14: Stock and Stock Profits (Summary)**
* **Core Focus:** Exploring the fundamental nature of common stock and the sources of stockholder profits.
* **Key Takeaways:**
* Challenges the old view that common stocks are inherently speculative.
* Identifies two sources of return: **Dividends** and **Reinvested Earnings** (which boost future earnings and intrinsic value).
* Argues that the intelligent stock investor is a **business owner**, not a share price speculator.
#### **Chapter 15: The Dividend Factor in Common-Stock Analysis (Summary)**
* **Core Focus:** Examining the role of dividend policy in valuation.
* **Key Takeaways:**
* Dividend policy is a major point of analytical controversy.
* Graham analyzes the cases for and against liberal dividend payouts versus profit retention.
* For the analyst, the key is to understand the company's policy and its impact on the stock's intrinsic value and investor appeal.
#### **Chapter 16: The Role of Earnings and the P/E Ratio (Summary)**
* **Core Focus:** Establishing a sound framework for analyzing earnings and valuation multiples.
* **Key Takeaways:**
* **Average Earnings** over a period (e.g., 5-10 years) are more important than a single year's results. This smooths out the business cycle.
* The **Price-to-Earnings (P/E) Ratio** must be examined in the context of average earnings, not just current earnings.
* Warns against projecting recent growth trends far into the future, a common and dangerous speculative practice.
---
### **Part Five: Analysis of the Income Account**
*This section dives into the critical details of the income statement.*
#### **Chapters 17-20: Income-Statement Analysis (Summary)**
* **Core Focus:** Teaching the analyst how to critically dissect a company's profit and loss statement.
* **Key Takeaways:**
* Emphasizes the need to identify and exclude **non-recurring items** (e.g., one-time gains or losses) to discern the true, repeatable earnings power.
* Discusses the impact of **depreciation and amortization** policies on reported earnings.
* Stresses the importance of analyzing a company's results **relative to its industry** and the overall economy.
---
### **Part Six: Balance-Sheet Analysis**
*This section focuses on the importance of asset values.*
#### **Chapters 21-24: Asset-Value Analysis (Summary)**
* **Core Focus:** Explaining how to interpret the balance sheet and the significance of asset values.
* **Key Takeaways:**
* **Book Value** (asset value per share) is a crucial benchmark, especially for identifying "bargain issues."
* The analyst must calculate **Liquidating Value** or **Net-Net Working Capital** (current assets minus all liabilities) to find the ultimate margin of safety.
* A stock selling for significantly less than its net current asset value is, in Graham's view, a compelling statistical bargain.
---
### **Part Seven: Additional Aspects of Security Analysis**
#### **Chapters 25-28: Diversification, Comparison, and Discretion (Summary)**
* **Core Focus:** Covering the final, practical elements of portfolio management and analyst judgment.
* **Key Takeaways:**
* **Diversification** is a cornerstone of risk management, even for undervalued securities.
* Analysts should use **comparison** to rank potential investments against each other.
* The analyst must exercise **informed discretion**, recognizing that quantitative rules are a guide, not a substitute for thinking.
---
### **Part Eight: Global Value Investing (6th Edition Addition)**
*This section, added in the 6th edition, applies Graham's principles in a modern, global context.*
#### **Chapters 29-33: Modern Applications (Summary)**
* **Core Focus:** Demonstrating the enduring relevance of value investing in today's global markets.
* **Key Takeaways:**
* The fundamental principles of **Margin of Safety** and **Intrinsic Value** are timeless and universally applicable.
* Applies the value framework to **emerging markets**, **arbitrage**, and **corporate restructuring** situations.
* Concludes that while markets and instruments have evolved, the disciplined psychology of the value investor remains the key to long-term success.
This comprehensive chapter-by-chapter summary provides a valuable roadmap to this foundational text.
Thursday, 2 October 2025


Wednesday, 1 October 2025
"Buy and Never Sell"
Many people think value investors are long-term investors who "buy and never sell."
When you buy companies with great businesses (with economic moats), you generally do not have to sell and can hold onto them for the long term. *THIS IS PREMISED ON THE COMPANIES' FUNDAMENTALS REMAINING UNCHANGED.*
HOWEVER, YOU MAY HAVE TO SELL UNDER THESE CONDITIONS:
1. THE FUNDAMENTALS CHANGE
2. THE PRICES BECOME TOO EXPENSIVE (OPTIONAL)
3. THERE ARE BETTER OPPORTUNITIES ELSEWHERE.
😀
Thursday, 19 December 2024
MYEG
MYEG
HISTORICAL PERFORMANCE
FY REV NP NPM(%)
2017 372 202 54.2
2018 319 170 53.4
2018 246 -41.4 -16.8
2019 357 175 49
2019 239 130 54.3
2020 532 268 50.4
2021 724 316 43.6
2022 651 399 61.2
2023 774 488 63
2024(3Q) 723 516 71.4
Revenues and Net Profits are in RM millions
PE
Year 2015 to 2020:
It was trading at PEs ranging from 40 to 80.
In 2018, its PE dropped to around 10; this coincided with BN losing its power in that general election.
Year 2020 to 2024:
PE ranged from 10 to 30.
This PE has trended downwards during this period.
On 18.12.2024, it is trading at PE of 10.77 which is at the lowest point in its PE range.
Why? Is it a risky company going forward? Are investors of the opinion its growth might not be so good going forward?
Insiders
CEO Wong Thean Soon has reduced his shareholdings by 67 million shares, and now holds 760.77 million shares.
Dividends
It pays dividends yearly.
The dividends paid in the first half of this decade were higher than those paid in the recent 5 years. Latest dividend was 1.930 sen per share for FY ending 31.12.2023 .
DY of 2.04% at today's price of 0.945 per share.
Financial Information
PE 10.82
ROE 24.73%
P/B 2.68
NTA 0.353
DPO ratio 28%- 29%
Why is MYEG trading at low PE?
Its net profit has increased since 2020.
Maybe we should look at its debts and its FCFs?
Its account receivable has grown faster than its increase in revenues.
A big percentage of its total assets are intangible assets.
All values are in RM millions
YEAR 2019 2020 2021 2022 2023
REVENUE 461 511 703 651 774
EBIT 257 283 332 399 583
INTEREST EXP 7 8 6.7 9.2 40
NET PROFIT 242 269 316 399 488
YEAR 2019 2020 2021 2022 2023
CA 325 551 649 850 1148
NET PPE 314 337 311 390 368
INTANG, ASSETS 18 18 343 783 1226
TOTAL ASSETS 1030 1417 1884 2540 3218
TOTAL EQUITIES 708 1143 1541 1872 2200
TOTAL LIAB. 322 274 342 668 1017
AR 219 241 372 663 700
ST DEBT 49 48 68 158 152
LT DEBT 137 123 98 325 728
TOTAL DEBT 186 171 166 483 880
DIVIDENDS 66 87 79 45 47
YEAR 2019 2020 2021 2022 2023
NOCF 154 295 121 304 502
CAPEX(F.A.+ OTH) 70 52 285 542 482
CAPEX(F.A.) 70 52 42 75 14
CAPEX(OTHER A.) - - 243 467 468
FCF 84 243 -164 -238 20
Wednesday, 18 December 2024
Creating new S-curves - developing new engines of growth - ideally before the current cycle of growth reaches maturity.
Every business goes through the S-curve cycle of growth:
- infancy (low growth),
- expansion (rapid growth) and
- maturity (slow growth).
No matter how successful the product is, growth must slow at some point (maturity phase), due to a number of reasons:
- increased competition,
- market saturation,
- technology disruption,
- regulatory changes and
- changing consumer preferences.
VALUE CREATION OR DESTRUCTION: MANAGEMENT'S ROLE
Ultimately, whether a company remains VALUE CREATIVE OR DESTRUSTIVE, depends on how well management understand this inevitability, its mindset and how successful it is in creating new S-curves - developing new engines of growth - ideally before the current cycle of growth reaches maturity.
New S-curves could include
- tapping into new selling channels and geographies for the existing products, or
- it could be expansion into a related business - for instance, starting a new product line and going upstream or downstream, or
- diversification into something entirely different and unrelated.
In short, the S-curve is dynamic over the company's life, that is, the company should continuously reinvent, reinvest and create new S-curves to start new growth cycles.
We see real-life examples of how this is done every day.
Companies starting new S-curves to start new growth cycles:
QL started Family Mart
YTL Power entered a new S-curve selling power to Singapore and enters the AI related sector.
Padini started Brands' Outlets.
Scientex growing its manufacturing business organically and through acquisitions and entering the property development sector business successfully.
KGB supplying its products to many industries and to many countries.
Facebook promoting Metaverse (but unsuccessfully).
Microsoft branching into cloud computing and AI.
Amazon continues to reinvent itself, selling books initially, and now selling almost everything. (Many new S-curves)
Of course, growth comes with a price too.
Some growths can be good and some can be very bad for the companies.
Shareholder wealth in a company is destroyed with failure to find new S-curve.
With no growth or business in decline, value of company shrinks (contracting PE x lower EPS); value is destroyed.
There are many companies in Bursa Malaysia in this category.
Companies that have STEEPER S-curve cycle of growth with LONGEVITY will also trade at .HIGHER valuations

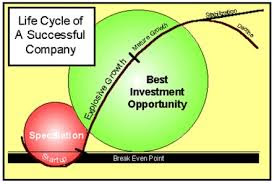
Savvy investors know about the corporate life cycle:
- start-up,
- rapid growth phase,
- mature growth phase,
- stagnation or outright decline.
Companies in their startup phase lose money.
If they're successful, though, they enter a rapid growth period, where sales - and eventually profits - shoot upward.
Then, alas, comes the point when the company has exhausted all of the easy growth opportunities. The low-hanging fruit has been picked. The company enters a mature phase in which sales maybe growing, but at a much slower rate than before.
Finally, in a company's dotage, it's all management can do to grow the company at all. The company's either in stagnation or outright decline.
Best time to invest is during its explosive growth phase or the mature slower growth phase of a successful company. Emphasis: growth phase.
S-curve cycle of growth
Every business goes through the S-curve cycle of growth:
- infancy (low growth),
- expansion (rapid growth) and
- maturity (slow growth).
Different businesses have a different S-curve shape and longevity.
Some S-curves will be steeper (stronger rates of growth) than others due to major innovation (e.g. Nvidia) that drives rapid adoption and demand across multiple market segments (market size).
Some S-curves will have greater longevity, that is, sustained high growth (expansion phase) for a longer period of time (e.g Amazon, Apple, Facebook) for a longer period of time because of, intellectual property protection or strong network effects. These have enduring competitive advantage.
Companies that have steeper S-curve with longevity will also trade at higher valuations.
Personal finance. Know your enemy - Mr. Inflation. Know your friend - Mr. Compounding
You have to invest. Inflation is the enemy of your cash. Compounding is the friend of your cash. You do not have a choice but to invest for the long term. The purchasing power of your cash continues to be eroded by inflation.
You have no choice but to be educated on investing. Either you invest on your own or you invest through a fund, you will still require an education on investing, to be able to do so intelligently on your own or even to know how to use or work with your fund managers.
The earlier you obtain this education, the better.
Sadly, the schools during my time, and perhaps even now, do not teach financial and investing knowledge. Personal finance is a subject that one should quickly learn from others or on your own. There are simple books to get started on this subject, easily available in the book shops. The introduction books on this subject for the first year university students are worth looking at.
Only one definition for valuation: the discounted cash flow
The most popular valuation metrics are
- Price/Earnings,
- Price/Ebidta,
- Price/Sales,
- Price/Book value and
- EV/Ebitda. (EV or Enterprise Value = Market cap + Debt).
Many different methods as listed above are used to arrive at the valuation for stocks.
However, remember that there is ever only one definition for valuation: the discounted cash flow.
All the above metrics are merely short forms or shortcuts for discounted cash flow.
These metrics are widely used because they are easier to compute and understand, and can be compared across companies, sectors and markets.
Critically, while these shortcut metrics are useful, they are insufficient and sometimes, can be misused to present a false picture
Tuesday, 17 December 2024
Companies trading at below net cash. Opportunity or value trap?
Companies that are trading at negative enterprise value (EV)
EV = market value of common stock + market value of preferred equity + market value of debt + minority interest - cash and investments.
Why is the market having a very negative perception of the company's future prospects (rightly or wrongly), governance and/or believe the cash is not real?
Some of these companies are simply too small, and not tradeable.
Some are shell companies waiting for a corporate exercise.
There are many reasons:
Fake bank statements
It is very hard to fake bank statements and accordingly, net cash on the balance sheet. But if the monies are located offshore, this might not be the case.
Recall, several China based companies, such as China Stationery and Xingquan International Sports Holdings previously listed on Bursa. Investors were badly burnt, following revelations of massive accounting irregularities - including the reported cash going missing and discovery of previously unknown (un-authorised) loans. When something appears too good to be true, it often is.
Poor corporate governance
The integrity of management and controlling shareholders is a key factor for investors when valuing stocks and this is reflected in the stock price.
Investors lack of confidence maybe when investors expect that the cash - even though real - could be used in a way that is not in the interests of minority shareholders. It has happened time and time again.
Contingent liabilities
Existing cash on the balance sheet could be whittled away by contingent liabilities, when the market anticipates imminent payments for retrenchment exercises, lawsuits and so on.
Persistent loss-making and negative cash flows from operations
When a company is persistently loss-making and importantly, suffers negative cash flows from operations - whether due to idiosyncratic issues and/or broader economic downturn - that too will eat into its cash hoard. If the market has a downbeat outlook for the company's prospects, it will place a big discount on the stock.
Time to monetisation factor
Oftentimes, companies trade at discounts to their net cash and more broadly, the value of their underlying assets, because of the "time to monetisation" factor. It takes many years to translate an asset into earnings, cash flows and returns to shareholders.
Absence of powerful activist shareholders
There was no EV company among components of the S&P's 500 index and only a handful of very small companies in the Russell 3000 Index. This could be attributed to the presence of powerful activist shareholders in a mature market. The absence of activist investors may well be the problem for Bursa.
Time to Monetisation
Often, companies trade at discounts to their net cash and more broadly, the value of their underlying assets, because of the "time to monetisation" factor.
Investors are generally not patient enough to wait for asset value to crystallise.
An example:
Many property companies are currently trading below their book values, not for any of the ominous reasons, but simply because they are land-banking. The land is valuable but it takes many years to be developed and translated into earnings, cash flows and returns to shareholders.
In these cases, opportunity arises when the company unlocks the value of its assets,
- usually coinciding with the emergence of new substantial shareholders or activist investors, or
- when the company undertakes a major strategic change and restructuring or
- the privatisation of a listed entity.
Summary
One of the biggest risks for buying stocks priced far below their net asset values is time to monetisation.
But they could be deep-value stocks, trading at less than net cash in hand and likely to have limited downside risks. Patient investors may well be handsomely rewarded, over time.
Monday, 16 December 2024
Hidden debts. How to analyse companies with hidden debts.
If you are thinking of investing in the shares of airline, rail or retail companies, and many others, you need to understand of the biggest risks that you will face as a shareholder - hidden debts.
By understanding what hidden debts are and how to analyse companies that have them, you will make better investment decisions and take on less risk.
Retail company with big future rent commitments
Where a company has big future rent commitments, there are 2 useful things you can do:
1. Calculate a company's fixed charge cover.
2. Calculate the capitalised value of operating leases.
1. Fixed charge cover
Fixed charge cover = (EBIT + operating lease expense) / (net interest + operating lease)
A result within the range of 1.5 to 2 is not unusual.
Fixed charge cover of 1.3 times is the lowest level investors should tolerate, as the risk of financial distress becomes significant below that level.
Fixed charge cover has been a great way to spot retailers in trouble in the past, such as HMV, Game Group and Woolworth. These companies did not have huge amounts of debt on their balance sheets, but the rental commitments crippled them when profits start falling.
In 2005, Woolworth's fixed charge cover was only 1.3 times which was right at the limit of what is normally comfortable. Once profits started to fall in the following year, the company was in the danger zone. By 2007, the company's finances were close to breaking point. It filed for bankruptchy in January 2009. Prudent investors would not have invested even in 2005.
For the year to December 2015, Domino's had normalised EBIT of Sterling 73.6m, rental expenses of Sterling 21.3m and normalised net interest expenses of Sterling 0.02m. Its fixed charge cover was therefore:
(73.6 + 21.3) / (0.02 + 21.3) = 4.5 times
This is a healthy figure.
Domino's fixed charge cover has been consistently healthy despite the rapid growth in new stores. As the profitability of new stores increases, the fixed charge cover should improve.
Domino is a franchising business. It sublets the building it is renting out to its franchisees: the franchisee commits to pay the rent. This gives it an extra level of protection and explains why its fixed charge cover is not a matter for concern.
2. Capitalising the value of operating leases
There are two ways to estimate the value of hidden debt by taking an approach that is referred to as capitalising operating leases. In other words, you are working out what the total amount of the future liability might be in today's money.
a) The first way is to discount the future lease commitments to their present value using an interest rate similar to the interest rate paid on existing borrowings.
b) A quicker way, used by the credit rating agencies. Multiply the current annual rental expenses by a multiple between 6 and 8. (Use this which is simpler and much more straightforward).
Using the simpler method of multiplying by a number between 6 and 8 with the company's annual rental expense. Look for this in the annual accounts labelled "operating lease payments" or something similar.
For example, for 2015, the lease or rent expenses for Domino's was Sterling 21,313m.
Sterling m 2015 2014
Rent expense 21,313 20,874
Capitalised at 8x 170.5 167.0
Capitalised at 7x 149;2 146.1
Capitalised at 6x 127.9 125.2
Domino's hidden debts has evolved over the years. They have been growing as the company has opened more Pizza shops.
How are these calculations useful to an investor?
The impact on ROCE
Many retailers rent rather than own their high street stores, which means they have a lot of hidden debts.
Without taking these debts into account these companies can look like very good businesses with very high ROCEs. Once the debts are factored in, this changes.
There is nothing wrong with investing in companies with hidden debts, but it makes sense to ensure that they pass the tests of quality and safety, meaning:
- a minimum adjusted ROCE of 15%.
- a minimum fixed charge cover of at least 2.
Example
All in Sterling
Company Next WH Smith
Capital employed 1501.9 188.0
Lease adjusted Capital employed 3004.1 1987.0
Estimated hidden debt 1502.2 1799.0
ROCE (%) 60.2% 33.2%
Lease adjusted ROCE 33.2% 12.9%
Using Lease adjusted ROCE gives you a truer picture of a company's financial performance. In most cases, ROCE will decline when hidden debts are included.
Once the hidden debts are factored in, ROCE changes. In the above example, Netx still looks good, but WH Smith sees a big fall in ROCE.
Be wary of sale and leasebacks
In recent times, one of the easiest ways for companies to raise cash has been to sell some of their properties to property companies or investment funds and then rent them back. This is known as a sale and leaseback transactions.
For supermarket companies, such as Tesco, this was a big warning sign that all was not well.
Without the cash proceeds from selling supermarket stores to property companies, Tesco would have been struggling to find the free cash flow to pay dividends or invest in its business. The cash inflow from property sales made it look as if Tesco's debt was nothing to worry about, but the off-balance sheet debt ((Tesco's future rent obligations) increased at a rapid rate from 2005 to 2013.
After selling a number of its stores, Tesco tied itself into long-term rent agreements for stores that aren't as profitable as they used to be. This was one of the main reasons why Tesco had to stop paying a dividend in 2015. Trying to get out of these rented stores could prove to be very expensive for Tesco in the future. This is a good example of why investors ignore hidden debt at their peril.
Saturday, 14 December 2024
DEBTS are often neglected in company analysis and valuations. Red flags.
Look out for companies that report consistent profits but also a substantial rise in gearing, which would indicate negative FCF.
Receivables and/or inventories rise even faster than increasing sales
This is usually the case when companies report increasing sales but where receivables and/or inventories rise even faster.
If a company's receivables grow at a much faster rate than revenue, it will suffer net cash outflows, which have to be funded with increasing debt (or cash calls). It can continue to report steady profits for many years - even as the company is being crushed by mounting debt and interest expenses. Investors who are fixated on earnings would not realise the looming issue until it is too late.
Paying dividends in excess of cash flow from operations
Companies that pay dividends in excess of cash flow from operations may also warrant a red flag.
This is the danger when management's interest are not always aligned with that of shareholders. The fact is that management remuneration/incentives are usually based on profitability and share price gains, which encourages short-termism and risk-taking, including using leverage to boost earnings. Anecdotal evidence shows that high dividends/share buybacks tend to lead to higher share prices.
Indeed, sometimes not all shareholder's interests align either. Some are short term, preferring dividends/share buybacks while longer-term-minded investors would prefer companies to conserve cash for future opportunities and/or pay down their debts.
Borrowing to invest in productive assets
Companies necessarily reinvest for the future, funded with internally generated funds and/or borrowings and equity cash calls. Borrowing to invest in productive assets that will generate future cash flows is perfectly fine - as long as the increased risks that come with it are understood and properly taken into consideration.
Company with less debts is less risky and better positioned
Company that pay off its debts would be better positioned to withstand any unexpected economic and financial shocks - thereby making it the safer investment. It would be better able to capitalise on future opportunities - for example, mergers and acquisitions, relative to its competitors which large debts, thanks to its stronger balance sheet.
Conclusions
There will always exist a trade-off between risks and rewards. It is important to analyse both aspects in tandem.
There is nothing wrong if you choose to go for the higher returns, provided you also understand the risks and can stomach the potential losses.
Some investors are risk takers, others are more risk-averse, but the smartest investors make informed decisions.
Earnings are not equivalent to cash flows
These metrics rely on reported profits or earnings rather than cash flows:
P/E
P/EBITDA
P/S
P/BV
EV/EBITDA
Profits may not reflect the actual underlying cash flows.
Some examples:
1. Interest paid on perpetual securities (perps)
- These are not considered interest expense, thereby inflating profits.
- At the same time, accounting for perps as equity also understates the company's actual gearing.
2. Companies can capitalise interest expense as assets in certain circumstances
- Interests during construction of assets or when property developers borrow to purchase land for future development.
- This would understate expenses and inflate profits and book value.
3. Companies can be in total compliance with financial reporting standards but still be misleading
- A company is allowed to recognise construction revenue from in-house concessionaires based on estimated fair values of future income streams under the long-term agreements. This revenue is recorded as financial receivables/intangible assets on the balance sheet.
- When the concession asset commences operation, cash flows generated from the asset are recognised as sales, while the operating costs include amortisation of the financial receivables/intangible assets.
- Basically, companies report earnings even when there is no cash flow during the construction period, and then actual cash flows are higher than reported earnings when the asset is in operation.
- In short, reported earnings have little relationship to the actual cash flows.
It is far easier to manipulate profits than cash flows, unless the bank statements are also falsified.
Management faked sales invoices or "pre-billings"
- This is to inflate sales, Ebitda, profits and book values - to give the impression that the company was worth more than it really was.
- As such, scrutinising the Cash Flow Statement - which shows the sources and applications of cash, tying the cash balance at the start and end of the financial period - can be more informative than the popular Profit and Loss Statement.
Ignoring the risk of debt
Also, most of these metrics often measure earnings against market capitalisation.
- For instance, the P/E ratio attributes value to the earnings - but ignores the risks of debt used to generate those earnings.
- This omission can have serious consequences for investors.
- A company with debts may appear to have more attractive valuations but this come with higher risks, which are not immediately evident and therefore, not properly accounted for, simply by looking at the Profit & Loss statement.
- When companies have to borrow to service debts, the situation will, often spiral rapidly out of control.
Ref: Tong's Portfolio 2 It's all a matter of trust
Tuesday, 10 December 2024
The last Malaysian property boom in 2012 - 2015.
During this period, a friend of mine worked half the time and the other half, he was busy speculating and flipping properties. He declared he made more in "flipping" properties than his income from actual professional work during that period.
DIBS induced property boom in the early 2010s
This was driven by massive speculative activities on the back of the Developer Interest Bearing Scheme (DIBS) that was introduced in 2009.
The scheme allowed developers to absorb all the interest costs on mortgages during the construction period. This significantly reduced the cost for house buyers during construction, thereby boosting demand.
Also, developers imputed the additional financing costs into their selling prices, thereby artificially inflating property prices.
The artificially inflated property prices and reduced upfront costs gave buyers (speculators) further leverage and bigger profits on a quick flip of the property upon completion.
Housing quicly became unaffordable
It soon became clear that the steep increase in property prices was a growing problem - housing quickly became unaffordable.
The DIBS scheme was abolished in Budget 2014.
Demand promptly collapsed.
The steep price increases between 2012 and 2015 were in effect pulled forward gains, resulting in stagnant house prices in subsequent years.
It took the property market years to recover from the DIBS bubble burst.
The demand-supply dynamics are finally improving.
Housing (Un)affordability in Malaysia
Housing (Un)affordability
Based on the Medium Multiple approach, as recommended by the World Bank as well as the United Nations.
House price-to-income ratio
Severely unaffordable 5.1 & above
Seriously unaffordable 4.1 - 5.0
Moderately unaffordable 3.1 - 4.0
Affordable 3.0 & below
House prices in Malaysia are seriously unaffordable across most states
a. Median house price (2020) RM 295,000
b. Annual median income (2020) RM 62,508
Malaysia's house price-to-income ratio = a / b = 4.7 (In 2019: 4.1)
Reasons for housing unaffordability
Housing is unaffordable because many do not earn enough and are already highly indebted.
House prices (+4.1%) grew faster than income (+2.1%).
Households have low savings buffer: 76% (3/4) of households have savings that can only cover less than 3 months living expenses.
Prospective borrowers are already highly indebted: 65% (2/3) of borrowers already have either car or personal loans, which may constrain their capacity to take on a housing loan.
There are also not enough affordable homes
1 in 3 newly launched are priced < RM 300,000
3 in 4 households earn < RM 100,000/year
- To afford a house priced up to RM 300,000*, a household needs to earn RM 100,000/year# or RM 8,333/month.
- 76% (or 3/4) of households in Malaysian earn < or = RM 8,333, but only 36% (or 1/3) of newly-launched units are priced < or = RM 300,000.
Reference:
*Based on the National Affordable Housing Policy 2019, the maximum price of affordable housing in Malaysia is RM 300,000.
#Estimated using Median Multiple approach, in which a house is deemed affordable if the house price is not more than 3 times the annual income.
Source: Bank Negara Malaysia. Household income estimates and incidence of poverty report (2020)by the Department of Statistics, Malaysia (DOSM).
Buying a house to stay in is better than renting one, no question.
The math remains strongly in favour of home ownership versus renting.
In the long run, the comparative value of owning a home far exceeds that of renting.
This is the case even when the rental yield (rental as a percentage of house value) is lower than the mortgage rate, primarily because both the rental and house prices will rise in tandem with inflation, at least.
This means that the cost of renting (an expense) will keep rising while home ownership is an asset whose value will appreciate with time.
Monday, 9 December 2024
US dollar hegemony
As World War II was coming to an end, 44 Allied nations met in July 1944 in New Hampshire, the US, to design a new set of rules that would govern the post-war international monetary order.
1994: Bretton Woods Conference
In 1944, the US dollar officially became the world's reserve currency. The Bretton Woods Conference pegged all other currencies against the US dollar. To ensure confidence in the system, the US dollar itself was convertible to gold at a fixed rate of US$35 an ounce. The US at that time, held some three-quarters of the world's official gold reserves.
The system worked well enough in the initial years, on the back of robust demand for US goods and services from Europe and Japan for their post-war rebuilding efforts.
1960s: Balance of payments crisis emerged
It started to fray going into the 1960s, when European and Japanese exports became more competitive and the US share of world output declined. Huge military spending during the Vietnam War further pushed the US into persistent deficits. Demands for the US to balance its budget were ignored.
A balance of payments crisis emerged. Official US dollar liabilities held overseas mounted, exceeding its gold stock multifold - the US dollar was overvalued. By the second half of the 1960s, European nations demanded gold for their US dollar holdings, creating a run on US gold reserves.
1971: End of Bretton Woods and end of gold convertibility
With rising inflation, unemployment, a weakening US dollar and the risk of running down all of its gold reserves, President Richard Nixon ended gold convertibility on Aug 15, 1971. This also, effectively ended the Bretton Woods system. He imposed a wage and price freeze to control inflation and levied import tariffs to boost US production and jobs. The US dollar crashed and the world "stagflation" was coined.
The international monetary system transitioned from a gold standard to one based on pure fiat money, backed not by any underlying assets with intrinsic value but by faith in the US government. It was due in no small part, to the rise of "petrodollar" in the 1970s.
1974: Rise of Petrodollar - "oil for dollars"
In 1974, Saudi Arabia made a deal with the Nixon administration that includes the condition that all its oil exports would be traded exclusively in US dollars. This "oil for dollars" was later embraced by other by other members of the OPEC. Given oil's critical importance in every economy, this all but cemented the US dollar's position as the pre-eminent medium of exchange as well as store of value. The recycling of petrodollars into US dollar-denominated assets, including Treasury bonds, further anchored its reserve currency status.
Over time, US dollar dominance extended to the entire commodities complex and the rest of the world. Today, central banks typically hold about two-thirds of their foreign reserves in US dollar assets.
US enjoys an "exorbitant privilege".
US dollar as a world reserve currency allows US to enjoy an "exorbitant privilege".
The insatiable demand for US dollar allowed the US to sustain the world's largest current account deficit, with no negative consequences. The US is able to finance ever-growing fiscal spending with cheap borrowings - to keep building on its military superpower status, fortify its unparalleled influence in economics, finance and technology, pursue expansive social programs, support American consumerism and elevate living standards for its population, all the time compounding the positive feedback loop.
Many believe that the US dollar hegemony has driven American foreign policy over the years. This US exceptionalism was paid for largely by the rest of the world. Its dominance is a legacy of the Bretton Woods system, which it created nearly eight decades ago. Will this remain the case 20 years from now?
Reference: Tong's Portfolio 2 Its all a matter of trust
Friday, 6 December 2024
Relative and Absolute Price Earnings Ratio
Relative PE ratio
Relative PE ratio moves up because people expect either the industry or the company's prospects to be better relative to other securities than they have been than their preceding view and that can turn out to be justified or otherwise.
Absolute PE ratio
Absolute PE ratio moves up in respect to the earning power or the perspective earning power of that is viewed by the investing public of the future returns on equity and also in response to changes in interest rates.
Warren Buffett
Thursday, 5 December 2024
Bacteria and Bricklayers
Bacteria and Bricklayers
Bacteria
In bacteria populations, growth is fixed. Subject to the resource constraints of the environment they inhabit, bacteria grow at a constant rate indefinitely.
A simple example to illustrate the point:
Let's say we have some bacteria that reproduce on a fixed time schedule, one doubling per minute to keep the numbers simple.
We start with a single bacteria cell. After one minute, we'll have two bacteria. With time, the population grows as such:
- 1
- 2
- 4
- 8
- 16
- ...
Now we ask the question, how fast does our bacteria population grow (in percentage terms)?
The minute-over-minute growth rate is: 1 or 100%.
This is an example of perfectly compounding growth, also referred to as exponential or geometric growth.
Put simply, how fast the bacteria grow is entirely independent of population size. In other words, growth and scale are perfectly uncorrelated.
Importantly, most things do not work this way.
Layering on
Let's look at another example - constructing a brick wall.
Assume a bricklayer can lay 10 bricks per hour. The brick count will proceed as follows
- 0
- 10
- 20
- 30
- 40
- ...
The brick count grows by 10 bricks per hour.
Going through the same growth rate calculations from above: initially we are growing the brick count quite fast - 100% in fact. But by the time we reach 30 bricks, our forward-looking growth rate has fallen to 33%. At 100 bricks, we'll only be growing 10%.
Notice that the growth rate depends on how many bricks we've already laid. This is linear or arithmetic growth. Because the number of bricks laid each hour is static through time, growth (in percentage terms) necessarily slows down. Scale is in the denominator. Therefore, growth and scale are negatively correlated: more scale -> less growth.

Subscribe to:
Posts (Atom)