Saturday 8 August 2020

You Don't Understand Compound Growth

 You Don't Understand Compound Growth

Einstein once (supposedly) said:

Compound interest is the most powerful force in the universe

Of compound interest, Warren Buffet proclaims:

Over time it accomplishes extraordinary things

Compound interest, or growth, is one of the, if not the most, powerful and impactful forces in nature.

And yet, it is also one of the most consistently misunderstood in the world of business.

How so?

Simply, we misapply the term "compound growth" to things that do not actually grow in compound fashion.

Let's first establish what "compound growth" even means.

I propose the following operative definition:

Compound growth ~ constant growth

The fact is, very few objects, organisms or organizations can sustain truly compounding growth over any extended period.

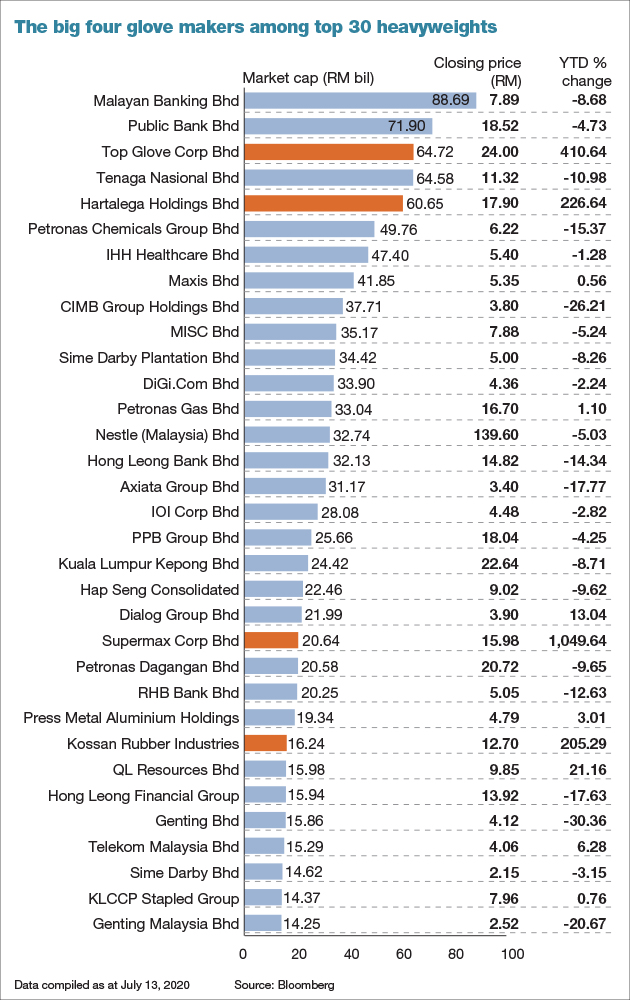
From an observer's or investor's perspective, it's quite easy to fool yourself into thinking compound, exponential growth is much more common than it really is. And it's understandable given how often the term is thrown around. Firms in fleeting phases of fast growth can visually demonstrate their breakneck pace with the ubiquitous, infamous "hockey stick" chart.

Who could argue with that?

As an entrepreneur or operator, you too can fall prey to your own fictions - convincing yourself you've "cracked the code" when you've only really cracked the piggy bank. Irrational exuberance eventually turns concave, finally ending in a plateau of linearity.

Through some examples, I hope to demonstrate that compound growth 1) implies constant growth 2) is exceedingly rare and 3) is incredibly important to building a large, valuable business.

But before we get to business, let's talk about - bacteria.

Bacteria and Bricklayers

Bacteria

In bacteria populations, growth is fixed. Subject to the resource constraints of the environment they inhabit, bacteria grow at a constant rate indefinitely.

A simple example to illustrate the point:

Let's say we have some bacteria that reproduce on a fixed time schedule, one doubling per minute to keep the numbers simple.

We start with a single bacteria cell. After one minute, we'll have two bacteria. With time, the population grows as such:

  • 1
  • 2
  • 4
  • 8
  • 16
  • ...

Now we ask the question, how fast does our bacteria population grow (in percentage terms)?

The number of bacteria cells one minute from now is:

nt+1=2nt

Which implies the minute-over-minute growth rate is:

nt+1nt1=2ntnt1=21=1

or 100%.

This is an example of perfectly compounding growth, also referred to as exponential or geometric growth.

Put simply, how fast the bacteria grow is entirely independent of population size. In other words, growth and scale are perfectly uncorrelated.

Importantly, most things do not work this way.

Layering on

Let's look at another example - constructing a brick wall.

Assume a bricklayer can lay 10 bricks per hour. The brick count will proceed as follows

  • 0
  • 10
  • 20
  • 30
  • 40
  • ...

The brick count grows by 10 bricks per hour.

Going through the same growth rate calculations from above:

The number of bricks 1 hour from now will be:

nt+1=nt+10

Which implies hour-over-hour growth is:

nt+1nt1=nt+10ntnt=10nt

Notice that the growth rate depends on how many bricks we've already laid. This is linear or arithmetic growth. Because the number of bricks laid each hour is static through time, growth (in percentage terms) necessarily slows down. Scale is in the denominator. Therefore, growth and scale are negatively correlated: more scale -> less growth.

Sure, initially we are growing the brick count quite fast - 100% in fact. But by the time we reach 30 bricks, our forward-looking growth rate has fallen to 33%. At 100 bricks, we'll only be growing 10% - which is a far cry from our halcyon days of tech reporters and venture capitalists gawking at our growing (tech enabled) bricklaying operation.

Two flavors of growth

The key difference between the bricks and the bacteria is that one has scale invariant growth (SIG) and the other... doesn't.

OK OK, friends who reviewed this before publishing said that was a big word/phrase to suddenly drop. So let's take a step back and examine this phenomenon visually before moving forward.

A great way to do this is plot the growth rate of the bacteria and bricks over time:


bacteria-bricklayer-1

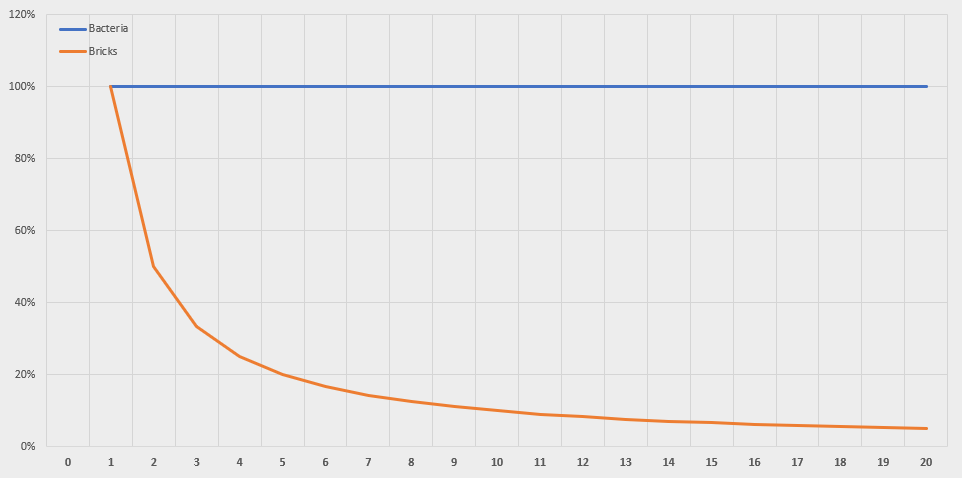
The bacteria grow at a constant rate over time. For the bricklayer, growth simply... collapses.

I've plotted this chart hundreds of times over the years, and for most startups the growth plot looks eerily similar to the bricks here.

Growth is not the natural order; growth cannot be taken for granted. As we get larger, we get slower.

I mentioned correlation earlier. The correlation between growth and scale in the case of the bacteria is 0 - perfectly uncorrelated.

For the brick count, the correlation is -0.7, a very strong negative correlation.

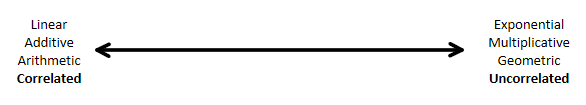
We've now established two ends of a spectrum we can use to characterize various forms of growth.

On one side, we have linear/additive/arithmetic/correlated growth, and on the other we have exponential/multiplicative/geometric/uncorrelated growth.


The question now is, where do various things fall along this spectrum? Said another way, how accurate is it to say that "XYZ" grows in compounding fashion?

Let's walk through some more examples.

Debt

Compound growth is often used in reference to compound interest earned on a financial instrument of some sort.

Anyone who has ever suffered through mounting credit card debt knows this quite well. Debt grows like bacteria - it multiplies without end at a rate that depends entirely on the interest rate and not at all on the current balance.

1%, 5%, 10% - whatever the interest rate, unless paid off, debt continues to grow without end. If only paid off partially, the remaining balance will continue to grow.

Not a bad business model if you ask me.

World GDP Per Capita

Growth is not the natural state of affairs. For most of human history there was no meaningful economic growth or improvement in livings standards for the average person. Until recently, Life was nasty, brutish, short and... static:

gdp-world

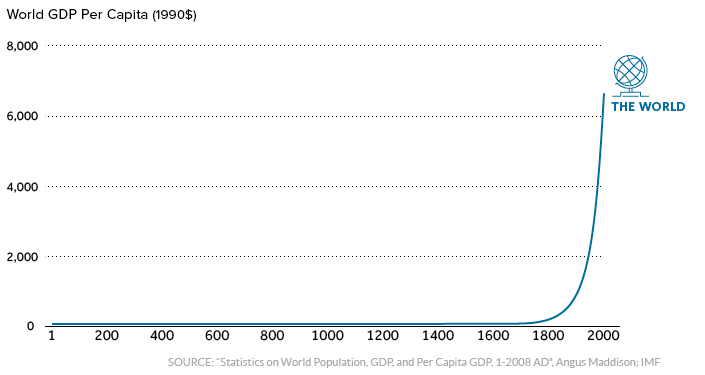
Unless growth is literally contractual, as in the case of debt and interest, we can't take it for granted, as history plainly shows.

And it's not simply a question of the scale of the axis. If you zoomed into that long straight line, you wouldn't see a hockey stick growth pattern. Living standards actually did not improve meaningfully over time for the vast majority of human existence on this planet.

A few years of bad weather, major epidemics like the Black Death (the bacteria strike again), social upheaval - these events drastically impacted the day-to-day well-being and lives of our ancestors, often erasing decades of progress.

Even today, many parts of the world experience major swings in their rates of growth, especially within the developing world. Regions and countries can end up in severe economic doldrums, leading to entire lost generations.

Many stops and starts, fits and spurts.

However, before we get too depressed, let's look at a best case scenario.

U.S. GDP

The good ol' US of A ('s real GDP):

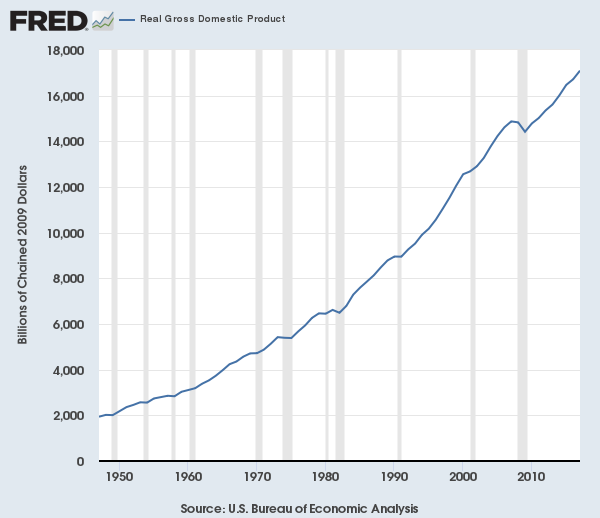
Looks pretty good huh? Let's look at the growth plot:

realgdpgrowth


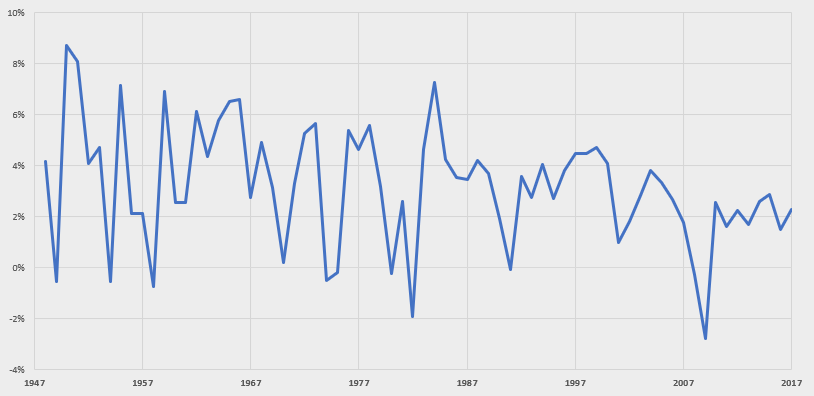
Ugh, this is pretty noisy. It's difficult to tell if growth is changing in significant ways year-to-year or if it is generally variation around a certain value.

This view hides some interesting detail. One neat math trick - taking the natural log rescales a metric such that, when graphed, linearity implies constant growth.

Do this, and the real GDP chart becomes:


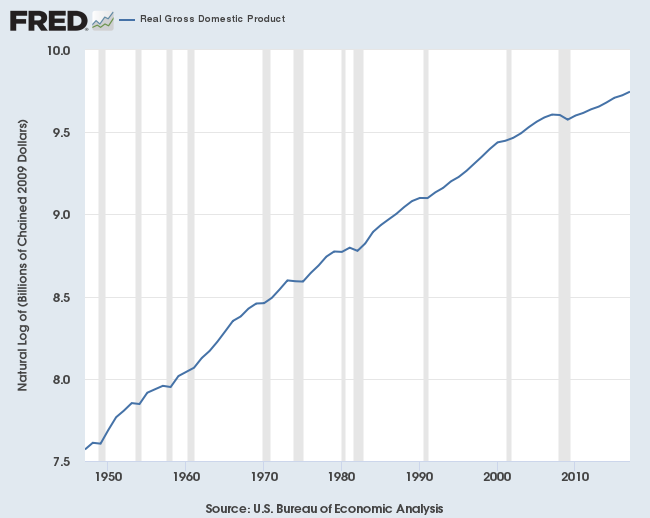
Over this period, we can make a few interesting observations:

  • Log real GDP is impressively linear - one could fit a linear line to the above data fairly well, implying reasonably constant growth
  • That said, it is not perfectly linear, and therefore not perfectly compounding, per our earlier definition
  • We can see multiple distinct inflection points where growth changed, in connection with recessions (1970, 2008)

Taking advantage of these kinks in the curve, let's estimate the growth during each period through piecewise linear regression (i.e. the "line of best fit" for each period):


logrealgdp-piecewisereg

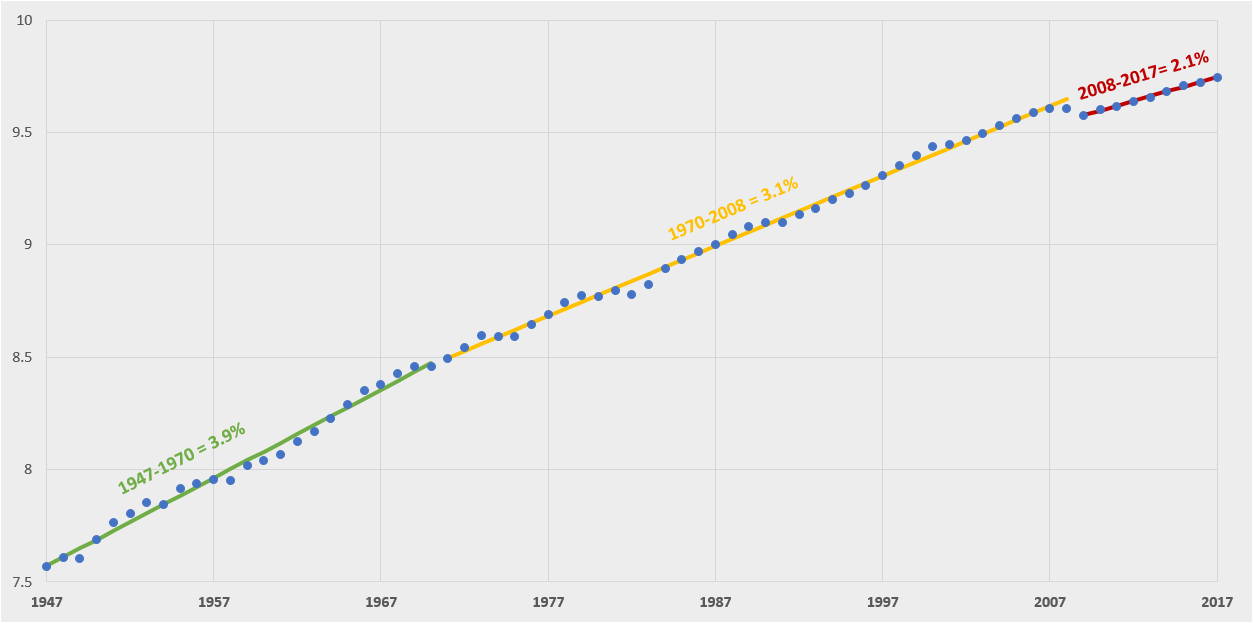
Annual real growth goes from 3.9% in the 1947-1970 period, to 3.1% in the 1970-2008 period, to 2.1% in the 2008-2017 period.

The economists yelling and screaming that we are on permanently lower trajectory after the most recent recession may have a point.

So not exactly constant growth, but still impressive given the real economy grew 8x+ over this period. Growth has roughly halved over a 70-year period.

In terms of the connection between growth and scale, the correlation here is -0.3, which certainly indicates a relationship, but not a strong one.

We can therefore conclude that U.S. GDP grows in reasonably compound fashion.

Revenue

Most businesses see their revenue growth rate tick down over time. This is even more true for companies that are growing quickly today.

On the other hand, some exceptional businesses have managed to drive truly compound growth over long periods.

Take Amazon for example, which has exhibited incredible revenue growth over time ($B):

amzn-revenue

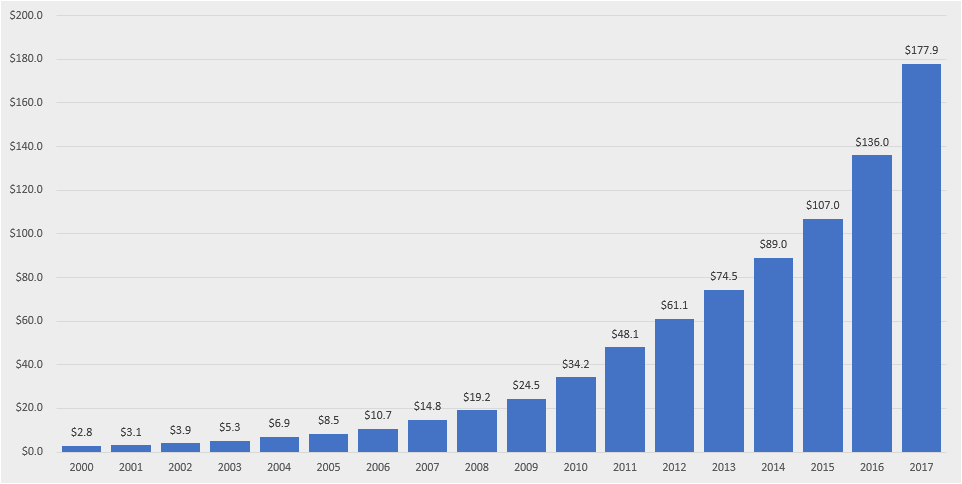
This is an impressive chart in its own right. But I am actually more impressed by the log-transformed chart, which is nearly a straight line:

amzn-logrev


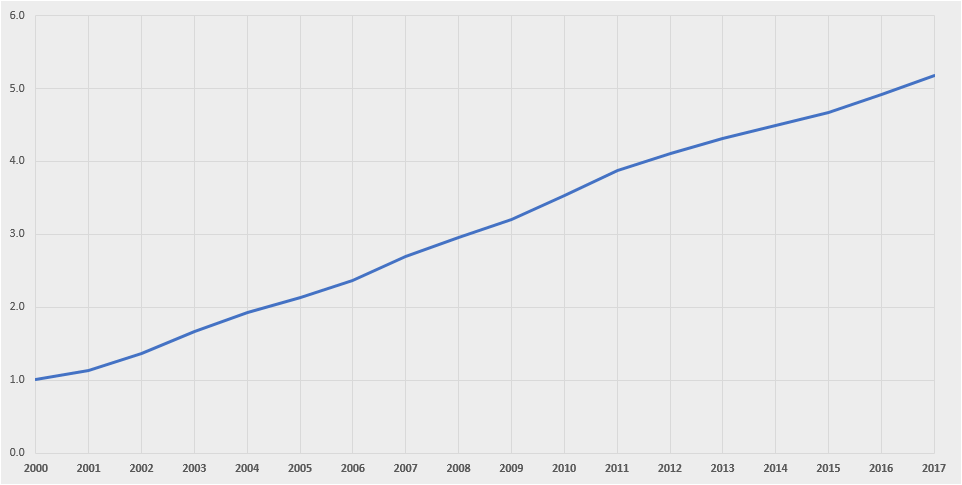
Amazon has grown at a nearly constant rate over almost two decades, despite increasing scale by 64x over the period.

At best, one could identify a slight kink in growth in 2011. Replicating the piecewise analysis, we can see that Amazon grew ~30% year-over-year from 2000 to 2011 and ~23% year-over-year from 2011 to 2017.

amzn-logrev-piecewisereg


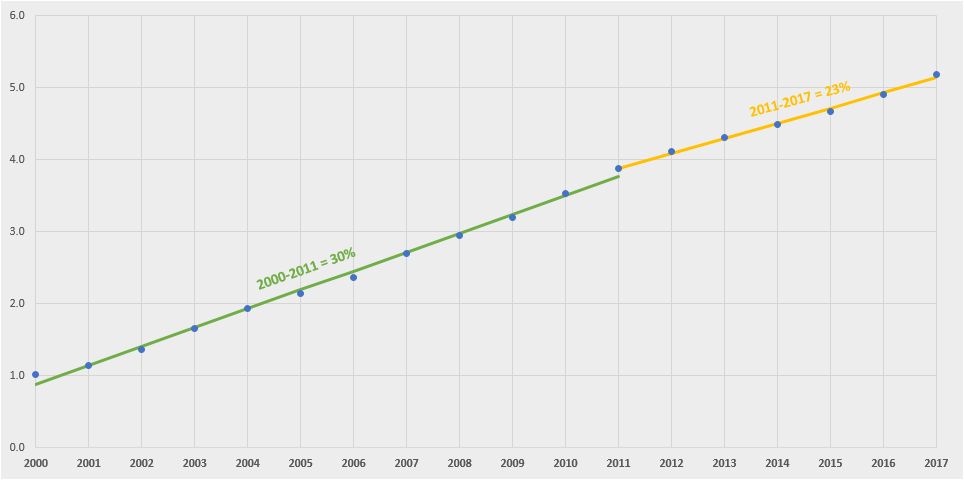
Amazon's growth-scale correlation? -0.1!

It's hard to put into words how impressive that single number is. Worth reiterating: most things do not work this way.

Amazon is an exceptional business that has evidently identified a way to grow at a nearly constant rate over many years. A combination of tapping into the long-run secular growth of e-commerce and deft expansion into seemingly orthogonal spaces (for example, via Amazon Web Services) that in fact leverage the core infrastructure the company's built up over time has enabled it to grow in bacteria-like fashion.

Growth functions: Are you adding or multiplying?

Every growing business needs an honest answer to this question: Is your business growing through multiplication, like the Amazonian bacteria, or addition, like the brick wall?

Businesses that simply "add" must necessarily slow down, by the simple math we outlined earlier. Scale begins to work against you, making it harder and harder to maintain a rapid growth pace. Eventually, you will, figuratively, hit a wall.

An example of an additive growth function is paid customer acquisition through a channel like Google Adwords.

Spending $100 on Adwords is going to generate some number of users. Spending another $100 is probably going to generate a similar number of users, and so on.

There's no "magic" here. This is "buying growth" in the most direct manner.

If anything, customer acquisition through paid channels that you do not control (and Adwords is the epitome of this) tends to get less efficient over time as you saturate keywords etc.

Like a bricklayer at the end of a long day, businesses reliant on this form of growth tend to run out of gas sooner or later.

Sure, you can attempt to stack bricks at a faster and faster rate, raising venture capital when you can no longer self-fund the endeavour, building the wall ever higher...

But this too will pass. Eventually, some proportion of those users must stick around and continue to buy from you without meaningful additional spend on your part, otherwise you'll find yourself on the proverbial "acquisition treadmill", unable to jump off without significant disruption to the business.

A number of companies in the subscription e-commerce "send me a box with a psuedo-random assortment of goods" space fall squarely into this category. Users churn at high rates, requiring more and more fuel to be poured on the paid acquisition fire to keep the train going.

On the other hand, businesses that "multiply" can grow indefinitely. Their "growth functions" are inherently multiplicative. Users beget more users. Revenue begets more revenue.

The classic exponential, multiplicative growth function is the viral word-of-mouth (WOM) or referral program.

PayPal built a viral engine in its early days, giving users money for each additional friend they referred to the service:


Dropbox replicated this, giving out additional space for signing up friends:


The act of sharing a Dropbox file or folder with someone who wasn't yet a user generated even more sign-ups:


Whatever the approach, it is vitally important that every business vigorously search for and identify exponential growth opportunities. It is mathematically inevitable that an additive, linear growth engine that does not compound on itself will eventually peter out, or even collapse like a wall built too high.

Likewise, investors must diligently sift through the noise to find the few bacteria-in-a-hay-stack that will drive true, long-term value creation. Ignore the steep trajectory in the short-run. Instead, focus on the curvature of the horizon.

Scale invariant growth is the key to building a large, meaningful business.

Go find it.

Nnamdi Iregbulem

DevOps, application infrastructure, and machine learning nerd. Soft spot for developers ❤️. MBA @Stanford | Ex-Product @confluentinc | Former VC @ICONIQ Capital | Economics @Yale


https://whoisnnamdi.com/you-dont-understand-compound-growth/

Friday 7 August 2020

Investing versus Speculation

 What is the difference between investing and speculation?

Benjamin Graham addressed the differences between them on the very first page of his book, The Intelligent Investor.

Graham wrote, "An investment operation is one which, upon thorough analysis, promises safety of principal and an adequate return."  

Based on this definition, there are three components to investing:  

  • thorough analysis, 
  • safety of principal, and 
  • adequate return.  
Graham added, "Operations not meeting these requirements are speculative."


To this, we can add:

(1)  Any contemplated holding period shorter than a normal business cycle (typically 3 to 5 years) is speculation, and 

(2) any purchase based on anticipated market movements or forecasting is also speculation.


Value investing meets Graham's definition of investing, addressing on:  its focus on individual company analysis to determine intrinsic value,  the margin of safety concept, and its success over the long term.

The distinction between investing and speculation is important for a reason Graham cited in 1949 and remains true today:  "... in the easy language of Wall Street, everyone who buys or sells a security has become n investor regardless of what he buys, or for what purpose, or at what price...."

The financial media often refers to "investors" taking profits, bargain hunting, or driving prices higher or lower on a particular day.  However, these actions are rightly attributed to speculators, not investors.


Investors and speculators approach their tasks differently.

Investors want to know what a business is worth and imagine themselves as owning the business as a whole. Unlike speculators, investors maintain a long-term perspective—at least 3 to 5 years. They look at a company from the perspective of owners. This means they’re interested in factors such as corporate governance, structure, and succession issues that may affect a company’s future and its ability to create wealth for years to come. Investors may use their voting rights to assist in enhancing company value over the long term.


Speculators, on the other hand, are less interested in what a business is actually worth and more concerned with what a third party will pay to own shares on a given day. They may be concerned only with short-term changes in a stock’s price, not in the underlying value
of the company itself.


The problem with speculation is simple:

  • Who can predict what a third party will pay for your shares today, tomorrow, or any day?  

  • Stock market prices typically swing between extremes, stoked by the irrational emotions of fear and greed.


Focus on the long term business value

Such dramatic price fluctuation on a day-to-day basis can test long-term investors’ mettle in maintaining their focus on business value.

  • Remember, the tendency is for business values day-to-day to remain relatively stable.
  • Day-to-day price changes should hold little interest for the long-term investor, unless a price has fallen to the “buying level” that represents a sizable margin of safety.

But that’s often difficult to remember when newspaper headlines, TV news anchors, friends, and coworkers are lamenting or lauding the market’s most recent lurch forward or back.


Friday 31 July 2020

Cash flow strategies and profits


June 1st, 2020 / By: IFAI / Resources

By Mark E. Battersby

Cash flow is the lifeblood of every business. In fact, according to a recent U.S. Bank study, poor cash flow management causes 82 percent of U.S. business failures. Although seemingly counterintuitive, many experts advise putting cash flow management before profits.

While profits are how a fabrication business survives, a failure to manage the operation’s cash flow can mean running into problems that one profitable accounting period might not be able to offset. Another study, this one by Intuit, revealed that

  • 61 percent of small businesses around the world struggle with cash flow and 
  • 32 percent are unable to pay vendors, pay back pending loans, or pay themselves or their employees due to cash flow issues.


Cash flow management 101
In essence, cash flow is nothing more than the movement of money in and out of the business. 

  • Cash flows into the business from sales of goods, products or services. 
  • Money flows out of the business for supplies, raw materials, overhead and salaries in the normal course of business.


An adequate cash flow means a steady flow of money into the business in time to be used to pay those bills. How well the fabricating professional manages the operation’s cash flow can have a significant impact on the bottom-line profits of the business.

Often, an operation’s cash inflows will lag behind its cash outflows, which leaves the business short of money. This shortage, or cash flow gap, represents an excessive outflow of cash that may not be covered by a cash inflow for weeks, months or even years.

Properly managing the operation’s cash flow allows that cash flow gap to be narrowed or closed completely before it reaches the crisis stage. This is usually accomplished by examining the different items that affect the operation’s cash flow—and looking at the various components that directly affect cash flow. This analysis can answer important questions such as the following:


  • How much cash does the business have?
  • How much cash does the business need to operate and when is it needed?
  • Where does the business get its cash and where does it spend it?
  • How do the operation’s income and expenses affect the amount of cash needed to operate the business?


Controlling inflow
In a perfect world, there would be a cash inflow, usually from a cash sale, every time there is an outflow of cash. Unfortunately, this occurs very rarely in our imperfect business world, thus the need to manage the cash inflows and outflows of the business.

Obviously, accelerating cash inflows improves overall cash flow. After all, the quicker cash can be collected, the faster the business can spend it. Put another way, accelerating cash flow allows a business to pay its own bills and obligations on time or even earlier than required. It may also allow the business to take advantage of trade discounts offered by suppliers.


Controlling outflow
Outflows are the movement of money out of the business, usually as the result of paying expenses.

  • A manufacturing business’s biggest outflow most likely involves the purchase of raw materials and other components needed for the manufacturing process. 
  • If the business involves reselling goods, the largest outflow will most likely be for the purchase of inventory
  • Purchasing fixed assets, paying back loans and paying bills are all cash outflows.


Fabricators can regain control over their operation’s finances by adopting best practices and proper tools. A good first step involves how the operation pays its bills. An important key to improving an operation’s cash flow can be as simple as delaying all outflows of cash as long as possible. Naturally, the operation must meet its outflow obligations on time, but delaying cash outflows makes it possible to maximize the benefits of each dollar in the operation’s own cash flow.

Many credit cards have a cash back bonus program. Even if the program offers only 1 percent cash back, that could equate to a sizable monthly amount for many businesses. Of course, because credit cards tend to have a higher interest rate, they should only be used if the balance can be quickly paid off in full.


Improving invoicing
Improving the invoicing process is another key step in cash flow management. A business can adopt incentive strategies to be paid faster. A business enjoying a 10 percent gross margin that offers a 2 percent rebate in exchange for early payments might not be appropriate. Giving away small extra services, on the other hand, might work. Incentives might include the following:


  • Small additional services
  • Discounts for early payments (balances paid before a certain date, or yearly invoice versus monthly)
  • Greater flexibility (for instance, a down payment required to book a delivery date)
  • Some customers are just late payers and need to be nudged. The way that dunning is handled can, however, greatly affect the collection process. Timing and the quality of message content are the two main factors in the success or failure of these prods.


How the business gets paid not only affects its profitability but also its cash flow.

  • Today, paper checks remain the standard method of payment. 
  • However, paper checks are slow, highly susceptible to fraud and bear “hidden costs” such as additional work and back- office processing. 
  • They are also inadequate for recurring invoicing.


Something as simple as asking customers to switch to electronic funds transfer (EFT) or Automated Clearing House (ACH) payments, and providing incentives to switch, are among the steps that can ensure faster, more secure, more reliable and cheaper payments.


Improving cash flow
Profit doesn’t equate to cash flow because, as mentioned, cash flow and profit are not the same. There are many factors that make up cash flow, such as inventory, taxes, expenses, accounts payable and accounts receivable.

The proper management of cash outflows requires tracking and managing the operation’s liabilities. Managing cash outflows also means following one simple but basic rule: Pay the operation’s bills on time—but never before they are due.

Having a cash reserve can help any fabricating business survive the gaps in cash flow.

  • Applying for a line of credit from the bank is one way to build that cash reserve. 
  • Once a business is qualified, lenders will grant a predetermined credit limit that can be withdrawn from when needed.


Yet another option might be frugality.  Aim to keep the business lean by constantly evaluating it.

  • Is the purchase of new equipment really necessary? 
  • Is hiring new employees really cost-effective? 
  • Weighing the pros and cons of all business needs and wants enables a business to retain cash flow and avoid unnecessary expenses.


Cash flow gaps
Remember, however, the cash flow gap in most fabrication businesses represents only an outflow of cash that might not be covered by a cash inflow for weeks, months or even years. Any business, large or small, can experience a cash flow gap—it doesn’t necessarily mean the business is in financial trouble.

In fact, some cash flow gaps are created intentionally.  That is, a fabricator will sometimes purposefully spend more cash to achieve some other financial results.  The business might, for example,

  • spend extra cash to purchase additional inventory to meet seasonal needs,
  • to take advantage of a quantity or 
  • early payment discount, or to expand its business.


Cash flow gaps are often filled by external financing sources:

  • revolving lines of credit, 
  • bank loans and 
  • trade credit are just a few external financing options available to most businesses.


Cash flow loans
Cash flow-based loans rely on the value of the operation’s cash flow. 

  • If the operation has a strong cash flow stream, it can be used to get significant loan amounts even if there are few business assets. 
  • Although cash flow loans can be expensive, they play a key role in a business that is expanding.


An advantage of cash flow loans is the repayment period.

  • These loans are usually designed according to the needs of the borrower, with repayment periods often between five and seven years. 
  • And, since cash flow loans are different from asset-based loans, rarely does collateral have to be put up.


Flowing cash flows
Assessing the amounts, timing and uncertainty of cash flow is the most basic objective of cash flow management.

  • Positive cash flow indicates the liquid assets of a business are increasing, enabling it to settle debts, reinvest in its business, return money to shareholders, pay expenses and provide a buffer against unanticipated financial challenges. 
  • The impact of a negative cash flow can be profound, with many businesses operating on margins so thin that frequent lost opportunities will put them on the path to closing their doors.


Obviously, every business can improve its cash flow. Of course, for this to happen businesses need to adopt best practices in the way they invoice, follow up with customers and monitor outflow. With the help of a qualified professional, these cash flow best practices may be easier to achieve.

Mark E. Battersby writes extensively on business, financial and tax-related topics.


https://fabricarchitecturemag.com/2020/06/01/cash-flow-strategies-and-profits/

Tuesday 21 July 2020

How to Handle a Reverse Stock Split (consolidation of shares)

A corporation can decrease the number of its publicly held shares through a reverse split.

-  The board of directors does not need to get stockholder approval to authorize a reverse split.

-  The board selects the reverse split ratio, such as issuing one share for every 10 shares owned, and announces the date the split takes effect.


Whether this helps or hurts your stock portfolio depends on the company’s reason behind the split.

A reverse stock split may result in a loss of shares for minority shareholders. Unfortunately, these individuals have little legal recourse if such an act occurs.


Reverse Splits and Minority Stockholders

-  If you are a minority stockholder, a reverse split could extinguish your position and force you out.

-  Unfortunately, there is not much you can do as long as the reverse split follows legal procedures and you receive the correct number of new shares.


Reverse splits can signal good news for investors or bad news. 

Reverse Split Advantages

-  A reverse split can signal that a company is financially strong enough to be listed on an exchange. The stock price will increase enough to meet the exchange’s minimum price requirement.

-  If you own stock in a small company that has seen increased sales and profits, the stock price should continue to rise after the reverse split.

-  Stocks newly listed on an exchange can attract new buyers, especially institutional investors who avoid over-the-counter and pink sheets stocks. Although you will end up owning fewer shares, they will be worth more as the price continues to rise.


Reverse Split Disadvantages

-  If your stock is listed on an exchange, a reverse split could herald a potential delisting as a consequence of its fallen price. If the stock remains below the exchange’s minimum price, the company’s stock is delisted and relegated to the over-the-counter market or the pink sheets.

-  The reverse split may boost the stock’s price for a while, but if sales have stalled or the company posts consecutive losses, the stock price will continue falling. Left unchecked, the stock will eventually be delisted off the exchange.

Wednesday 15 July 2020

Glove stocks uniform trading pattern sparks intrigue


Justin Lim
theedgemarkets.com

July 15, 2020


KUALA LUMPUR (July 15): All seven glove stocks on Bursa Malaysia took a nail-biting roller-coaster ride together during the final trading hours yesterday.

The seven counters plummeted simultaneously shortly after 4pm, but rebounded soon after, right before the closing bell. Share price charts show a uniform V-shape pattern among the rubber glove makers (see charts), whose share prices have rocketed at least several folds since March.


What was intriguing was that there was no negative news flow about the rubber glove industry that could possibly have swung the share prices in such a drastic and uniform fashion.

The sudden plunge among the seven glove stocks during the final trading hours was in the range of 15% to 25%. The big drop on Top Glove Corp Bhd and Supermax Corp Bhd dragged the FBM KLCI down by 1.8% to its intraday low of 1,577.33 before it bounced back to above 1,600-level to close at 1,598.75 points, down 7.68 points.

Investment analysts were baffled by the share price trend.

Some experts suspected that algorithmic trading activities could be at play. Algorithmic trading is a method of executing orders using automated pre-programmed trading instructions that account for variables such as time, price, and volume.

Malacca Securities Sdn Bhd head of research Loui Low did not rule out the possibility that algorithmic trading activities could be involved.

Another possibility, he believed, could be that the glove counters had triggered the stop limit for various investors and brokers.

MIDF Research senior analyst Imran Yassin Md Yusof, meanwhile, commented that investors had started to take profits following the strong share price rallies.

Top Glove, Supermax and Hartalega Holdings Bhd shares all settled in the negative territory yesterday, after closing at their record highs on Monday.

Supermax experienced the steepest drop with a 25.2% plunge to a low of RM12.52. It closed at RM15.90.

Similarly, Top Glove sank 15.4% to its intraday low of RM20.50, but bounced back to close at RM23.16. Hartalega sank 15.02% to a low of RM15.28, but later pared most of its losses to finish at RM17; Kossan Rubber Industries Bhd slid 14.2% to RM12, before closing at RM13.50.

Comfort Gloves Bhd's share price also tumbled 19.2% to RM3.33, before settling at RM3.84. Careplus Group Bhd fell 21.7% to RM1.48, then rebounded to close at RM1.76, while Rubberex Corp (M) Bhd dropped nearly 18% to RM3.22, to eventually settle at RM3.65.


https://www.theedgemarkets.com/article/glove-stocks-uniform-trading-pattern-sparks-intrigue

Investors can think long-term but managers are a harder case

Research shows executives are tempted take short-cuts to hit quarterly numbers
WEI JIANG

Are our markets really too focused on immediate results at the expense of long-term growth?
Wei Jiang JULY 25 2019


Charges of short-termism have been aimed at financial markets and companies for decades, but concerns have intensified recently. Now US regulators are asking whether rule changes are needed to address the issue.

But are our markets really too focused on immediate results at the expense of long-term growth? As an academic finance professor, I believe we can rely on empirical research on how the market values highly innovative companies. Innovation, after all, is the ultimate proof that companies are investing for the long haul.

First, let’s look at whether companies are discouraged from risky investments aimed at ambitious discoveries or from deploying unconventional methods. A 2013 study found that highly innovative companies — as identified by high levels of research and development spending are fairly priced, rather than heavily discounted as “market short-termism” would predict. Their future stock returns are comparable with those earned by other companies in the same class.

In fact, the study found that many high R&D companies with lower past success — as reflected in their ability to convert R&D spending future sales growth — are, if anything, overvalued for an extended period of time. That suggests public market investors are rather tolerant of failure.

We must consider, too, the impact of hedge fund activists, who often seek payouts through share buybacks. Critics say that these reduce the value of the companies in the long run by leading to reduced investment in innovation. But not all R&D spending is created equal. A study that three co-authors and I published last year found that while corporate spending on R&D does tend to fall in the year following interventions by shareholder activists, the R&D spending that remains becomes more productive.

At such companies, the number of new patents increased by 15 per cent, three to five years after the activists’ intervention, and the number of citations per patent — an indicator of patent impact or quality — also rose by 15 per cent. That suggests increased R&D efficiency and additional innovation.

Some investors, then, are more than willing to take the long view. But what about corporate managers? Evidence suggests that executive shortsightedness is not only a possibility, but can be a likely outcome in today’s markets.

Here’s why: most businesses are at risk of “stakeholder runs.” Creditors, suppliers and employees may seek to flee at the first sign of trouble, so the perception — possibly distinguished from the reality — of financial health is vital. Hence managers will often take actions that favour current observable results — think earnings here — to convince (or in some cases mislead) the market about a company’s fundamental health.

Investors are typically not fooled: they understand the incentives for managers to set and then beat earnings targets, and they correctly suspect that there will be “short-termist” efforts to meet those targets — stuffing inventories into the supply chain or cutting productive R&D if necessary.

Once it becomes clear managers are willing to play the earnings “game”, investors adjust when pricing the stock. For such companies, missing forecasts by small amounts can trigger a big sell-off because investors expect executives to exhaust all possible resources to meet their targets. Companies can short-circuit this unproductive cycle by avoiding quarterly earnings guidelines and a number of them have done so. This allows them to focus on other measures of performance, such as R&D spending and patent filing.

While short-termism can be a problem for our financial markets, the long-term is, of course, nothing more than a continuous series of short-terms. Investors can make it easier for companies to arrive at the right long-term mark by encouraging them to pick intermediate goals that keep them on the right path.

The writer is a Columbia Business School professor of finance


https://www.ft.com/content/3249bce4-ac8c-11e9-b3e2-4fdf846f48f5

Buy and Hold Works….Until It Doesn’t


by KenFaulkenberry | Portfolio Management

Buy and Hold
Buy and Hold is considered by many to be the holy grail of investing. Its current popularity has become a cult-like strategy that draws criticism to its critics and disdain towards those who dare speak out against the beloved investing strategy.

I’m going to explain why a buy and hold strategy is useful for some investors and a good strategy at certain periods of time. We’re also going to explore why buy and hold is not the best strategy for many investors, and is a poor strategy for everyone at certain periods of time.

Buy and Hold Strategy Definition
Investopedia provides the following definition:

“Buy and hold is a passive investment strategy in which an investor buys stocks and holds them for a long period of time, regardless of fluctuations in the market.”

There are many different ideas of what buy and hold means, but I like this definition because it’s fairly simple. The only wiggle room in the definition is: What is “a long period of time”?

Some investors might consider one year a long period of time. I believe we are living in an era where investors have “short-term-itis”. Many more people would consider 3-5 years a long period of time. This may be because in relationship to 1 year it is long.

However, for our discussion I’m stipulating that a long period of time is 10 years or more. Anything less than that it’s difficult to use reasoning or logic that includes probabilities. The shorter the time period the more randomness and fluctuations affect returns. If your not thinking longer than 10 years, you are not really thinking “long term”.

Advantages of Buy and Hold Investing
Easy to implement. The ultimate in passive investing: buy and hold. Simple as can be?

Saves on taxes. Long term capital gains and dividends are taxed lower than short term capital gains.

Efficient. Saves on commissions, transaction fees, etc.

No Need For Market Analysis. Market timing is avoided, volatility is ignored.

Investment Vehicles Add to Simplicity. Low-cost index and ETF funds are perfect investment vehicles for buy and hold investing.

Disadvantages of Buy and Hold Investing
Premium Prices. Most of the stocks worthy of buying and holding are priced at a premium. (Buying high) If you’re going to buy a stock to hold for more than 10 years, it better be a premium company!

Investor Panic. Many investors who claim to be buy and hold investors change their mind after large losses, leading to large drawdowns. (Selling low)

Volatility is ignored. Volatility is not always a bad word. Many successful value investors look at volatility as opportunities to buy bargains and sell trendy overpriced investments.

Ignoring Market Analysis. Market analysis can determine periods of time where it is problematic to be heavily invested or opportunistic to be aggressive.


“The underlying theory of buy and hold investing denies that stocks are ever expensive, or inexpensive for that matter, investors are encouraged to always buy stocks, no matter what the value characteristics of the stock market happen to be at the time.”
Ken Solow (Buy and Hold is Still Dead)

Find the Best Strategy For YOU
If you are the type of person who has little interest in learning how to invest, buy and hold may be the right strategy for you. The problem is you may not have much interest in your investments until they have major declines in value.

A buy and hold strategy requires equal attention to the “hold” part. You can’t sell after you have a 50% decline and be a true buy and hold investor.

In the long run a true buy and hold passive investor will most likely achieve average rates of return. If you systematically invest over your lifetime you will make purchases at bargain prices and at expensive prices. It may all equal out.

A buy and hold strategy does well in bull markets when stocks are consistently rising. But the reality of the stock market is that stocks go through long periods where values decline or stay flat. Sometimes these periods last a couple of decades. Usually these periods are preceded by periods when stocks become very expensive and overvalued when compared to their historical relationships to earning, cash flow, book value, etc.

For an investor willing to make the effort it makes no sense to take the same approach to buying stocks when they are bargains versus when they are expensive. An investment has more upside and less risk when its price is low. That same investment has less upside and greater downside risk when the price is expensive.

“In almost every walk of life, people buy more at lower prices; in the stock market they seem to buy more at higher prices.”
James Grant

This kind of behavior makes no sense. Therefore, buy and hold passive investing works when prices are bargains or even fairly valued. At any other time, your probability of success is greatly reduced.

So buy and hold works….until it doesn’t. People will quote all kinds of statistics “proving” that buy and hold works. Its the trend of our day. This is nothing new. Bull markets make buy and hold look good. Bear markets make buy and hold look bad.

Consider where you think we are in the valuation cycle before you make your buy and hold investing strategy decision!


https://www.arborinvestmentplanner.com/buy-and-hold-strategy-definition-advantages-disadvantages/

50 Reasons Why We Don’t Invest for the Long-Term

DECEMBER 18, 2018

Investment is a long-term endeavour designed to meet our long-term financial objectives, so why do we spend so much of our time obsessing about the short-term and almost inevitably taking decisions that make us worse off?  Well, here are 50 reasons to start with:

1: Because it is boring.

2: Because markets are random and it’s difficult to accept.

3: Because of short-term benchmark comparisons.

4: Because we are remunerated based on annual performance.

5: Because of quarterly risk and performance reviews.

6: Because there is always something / somebody performing better.

7: Because we watch financial news.

8: Because we think we can time markets.

9: Because even good long-term investment decisions can have disappointing outcomes.

10: Because the fund we manage charges performance fees.

11: Because short-term losses are painful.

12: Because we forget about compounding.

13: Because we are obsessed with what is happening right now.

14: Because we are poor at discounting the future.

15: Because we will be in a different job in three years’ time.

16: Because we extrapolate recent trends.

17: Because we check our portfolios every day.

18: Because it is so easy to trade our portfolios.

19: Because we think poor short-term outcomes means that something is wrong.

20: Because we make decisions when we are emotional.

21: Because we think we can forecast economic developments.

22: Because we think that we know how markets will react to economic developments.

23: Because we compare our returns to the wrong things.

24: Because it is hard to do nothing.

25: Because regulations require that we must be notified after our investment falls by 10%.

26: Because it feels good to buy things that have been performing well.

27: Because there is too much information.

28: Because we don’t know what information matters.

29: Because we don’t want to lose our job.

30: Because nobody else is.

31: Because we need to justify our existence.

32: Because we think we are more skilful than we are.

33: Because we work for a listed company.

34: Because we don’t want to lose clients.

35: Because we think one year is long-term.

36: Because assets with high long-term return potential can be disappointing in the short term.

37: Because we think performance consistency is a real thing.

38: Because we don’t want to spend much of our time looking ‘wrong’.

39: Because the latest fad is alluring.

40: Because there is a new paradigm.

41: Because we vividly remember that short-term call we got right.

42: Because we can’t tell clients we haven’t been doing much.

43: Because we think we are better than other people.

44: Because we have to justify fees.

45: Because we don’t want to be invested through the next bear market.

46: Because we think short-term news is relevant to long-term returns.

47: Because short-term investing can be exciting.

48: Because we have to have an opinion.

49: Because there are so many experts and they are all so convincing.

50: Because it seems too simple.

Adopting a genuinely long-term approach to investment is one of the few genuine edges or advantages any investor can hope to exploit.  Unfortunately, it can feel as if everything is conspiring against our attempts to benefit from it – but that does not mean we should not try


https://behaviouralinvestment.com/2018/12/18/50-reasons-why-we-dont-invest-for-the-long-term/

Tuesday 14 July 2020

The glove put warrants poser


Lai Ying Yi 
 theedgemarkets.com 

 July 14, 2020 KUALA LUMPUR 

(July 13): It is undeniably a bull market for the glove makers currently. 

However, an interesting trend has also emerged in the local market on Monday — an equally frenzied buying of two newly-listed structural put warrants on Top Glove Corp Bhd (Top Glove-HA) and Supermax Corp Bhd (Supermax-HB). 

The strong interest in the derivatives that hedge against a fall in share prices of Top Glove and Supermax has made many in the investing fraternity perplexed. 

The prices of the two derivatives, a bear market tool, rocketed over 200%.

Top Glove-HA soared by 207% and Supermax-HB by 291%, on the day when the two underlying stocks climbed to their all-time highs. Supermax saw its biggest ever share price leap of RM2.36 to RM15.98. Top Glove’s share price gained RM2.08 or 9.5% to RM24. 

The large trading volumes recorded were another evidence of the strong interest in the two derivatives. TOPGLOV-HA was the most traded securities on Bursa on Monday, with 613.47 million units having changed hands, while Supermax-HB was the third most traded counter with 567.9 million units done. 

In a nutshell, put warrants grant holders the right to sell the underlying shares at a specified price (exercise price) within a limited period of time (maturity). Structured put warrants are hedging tools. Investors tend to use structured put warrants to hedge against any big drop in the underlying share prices. 

Some market observers commented that the surge in interest in the two put warrants, which made their debut just two weeks ago, could be attributed to the increasing number of glove bears in the market, although the bulls still swarm the market in general. 

“No one could deny that the downside risk on those glove counters are heightening, as their share prices are trading at such hefty premiums. Such put warrants would allow investors to hedge their long position on the underlying shares,” said a market observer. 

Even so, the spike in the prices of the two put warrants has been astonishing, to say the least. Given that the premium of the two derivatives are near 100% based on the closing price on Monday, the hedging tools themselves have also become highly risky. 

Based on the exercise price and conversion ratio, the put warrants are pricing the mother shares at RM2 for Top Glove and 30 sen for Supermax. 

“Investors will only make money if the underlying mother share drops below these two levels (assuming the investors hold onto the derivatives until the expiry dates). Is that possible?” explained a warrant specialist. 

 Nonetheless, structured warrants are a trading instrument so investors are unlikely to hold onto the derivatives until expiry date. In this case, the warrant holders who bought in earlier would have made handsome gains after the price rally on Monday, if they locked in their profits.