https://theedgemalaysia.com/node/682163
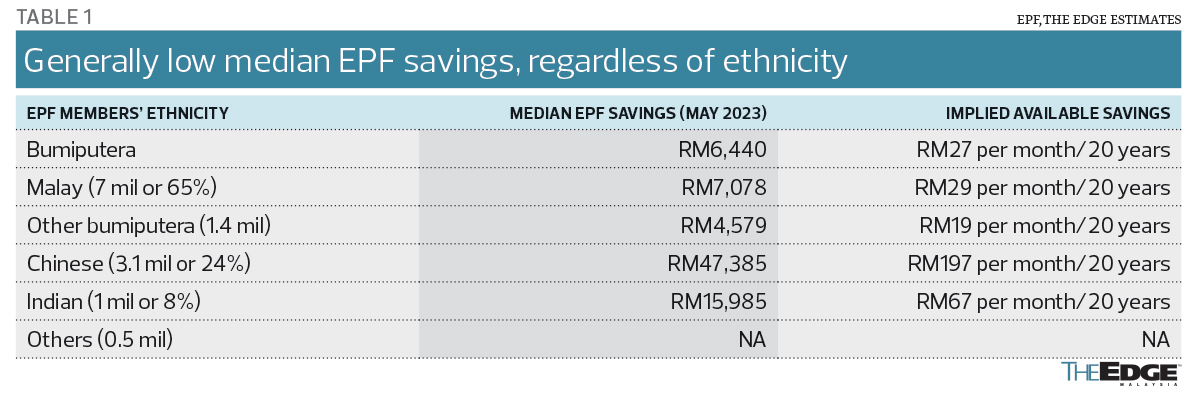
THE low level of retirement savings among Malay and other bumiputera private sector wage earners compared with their fellow Malaysians of Chinese and Indian ethnicity recently made headlines when lawmakers provided such numbers in parliament when arguing against more premature withdrawals of statutory retirement savings from the Employees Provident Fund (EPF).
While the median savings among EPF members of Chinese and Indian ethnicity in May 2023 were higher than that of Malays and other bumiputera, the reality is that the median EPF savings is low even among the Chinese, who make up about 24% of the provident fund’s membership.
According to EPF data, the median savings among the 3.1 million Chinese EPF members was RM47,385 as at May 2023, which works out to only RM197 per month for 20 years. That is just under one-fifth of the prevailing minimum civil service pension of RM1,000 a month — hardly enough to get by, even though the figure looks high when stacked against the median savings of RM7,078 (RM29 a month for 20 years) among the seven million Malay EPF members.
Savings adequacy is also a concern among the one million EPF members who are of Indian ethnicity, even though their median savings of RM15,985 (RM67 a month for 20 years) is above that of the median savings of RM4,579 (RM19 per month over 20 years) among the 1.4 million non-Malay bumiputera EPF members (see Table 1).
That median EPF savings of Malay members are higher than that of non-Malay bumiputera should not cloud the fact that the median savings of all ethnicities point to a serious need to shore up savings adequacy.
With only 19%, or 2.5 million, of the 13.3 million EPF members meeting the EPF’s basic savings by age, not all 3.1 million Chinese EPF members automatically have enough to retire. In short, ethnicity has scant meaning on one’s adequacy of retirement savings relative to more useful details like age, trajectory of wages, education, skills and the industries the EPF members are in.
Market cap of Farm Fresh (RM'000) 2,283,742
Market cap of Dutch Lady (RM'000) 1,433,600

Quality: Gruesome
Management: -
Valuation: -
ROE - 5 Yr Avg 4.62
ROE - Latest FY 5.45
PX Growth Rate - 5 Yr Avg (%) 9.93
DPS Growth Rate - 5 Yr Avg (%) NM
EPS Growth Rate - 5 Yr Avg (%) -7.74
Latest YR D/E 0.02
NAB/Share (RM) 3.24
Latest PX / NAB 0.35
I will avoid this stock. Does not fulfill my investing criteria.

20.9.2023
For the three months ended 31 July 2023, group revenue increased 4.4% to RM185.32 million from RM177.49 million in the preceding quarter mainly due to higher demand from both domestic and export markets. Despite the higher revenue, the Group registered a loss before tax of RM7.86 million compared to a profit before tax of RM12.83 million in the preceding quarter, primarily attributable to the goodwill impairment of RM22.71 million in relation to its operations in Myanmar. Excluding the impact of the goodwill impairment, the Group’s profit before tax increased by 15.8% compared to the preceding quarter mainly due to the increase in revenue.

Its EPS over the last 14 years has been flat, with little growth.
Its DPO ratio was a high of 99.1%.

Before 2008, this was a company in the O&G sector with fast growth. It was growing very fast due to frequent acquisition. The market players gave it a high PE. Then it swallowed Borsig. This was a very large company and KNM financed this acquisition with a lot of debt.
When 2008 came, its business declined. Its business shrunk and EPS dropped. Together with contraction of its PE, its share price dropped quickly. It dropped from RM 2.13 per share at the end of 2010 to RM 0.42 at end of 2012. Its huge debt became a big burden.
Its business has not recovered since.
Recent moves by other significant shareholders are interesting.
The lesson here is to recognise that not all growth is good. Growth maybe good increasing the intrinsic value of the company. Growth can also be bad, destroying the intrinsic value of the company. Growing its existing business organically is generally safer than growth engineered through acquisition. Acquiring another has its associated risks.

It is better to invest in another company. Those in this stock should be aware of the opportunity cost.
A new management is in place. But will they be able to turnaround this company? Turnarounds are usually difficult and can take a long time, if at all.

Certain businesses are not easy to manage. This company is in real estate development. The business was doing well from 2009 to 2016. From 2016 to now, it had done so poorly.
Look for businesses with durable competitive advantage, selling unique products and services. These businesses should have earnings that are consistent and growing over the long term.
I briefly looked at this company in past and was impressed by its performance. Look at the increasing EPS and DPS from 2009 to 2016.
Perhaps, a lesson here is 5 years is probably a business cycle for many businesses and looking at 10 years or even 15 years results may offer one a better understanding of the long term sustainability of a business.


Excluding the very high PEs and very low PEs at the extremes, its usual historical PE ranged from low PE of 8.3 to high PE of 11.9 and its average or signature PE was 9.8.
At the current price of RM 11.40 per share, it is trading at a PE of 7.08x and its DY is 4.34%.
2009 to 2022
It EPS grew from 58.28 sen in 2009 to 157.64 sen in 2022. It has grown its EPS 2.7x.
Its EPS grew at a faster rate from 2009 to 2015 (doubling over 6 years) and grew at a slower rate from 2016 to 2022 (EPS increased by about 50%),
Excluding the very high PEs and very low PEs at the extremes, its usual historical PE ranged from low PE of 11.2 to high PE of 16.5 and its average or signature PE was 14.1.
It paid out 35% of its earnings as dividends and grew its earnings by 99.36 sen (157.64 - 58.28 sen). It retained 957.61 sen (1473.01 sen - 515.4 sen). The return on its retained earnings (RORE) is thus, 10.4% (99.36 sen / 1473.01 sen).
Its usual DY ranged from low DY of 2.38% to high DY of 3.12%.
At the current price of RM 19.90 per share, it is trading at a PE of 11.06x and its DY is 2.96%.
2009 to 2022
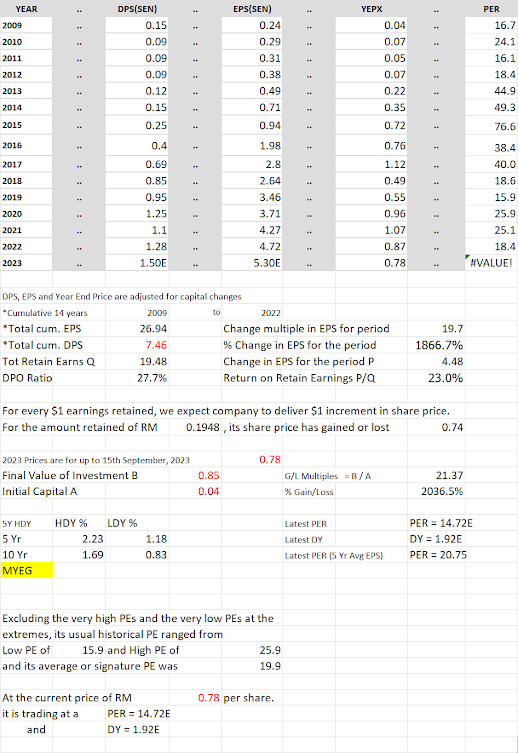
It EPS grew from 0.24 sen in 2009 to 4.72 sen in 2022. It had grown its EPS 19.7x.
Its EPS grew 11.7x, at a fast rate from 0.24 sen in 2009 to 2.8 sen in 2017. Its EPS dropped from 2.8 sen inn 2017 to 2.64 sen in 2018. From 2018, its EPS grew from 2.64 sen to 4,72 sen in 2022; it grew 1.8x.
Its PE expanded from PE of 16.1 in 2009 to PE of 76.6 in 2015. From 2015/16, its PE contracted from this highest PE to PE of 18.4 in 2022.
Excluding the extremely high PEs and extremely low PEs, the usual historical PE for MYEG ranged from low PE of 15.9 to high PE of 25.9 and its average or signature PE was 19.9.
It paid out 27.7% of its earnings as dividends and grew its earnings by 4.72 sen - 0.24 sen = 4.48 sen. It retained 26.94 sen - 7.46 sen = 19.48 sen. The return on its retained earnings is thus, 4.48 sen / 19.48 sen = 23%.
Its usual DY ranged from low DY of 0.83% to high DY of 2.23%.
At the current price of RM 0.79 per share, it is trading at a PE of 14.8x and its DY is 1.91%.
From 2009 to 2022, it has grown its earnings per share 2.9 times, from 47 sen to 136.65 sen.
It paid out 99% of its earnings as dividends and despite retaining only 1% of its earnings, it was able to grow its earnings 2.9 times.
At the price of RM 23.56 per share, it is trading at a PE of 18.12x.
Excluding the extremely high PEs and extremely low PEs, the usual historical PE for Heim ranged from 14.8 to high PE of 25.6 and its average PE was 20.5.
Its usual DY ranges 3.33% to 5.26%. At RM 23.56 per share, its DY is 5.86%.
From 2009 to 2022, it has grown its earnings per share 2.26 times, from 13.93 sen to 31.5 sen.
It paid out 48.2% of its earnings as dividends and grew its earnings by 31.5 sen - 13.93 sen = 17.57 sen. It retained 340.44 sen - 164.03 sen = 176.41 sen. The return on its retained earnings is thus, 17.57 sen / 176.41 sen = 9.96%.
At the price of RM 4.14 per share, it is trading at a PE of 12.07x and its DY is 4.35%.
Excluding the extremely high PEs and extremely low PEs, the usual historical PE for PBB ranged from low PE of 13.4 to high PE of 15.7 and its average or signature PE was 14.5.
Its usual DY ranged from low DY of 3.04% to high DY of 4.35%.