Friday 23 February 2024

GCB at a glance


SAM ENGINEERING at a glance


JAYATIASA at a glance


OSK at a glance


OCK at a glance


Is OCK Group Berhad's (KLSE:OCK) Recent Stock Performance Influenced By Its Fundamentals In Any Way?

https://uk.finance.yahoo.com/news/ock-group-berhads-klse-ock-064956949.html?guccounter=1&guce_referrer=aHR0cHM6Ly93ZWIudGVsZWdyYW0ub3JnLw&guce_referrer_sig=AQAAAK_nMhZAe1ribDUlfq7jNLCGzhB6rKvlsS-KUUOj82rcWngephRqtPzRgmC2TVD0-pj5s6nIN8FCN8INkv3fJh20Fhdbhs4os3074-LFaafLgetXTx-c62-WAZcenyJlWHf_LjPLLa1uHQg-KPdTlKkM7UnRxMBKVFkDHRSLAAE3

TOPGLOVE at a glance


SARAWAK CABLE at a glance


TSH at a glance.


KELINGTON at a glance *


PANTECH at a glance


POH KONG at a glance


POWER ROOT at a glance


BURSA at a glance


TENAGA at a glance


PETGAS at a glance


Thursday 22 February 2024

INARI AMERTON at a glance


TEKSENG at a glance


KERJAYA at a glance


KOTRA at a glance


DIALOG at a glance


KOSSAN at a glance


DUOPHARMA at a glance


ELK-DESA at a glance


PETRONM at a glance


MAXIS at a glance


JAKS at a glance


PCHEM at a glance


QL at a glance


YINSON at a glance


SUNWAY at a glance


CAPITAL A at a glance


AIRASIA X at a glance


YTL CORP at a glance


YTL POWER at a glance


HIBISCUS at a glance


Wednesday 21 February 2024

WELLCALL at a glance


SAB at a glance


PENTAMASTER at a glance


PRESS METAL at a glance


Supermax at a glance


HLIND at a glance


MAYBULK at a glance


Maybulk owns bulk carriers.  It is a business that is capital intensive.  

Fraser & Neave at a glance


Price per share: RM29.20 
Market Capital (RM) 10.710b 
Number of Share 366.78m 
Revenue (TTM) 5.116B 
Net Profit (TTM) 508.84M 
Net Margin (TTM) 9.9% 
EPS (TTM) 138.73 
P/E Ratio 21.05 
ROE 14.29% 
P/B Ratio 3.01 
NTA 9.710 
5y CAGR - Revenue 4.0% 
5y CAGR - Profit 6.9% 
Dividend (cent) 77.000 ^ 
Dividend Yield 2.64% 


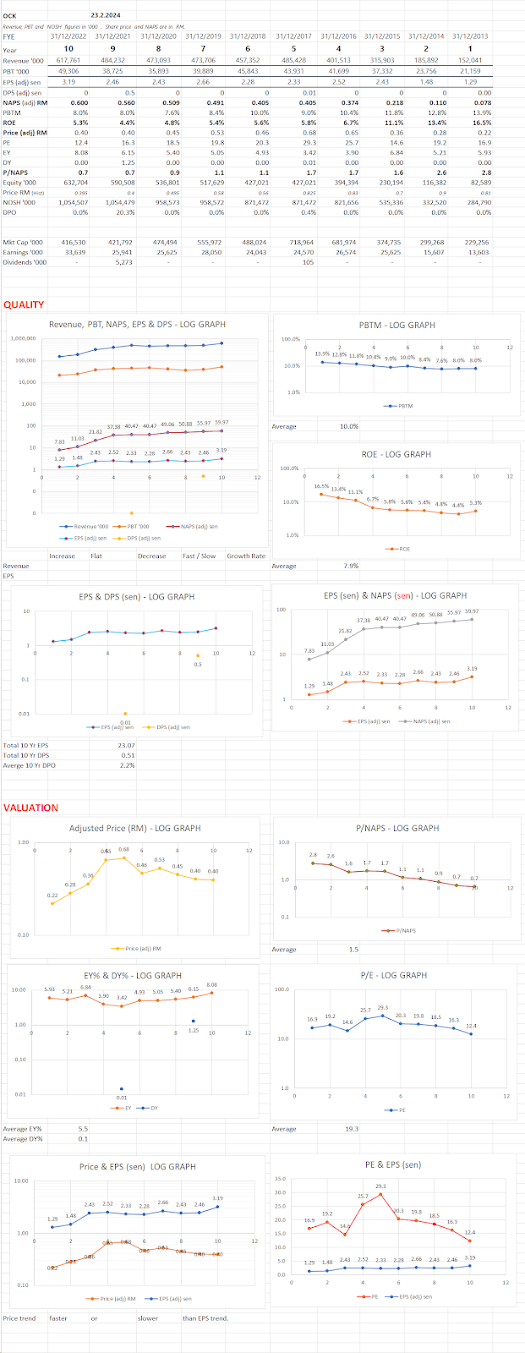
Over the last 10 years, the revenues grew about 4% yearly and the PBT grew at a slightly faster rate of about 6.9%. This indicated its profit margins had improved.  Over the 10 years above, its PBT Margin increased steadily from 8.3% to 12.5%. 

Its NAPS (Net Asset Price per Share) grew from RM 4.603 per share to RM 9.112 per share. F&N is a great company, with high ROE in the mid teens. Its ROE for the above 10 years period ranged from low of 12.9% to a high of 19.4%; averaging 15% to 16%. 

Given the risk free interest rate of 5% or so, its present price of RM 29.2 per shar means it is trading at a P/NAPS of 3.01 x. This valuation means it is trading at a fair price today. 

F&N has distributed dividends yearly. Its DPO was around 52% to 56%. Its latest DY is 2.68%. 

In summary, F&N is a great company, growing at a slow rate of 5% to 7% yearly. It retained about 50% of its earnings for future growth and with its ROE at around 15% or so, and many new projects for future growth, this stock in my portfolio remains for the long term.

PMCORP at a glance


PMHoldings at a glance


Hextar Global at a glance


TEOSENG at a glance


Apex Healthcare at a glance


TH Plantation at a glance