Your Pessmism Is Holding You Back
By Selena Maranjian
September 23, 2009
Surveys and studies can shed a lot of light on news that's important to our lives. I've reported on many of them, such as the Employee Benefit Research Institute's findings that we may not retire when we think we will. There's the annual Retirement Confidence Survey, showing us why we stand a good chance of ending up with a gruesome retirement. And there's the report from Fidelity that can help us see how we're doing compared to others in our retirement planning.
Now there's another study out from Fidelity, with even more data on retirement and investing. Looking over the report, which happened to focus on pessimists and optimists, I learned that (drumroll, please):
•Pessimistic investors are less likely to expect a comfortable retirement than optimistic investors, by a 61% to 83% count
•Pessimists typically take on less investing risk. That's been especially true during the current uncertainties in the financial markets.
There's more. Among married couples, 61% of pessimistic spouses don't have much confidence in their ability to take over control of the household finances, versus just 39% of optimists.
The scoop
Yes, I know, the study is telling us that pessimists are kind of … pessimistic. But there's more to the study than just disposition. For instance, nearly twice as many optimists as pessimists have a detailed plan for how they'll generate retirement income. That lack of planning certainly suggests that those pessimists have good reason to expect the worst.
Given those results, we should try to make sure we're not in the pessimist camp. More often than optimists, pessimists seem to invest mainly to preserve the value of their investments -- in other words, rather conservatively. That's not a great way for most of us to build a nest egg for tomorrow, especially if you still have awhile to go before you plan to retire.
It will take a long time to build the wealth you need for retirement if you focus only on preserving your wealth rather than growing it. You'll be stuck with low returns that may not even keep up with inflation, let alone help you increase your purchasing power after you retire. If you expect to need $50,000 to cover your annual expenses, for instance, you need to build a nest egg of $1 million or more. You probably can't get there sticking with ultrasafe investments.
What to do
If you're starting to break out in a sweat as you imagine putting lots of your dollars into stocks you don't know well -- ones that might suddenly implode -- relax and take a deep breath. You can aim for solid returns with stocks that won't strike you as all that risky. Check out the following companies with top ratings from our Motley Fool CAPS investor community:
Company
Return on Equity
Price-to-Earnings Ratio
10-Year Average Return
BP (NYSE: BP)
12%
15
4.0%
Canadian National Railway (NYSE: CNI)
18%
13
19.9%
Abbott Labs (NYSE: ABT)
27%
14
4.5%
Transocean (NYSE: RIG)
22%
7
10.6%
Petroleo Brasileiro (NYSE: PBR)
31%
10
27.1%*
Schlumberger (NYSE: SLB)
24%
17
10.1%
ExxonMobil (NYSE: XOM)
27%
11
8.8%
S&P 500
(0.2%)
Data: Motley Fool CAPS; Yahoo! Finance. *Over the past nine years.
Their relatively low P/E ratios suggest that they aren't wildly overpriced, and thus these stocks offer some margin of safety. You can find plenty of compelling familiar names these days, too -- ones that offer generous dividends.
So don't be such a pessimist! Over long periods, the stock market tends to make people wealthier. Feel free to feel optimistic that now, during a recession, is often the best time to invest.
http://www.fool.com/retirement/general/2009/09/23/your-pessmism-is-holding-you-back.aspx
Thursday 24 September 2009
Biggest Market Opportunity: Cash? (No, I'm Not Insane)
Biggest Market Opportunity: Cash? (No, I'm Not Insane)
By Alex Dumortier, CFA
September 23, 2009
What sort of insanity is this? How could cash be an opportunity at a time when three-month T-bills yield less than 10 basis points? No one gets excited earning virtually nothing on their cash balances, but stock investors should consider future opportunities in addition to existing choices: It's not about what you're not earning on the cash today, it's about earning premium returns on the investments you'll be able to make with that cash tomorrow.
Cash needn't be an anchor
In the words of super-investor Seth Klarman: "Why should the immediate opportunity set be the only one considered, when tomorrow's may well be considerably more fertile than today's?" At the head of the Baupost Group, a multi-billion dollar investment partnership, Klarman employs a value-oriented strategy, achieving exceptional performance in spite of -- or rather, because of -- the fact that he frequently holds significant amounts of cash. For example, on October 31, 1999, a few months before the tech bubble began to collapse, his Baupost Fund was approximately one third in cash.
Over the "lost decade" spanning 1999 through 2008, Klarman smashed the market with a 15.9% average annualized return net of fees and incentives versus a (1.4%) annualized loss for the S&P 500.
Don't go all in (cash or equities)
Let me be quite clear: I'm not advocating that you liquidate all your stocks and go all into cash; the market's current valuation simply does not warrant that sort of drastic action. Conversely, it shouldn't compel you to raise your broad equity exposure, either.
As I noted last week, the market doesn't look cheap right now: Based on data compiled by Professor Robert Shiller of Yale, at yesterday's closing value of 1,071.66, the S&P 500 is valued at over 19 times its cyclically adjusted earnings, compared to a long-term historical average of 16.3. Based on average inflation-adjusted earnings, the cyclically adjusted P/E ratio is one of the only consistently useful market valuation indicators.
As prices increase, so does your risk
All other things equal, as share prices rise, stocks will represent a larger percentage of your assets; however, logic dictates you should actually seek to ratchet down your equity exposure under those circumstances. As stock prices rise, expected future returns decline (again, all other factors remaining constant), making stocks relatively less attractive. Another way to express this is that as stock prices increase, so does the risk associated with owning stocks.
That risk may simply be earning sub-par returns or, in the worst case, suffering capital losses. Extremes in market valuations offer the best illustration of this principle: Owning a basket of Nasdaq stocks in March 2000: a high-risk or low-risk strategy? How about buying Japanese stocks in December 1989, with the Nikkei Index nearing 39,000 (nearly 20 years on, the same index trades at less than 10,500).
Don't misinterpret Buffett's words
So what are we to make of Berkshire Hathaway (BRK-B) CEO Warren Buffett's words when he told CNBC on July 24th: "I would much rather own equities at 9,000 on the Dow than have a long investment in government bonds or a continuously rolling investment in short-term money"? (Investors must have concluded the same thing, sending the Dow 8% higher since then.)
First, with just 30 component stocks, the Dow isn't a broad-market index; it's a blue-chip index. The stocks of high-quality companies have underperformed the broader market in the rally from the March market low, which has left them relatively undervalued. This is reflected in the Dow's 14 price-to-earnings multiple, against 17 for the wider S&P 500.
Buying pieces of businesses vs. owning the market
Second, keep in mind that Buffett likes to own pieces of high-quality businesses, not the whole market. As I mentioned above, there is reason to believe that there is still opportunity left in the higher-quality segment of the market. The following table contains six companies that trade with a free-cash-flow yield above 10% -- i.e., they're priced at less than 10 times trailing free cash flow (these are not investment recommendations):
Company Sector
Free-Cash-Flow Yield*
General Electric (NYSE: GE)
Conglomerates
47.3%
UnitedHealth Group (NYSE: UNH)
Health care
11.7%
Bristol-Myers Squibb (NYSE: BMY)
Health care
10.6%
Raytheon (NYSE: RTN)
Industrial goods
10.5%
Altria Group (NYSE: MO)
Consumer goods
11.5%
Time Warner (NYSE: TWX)
Services
25.9%
*Based on TTM free cash flow and closing stock prices on September 21, 2009.
Source: Capital IQ, a division of Standard & Poor's, Yahoo! Finance.
Summing up: What to do from here
To sum up:
If, like Buffett, you have identified high-quality businesses that are undervalued, there is nothing wrong with buying them now.
However, if you are mainly an index investor, it is probably ill-conceived to increase your exposure to stocks right now.
Either way, whether you are a stockpicker or an index investor, there is nothing wrong with holding on to some cash right now -- not for its own sake -- but to take advantage of better stock prices at a later date.
Morgan Housel has identified three high-quality companies that are still cheap.
http://www.fool.com/investing/value/2009/09/23/biggest-market-opportunity-cash-no-im-not-insane.aspx
Wednesday 23 September 2009
How to analyse an annual report
Wednesday September 23, 2009
How to analyse an annual report
Personal Investing - By Ooi Kok Hwa
MANY of us receive a lot of annual reports every year.
Even though we are aware that there is a lot of important information in the reports, not many of us are willing to spend time going through those reports before buying stocks.
Besides, it is quite difficult for some investors, especially those who lack proper financial training, to analyse the financial information.
In this article, we will provide a quick guide on how to analyse an annual report.
Given that there are many ways to dissect an annual report, the following six pointers are just a quick check on the financial health of any listed companies.
Income statement is the financial statement that shows the effects of transactions completed over a specific accounting period.
In this statement, we have three key pointers: the current level of revenue; high growth in revenue; and the profits made in proportion to the level of revenue.
The current level of revenue indicates the size of a company. A company with revenue or sales of RM1bil is definitely bigger than one that has revenue of only RM100mil.
In Malaysia, companies with revenue of RM500mil and above should be considered as more established companies.
High growth in revenue implies that the company has been expanding over the past period.
Assuming the high growth in revenue will eventually translate into high growth in profits, we should invest in companies with higher growth in revenue because this may lead to higher stock prices.
If the overall economy is expanding, avoid those companies that are showing a decline in revenue.
This might imply that the overall operating activities of the companies are declining.
The profits made in proportion to the level of revenue indicates whether this company has high or low profit margins in its products. The profits here refer to the profit after tax or net income.
We should invest in high profit margin companies because high profit margins will provide a cushion to the sudden change in operating environment. A company with revenue of RM1bil and profits of RM10mil is more likely to face tougher challenges in a stiff price competition environment compared with a company with revenue of RM100mil and profits of RM10mil.
Balance sheet is the financial statement that shows a company’s assets, liabilities and owners’ equity at a point in time. The two main pointers in this statement are cash in hand and total borrowings.
Cash in hand refers to the cash or cash equivalent like fixed deposits. If possible, we should invest in companies with high cash in hand and zero borrowings. High cash in hand may imply that the company has high chances of rewarding shareholders with higher dividend payments.
Besides, companies with high cash in hand have more financial stability than companies with very tight level of cash. This explains why most investment gurus like to invest in cash-rich companies.
Total borrowings include the short- and long-term borrowings. Here, we should check whether the company has reported any sharp increase in borrowings during the financial periods. Most companies need to increase borrowings to support their capital expenditure on any business expansion.
However, if a company has been increasing its borrowings each year and the level has far exceeded one to two times the shareholders’ funds, unless its operating activities are able to support the repayments, the company faces very high financial risk.
Cash flow statement shows the sources and uses of cash over the period. One very important pointer in this statement is the operating cash flow.
High operating cash flow implies that the company is generating cash from its operating activities. A healthy company should show high operating cash flow because this number will indicate how much actual cash the company has generated from operations during the period.
We need to be careful of the companies that are showing profits but at the same time generating negative operating cash flows every year. This may imply that these companies have very high receivables. Any economic downturn may cause a sharp increase in provisions on bad debts.
Lastly, investors need to understand that the above six pointers are just a quick guide to analysing any annual report. Serious investors should not only analyse these six pointers. They are advised to scrutinise the reports further for more details.
Ooi Kok Hwa is an investment adviser and managing partner of MRR Consulting.
http://biz.thestar.com.my/news/story.asp?file=/2009/9/23/business/4762997&sec=business
'Where are the Customers' Yachts?'

http://www.telegraph.co.uk/finance/personalfinance/investing/shares-and-stock-tips/6217619/Share-tips-yes-they-do-work.html
The analysis by GLG Partners, the hedge fund, suggested that recommendations from European brokers have done better than the funds over each of the past four years.
The idea that private investors armed only with simple share tips can beat most professional fund managers recalls the book Where are the Customers' Yachts? – the question asked by someone shown the lines of expensive stockbrokers' yachts in a marina, making the point that the City can seem better at making money for its own insiders than for its customers.
Whitbread GLG's research imagined a simple "long-only" fund management strategy – in other words, one that avoided trying to make money from falling shares – that followed all broker recommendations to buy particular stocks. Under the strategy, the shares are bought at the closing price on the day of the share tip and held for 65 trading days, when they are sold.
The annual returns from using this technique would be as much as 6.4 percentage points above the performance benchmarks used by fund managers, the researchers calculated. Each 65-day period would produce gains of between 0.8 and 1.69 percentage points above the benchmark, after payment of commissions, and this could be repeated four times a year.
Annual returns would therefore beat the benchmarks – which typically reflect the performance of the stock market – by between 2.8 and 6.4 percentage points.
"This is enough to place the strategy in the top quartile of UK mutual funds with a Europe-including-UK benchmark in all [of the past] four years," the researchers said. In other words, the strategy would beat at least three-quarters of British funds that invest in UK and European shares.
"This simple strategy involves implementing all recommendations over a fixed holding period for each idea [share tip]," the research added. "Obviously, there are numerous execution improvements that could be made. Our calculation of 2.8 to 6.4 percentage point gains over the benchmark is meant to be illustrative of the opportunities available for the simplest investment strategy."
The research also proposed an explanation for the fact that analysts tip more stocks as "buys" than as "sells". It pointed out that the intended "consumers" of share tips were fund managers, and they had a greater demand for buy recommendations. "The reason is simple. Most managers are long-only managers … so it makes sense that brokers would put less time into sell than buy recommendations."
There is also more to lose with an incorrect sell tip, GLG's research said. "The downside of being incorrect is greater with sell recommendations. A stock with a sell recommendation can go up by an unlimited amount – so there is unlimited potential error – while a stock with a buy recommendation can fall only by a limited amount, meaning limited potential error."
It concluded: "These factors suggest that at the very least an analyst should issue a new sell recommendation with more caution than a buy recommendation."
The analysis also cast doubt on the belief that tipsters tend to tip only shares that are already rising – "chasing momentum", in City jargon.
"In all four years, the average buy recommendation was either moving in line with the market or underperforming prior to the recommendation change. So there's relatively little evidence to suggest that analysts are 'momentum chasing' by putting buy recommendations on outperforming stocks."
The researchers' early data for 2009 suggests that this year has been an extreme one for analyst performance. "Buy recommendations have worked very well; sell recommendations very poorly." This is likely to reflect the fact that the stock market has recovered dramatically since its March low, so shares tipped as buys will have been helped by the trend in the market, while those tipped to fall may also have been dragged upwards.
Richard Hunter of Hargreaves Lansdown, the stockbroker that compiles share tips for The Daily Telegraph, said: "Investors' ability to access share research has never been greater. The proliferation of the internet, the market's movements being of wider interest to the public and an appetite from the press have meant that finding tips for larger companies is relatively straightforward."
But he advised private investors to be wary of some of the research they read. "It may have been written by an institutional broker and aimed at institutional clients. This in itself does not lessen the validity of the research, but generally an institution's attitude to risk and time frame may be vastly different to that of a private investor.
"For example, it is likely that the institutional investor will be measured by its success compared to a wider benchmark, such as the FTSE 100 or the FTSE All Share. As such, it needs to be nimble and will switch between stocks and sectors on a regular basis in an effort to outperform its peers. Furthermore, if it finds itself underperforming its targets, its attitude to risk may change as it chases higher returns."
Meanwhile, he added, the research will inevitably have been seen by its intended institutional audience, and then by the wider market, before it comes to the attention of the private investor. "Any change in market sentiment will, therefore, more than likely already have been reflected in an adjustment of the share price."
For the larger stocks, there will often be opposing views among analysts, he said. A selection of broker views on BP, for example, showed 19 rated the stock as a "strong buy" and five as a buy, while 12 recommended holding and three rated the share a "strong sell". The consensus in this case would be a buy – the opposite of three of the tips taken in isolation.
GLG's research did not say what investors might do in this situation, so investing your way to your own yacht might not be all plain sailing.
Pound slides again as markets enter Bank of England-fuelled 'bubble' stage
Pound slides again as markets enter Bank of England-fuelled 'bubble' stage
The pound slid closer to parity with the euro on Monday, as one of London's leading hedge fund managers warned stock markets are in a Government-fuelled bubble.
By Edmund Conway and Jamie Dunkley
Published: 6:26AM BST 22 Sep 2009
Pound slides closer to parity with euro as it hits a five-month low against the single currency. Photo: CHRISTOPHER PLEDGER "Markets are now entering a bubble phase [which may last] until the end of the year," said Crispin Odey of Odey Asset Management.
However, the bubble is almost entirely dependent on the Bank of England's quantitative easing (QE) policy, through which it is creating £175bn and pumping it into the system by buying Government debt, he added.
Mr Odey's comments came as the pound fell further against other leading currencies after a report from the Bank warned of the effect of the financial crisis on sterling's long-term value.
Mr Odey told clients in a note: "Individuals and institutions are stampeding into real assets – eager to have anything but cash or government bonds... The latter are expensive because of the QE which has caused that bubble.
"At some point the QE will have to come to an end but, until it does, this bull market is sponsored by HMG and everyone should enjoy it."
FTSE breaks six-day winning streak
Katherine Garrett-Cox, chief executive of Alliance Trust, said: "I think the recent stock market rally has been driven by sentiment rather than fundamental facts.
"In 2008 markets were driven by fear; this year they have been driven by greed.
"I'm sceptical about the market recovery given the fiscal environment we are in. Public spending is falling, consumer spending is down and unemployment will rise."
Although many central banks have taken on a QE policy, the Bank has committed to creating and spending more than any other, arguing that the alternative outcome is severe deflation. However, this is thought to have sparked a gradual exodus from UK investments by overseas asset managers fearful that the policy may generate inflation.
This has pushed the pound lower against most other currencies. The euro hit a five-month high against sterling yesterday before slipping back to 90.58p. Citigroup said yesterday that sterling would drop to parity against the euro in the coming months.
The bank's analyst Michael Hart said: "Tight fiscal policies and easy money is about as negative a policy mix as it is possible to get for the currency and we expect sterling to exceed parity with the euro."
http://www.telegraph.co.uk/finance/economics/6216874/Pound-slides-again-as-markets-enter-Bank-of-England-fuelled-bubble-stage.html
Markets 'in Government-fuelled bubble'.
Markets 'in Government-fuelled bubble', says hedge fund manager Crispin Odey
Stock markets are in a Government-fuelled bubble, one of London's leading hedge fund managers said, as the pound slid closer towards parity with the euro.
By Edmund Conway and Jamie Dunkley
Published: 7:43PM BST 21 Sep 2009
Katherine Garrett-Cox, chief executive of Alliance Trust, said the recent stock market rally has been driven by sentiment "Markets are now entering a bubble phase [which may last] until the end of the year," said Crispin Odey of Odey Asset Management. However, the bubble is almost entirely dependent on the Bank of England's quantitative easing (QE) policy, through which it is creating £175bn and pumping it into the system by buying Government debt, he added.
The warning came as the pound fell further against other leading currencies, and as Citigroup predicted that sterling would drop to parity against the euro.
Mr Odey told clients in a note: "Individuals and institutions are stampeding into real assets – eager to have anything but cash or government bonds... The latter are expensive because of the QE which has caused that bubble.
"At some point the QE will have to come to an end, but until it does this bull market is sponsored by HMG and everyone should enjoy it."
Katherine Garrett-Cox, chief executive of Alliance Trust, said: "I think the recent stock market rally has been driven by sentiment rather than fundamental facts.
"In 2008 markets were driven by fear; this year they have been driven by greed.
"I'm sceptical about the market recovery given the fiscal environment we are in. Public spending is falling, consumer spending is down and unemployment will rise."
Although many central banks have taken on a QE policy, the Bank has committed to creating and spending more than any others, arguing that the alternative outcome is severe deflation. However, this is thought to have sparked a gradual exodus from UK investments by overseas asset managers fearful that the policy may generate inflation. This has pushed the pound lower against most other currencies.
The euro is now worth 90.58p, with economists from Citigroup saying yesterday that sterling would drop to parity against the single currency in the coming months. The bank's analyst Michael Hart said: "Tight fiscal policies and easy money is about as negative a policy mix as it is possible to get for the currency and we expect sterling to exceed parity with the euro."
http://www.telegraph.co.uk/finance/economics/6216138/Markets-in-Government-fuelled-bubble-says-hedge-fund-manager-Crispin-Odey.html
Rally at risk as long-term investors shun stocks
Rally at risk as long-term investors shun stocks
A glance at the shareholder register of Cadbury is revealing. It is no longer familiar UK names that control the company, but a motley assortment of US investment funds.
By Nicholas Paisner, Breakingviews.com
Published: 2:35PM BST 22 Sep 2009
This partly reflects the confectioner’s turbulent history, but it is also indicative of the changing shape of the European equity market.
A number of recent studies have shown that long-term institutional investors have cut equity allocations by as much as 40pc over the past two years. Many pension funds were net sellers of domestic equities even before the crisis, as they sought to diversify internationally and reduce risk. But by selling into the rally, and not reweighting portfolios in-line with market moves, the shift away from shares has been accelerated.
The crisis has given these investors more reason to be wary of stocks. Even on long-term time horizons, equity returns have not been attractive, with the UK’s FTSE-100 index now at the same level as in 1997. And after two bear markets in the past 10 years, individuals in defined-contribution pension schemes are understandably risk averse, prompting them to switch out of equities.
The flight of long-term money has left its mark. In spite of doubling or tripling, share prices in some sectors are still well-below their peaks. What’s more, liquidity in the mid- and small-cap stocks has plunged. This sharp decline in interest could well reflect risk-averse investors hastening their departure from these segments of the market. A large chunk of the investor base may simply have gone for good
The move by long-term investors into low-return safe havens of cash and government bonds is potentially bad news all round. For those who have not given up on equity, the exit of long-term money means that the current populace of shareholders are now a far less sticky lot. This hasn’t been a problem so far, as money has been flowing into the market on a net basis. But it could exacerbate future market wobbles.
Long-term investors could also suffer from their caution. Government bond yields are still at historical lows, albeit up from crisis troughs. The resurgent gold price suggests that the market is once again starting to fret about inflation. If rising prices do begin to take hold, bond yields could yet soar. Investors in risk-free assets may quickly start to wish they had been a little more adventurous.
http://www.telegraph.co.uk/finance/breakingviewscom/6218807/Rally-at-risk-as-long-term-investors-shun-stocks.html
Private equity may be on cusp of ‘golden age’
Private equity may be on cusp of ‘golden age’
NEW YORK, Sept 23 — The near collapse of the global financial system, which wiped out trillions in corporate value and personal savings, may be giving way to a new “golden age” for private equity investment, Silver Lake Co-CEO Glenn Hutchins said in an interview today.
Private equity firms suffered badly when debt markets seized up as a result of the crisis and banks did not want to lend increasingly scarce capital. Only just recently have credit markets started to unfreeze.
“The financial markets may be on the cusp of a new ‘golden age’ for private equity,” Hutchins, who is also a co-founder of the firm, told Reuters on the sidelines of the International Economic Alliance Symposium.
Hutchins, the co-founder of the US$13 billion private investment firm, cautioned that while there has been a significant stock market rally, the economy is showing stable, though not robust, growth.
“This recent stock market rally is a little troubling because it seems to me not to be supported by underlying economic fundamentals,” Hutchins said.
“But that aside, we have gotten down to levels that are pretty attractive and the banks seem to be recovering enough to provide modest levels of financing, which is all we need. We feel pretty optimistic,” he added.
The major concern, he said, is how long will investors have to be prepared to withstand low levels of economic activity.
‘ATTRACTIVE’ RISK PREMIUMS
But for the moment, Hutchins said, investors are once again finding risk premiums at attractive levels versus the low premiums before the asset bubble burst in December 2008.
“Now that the sort of panic of ‘08 is over and capital markets seem to be returning to some degree of normality ... companies will be able to access debt and equity markets like they have in the past. And that is no surprise,” Hutchins said.
But he added that investors needed to be mindful that valuations in 2007 should not be defined as normal. They were an “overshoot in another way,” he said.
The average investment grade corporate bond now yields 232 basis points over US Treasuries, down from the all-time high of 656 basis points on Dec. 5, 2008. By comparison, in May 2007, before the credit crisis started, spreads narrowed to 92 basis points, according to the Merrill Lynch indexes.
“Now risk premiums are at attractive levels. Investors are being paid to take risk again. That means when you look back on this, when you get back to economic recovery, this will have been a good time to invest,” Hutchins said.
Silver Lake makes only a few acquisitions a year and is more inclined to use financing for working capital rather than purchases, Hutchins said.
“If you need financial engineering to enter a deal and multiple expansion to exit a deal, then your business is fundamentally challenged,” Hutchins said.
The firm, along with other investors, agreed to a deal earlier this month to pay US$1.9 billion to buy a 65 per cent stake in online telephony unit Skype from Internet auction and services company eBay Inc.
Ebay agreed to sell the stake in Skype for US$1.9 billion to a consortium including Netscape founder Marc Andreessen’s Andreessen Horowitz, venture firm Index Ventures, Silver Lake, and the Canada Pension Plan Investment Board.
Asked what he thought about the Skype sale and lawsuits filed by Skype’s founders, Hutchins responded: “No comment.” — Reuters
Saturday 19 September 2009
KLSE Stock Market Performance in 2008
Stock Market Performance in 2008
Riding on the strong local stock market performance of the last quarter of 2007, the Kuala Lumpur Composite Index (“KLCI”) quickly reached its record high of 1,516.2 points on the 11 January 2008. However, from that point onwards, the KLCI saw a steady decline as concerns over the health of the US financial markets and its economy in general dampened investor appetites. Then, on the 10 March 2008, the KLCI plunged 9.5% to 1,157.4 points as a reaction to the results of the 12th General Elections. The KLCI subsequently recovered to end March 2008 at 1,247.5 points, down 13.7% for the
1st quarter of 2008.
The recovery which began in mid-March lasted until hitting the 2nd quarter high of 1,300.7 on the 16 May 2008. At that point, fueled by the effects of rising commodity prices, the stock market started weakening. Inflation proved to be a very real concern as soaring commodity prices resulted in year-on-year inflation doubling in the month of June. As a result the KLCI closed the quarter at 1,186.6 points.
Bearish market sentiments persisted throughout the second half of 2008. Inflation concerns remained unalleviated until September. Simultaneously, many European economies announced 2nd quarter contractions. Finally, in September, the failure of several large financial institutions in the US sent shockwaves throughout the global financial markets. On this note, the KLCI ended the 3rd quarter of 2008 at 1,018.7 points, down 30% from the beginning of the year.
In the 4th quarter, the KLCI hit the year’s low on the 29 October 2008, closing at 829.4 points as the economies of the Eurozone and Japan enter a technical recession, and as the US records a quarter-on-quarter Gross Domestic Product (“GDP”) contraction. Locally, the Malaysian economy has seen its GDP contract by 11% from the previous quarter.
Following interest rate cuts and stimulus packages by various governments, including Malaysia, global and regional equity markets began to recover. It is on this note that the KLCI ended the year at 876.8 points, a total loss of 568.2 points or 39% from the beginning of the year.
On the outlook for the stock market in 2009, market sentiments are expected to remain bearish for at least the first half of the year as the major global economies struggle to escape the grip of recession. Malaysia has not been spared from this crisis. Rising unemployment along with the low GDP growth forecasted for the year will put further downward pressure on equity prices. However, there are signs that the global economic downturn may be bottoming-out. If global and/or regional economies succeed in turning around, we may well see the KLCI rebounding by the end of 2009.
http://announcements.bursamalaysia.com/EDMS/subweb.nsf/7f04516f8098680348256c6f0017a6bf/6c6bd58085864967482575be00261818/$FILE/TIENWAH-AnnualReport2008%20(3.2MB).pdf
The Ultimate Hold-versus-Sell Test
Here is the overriding primary test, followed by observations on why it is so critically important:
Knowing all that you now know and expect about the company and its stock (not what you originally believed or hoped at time of purchase), and assuming that you had available capital, and assuming that it would not cause a portfolio imbalance to do so, would you buy this stock today, at today's price?
No equivocation. Yes or no?
Answers such as maybe or probably are not acceptable since they are ways of dodging the issue. No investor probably buys a stock; they either place an order or do not.
Here is the implication of your answer to that critical test: if you did not answer with a clear affirmative, you should sell; only if you said a strong yes, are you justified to hold.
Thursday 17 September 2009
Will there be another dip in US stocks?


Will there be another dip in US stocks?
ON the first anniversary of the Lehman Panic, investors may not have noticed that the New York Stock Exchange (NYSE) has already been rallying for six months and has risen a hefty 56% and yet there are many out there looking for the other shoe, the second dip, the W, and so on.
Looking at the persistently high cash level of the institutional fund managers, there is no doubt that there are many, many investors left out in the cold in the current rally. Many of them may end up holding cash for a long time that pays no or little interest. Why?
With the NYSE up 56%, these institutional lemmings are scared stiff to buy now because they think the NYSE will make another major drop. So, it is better to wait for the double dip or the W or whatever Armageddon to happen first.
Then, when the economic data come out showing that the US economy is on a decisive recovery path, one would have thought that this would be convincing enough for them to invest. Apparently not, as they also get scared stiff by this. Why?
The other worry that many investors have is that the US economy will be hit by high inflation as the economic recovery takes hold. The reasoning is simple. The US economy has been boosted by a massive injection of monetary and fiscal stimuli. These can only lead to rapid economic growth, and thus higher inflation.
As this happens, US interest rates are going to surge and this will take the US economy and NYSE down. So even the reassuring economic numbers are spooking these lemmings instead of reassuring them. Such a phenomenon is a simple reflection of how frightened investors have become. Nothing can be right. More importantly, are the concerns over rising inflation justified?
i Capital is of the view that the concerns of high and rising inflation happening in the next two to three years are misplaced. There is no doubt that the monetary and fiscal injections have been large but the global panic was of a massive scale. Without a sufficiently large stimulus, investors would not have been reassured and the panic would have ensued.
Then, there is plenty of spare capacity in the goods and labour markets. Factories have enough capacity to meet consumer demand without having to hike product prices and the labour market has enough workers to meet the demand of employers without having to pay higher wages.
Globally, the same situation applies. At the same time, there is no fear of a sustained deflation.
Producers face rising commodity prices as demand from the rest of the world, led by China, stays healthy.
While companies cannot raise selling prices, they cannot lower them by much or for a prolonged period either. In the end, the outlook for the US pricing environment over the next two to three years is rather sanguine.
Showing the headline and core inflation rates since 2002, the chart captures the sanguine scenario best.
The spike in US inflation rate in the second half of 2007 and the first half of 2008 was due mainly to the surging energy prices and then the inflation rate slumped in second half of 2008 and first half of 2009, again due primarily to the plunge in energy prices.
We all know that energy prices have been extremely volatile. So, policymakers tend to watch the core inflation rate, which has been remarkably stable at 1.5% to 3% in the last six to seven years, even when the US economy was booming.
i Capital is of the view that the lemmings waiting on the sidelines with their piles of cash would have a long time to wait.
The NYSE is not going to crash in September and October 2009 and inflation is not going to rear its ugly head anytime soon. i Capital sees the NYSE pausing further as it navigates these two months.
Greed and Fear
Thursday, September 17, 2009
Greed and Fear
I have been noting down on my emotions : When I was greedy, when and why? When I was in fear, when and why?
How I survived a nightmare(day-mare, actually)
ZiJin-cw : Yesterday, I queued for 0.148 and it was done. Shouldnt I be jumping for joy after TWICE it shot up above 0.14(my target price) to 0.144 and 0.142, only to see it pullback the next day to go below 0.130?! Should I be relieved that I could sell it at such a "HIGH" price as I saw it plummeted to a low of 0.07 last month?? I was not in joy after I sold it, as I m seeing more upside on it TODAY as gold reaching for 1020. Now, yesterday morning it was at 1005(and even went down to 990 level days ago!!) ... so, I do know it will jump, and placing a 25% increment from the previous closing price, I thought it wont be done(like I dont wish to sell? GREED in play) ... cool. It closed at 0.155. OUCH. Later I wont be surprise if it jumps up another 10-20% to 0.17 level, and breaching new high above 0.20 soon. SHOULDNT I BE in JOY? Hmmm ...
Now, for TWO times when it breached my target price at 0.140 ... I got GREEDY and did not sell it at 0.140(lack of discipline with GREED in play). But, both of the times, it dived below 0.130 the next few trading days. I was cursing myself for not being disciplined. I SHOULD HAVE SOLD IT AT 0.140, I said. As it reached 0.125 level(FEAR in play?), I was kicking myself(in my trading room ... without anyone know about it, and also I do not write about it. This is a confession of a novice trader!) ... and promised to sell it at 0.140 the next time. Yesterday, it breached 0.140 for the third time in as many weeks.
I bought ZiJin-cw at 0.142 with great confidence it will shoot up back to 0.20 level(it dived from 0.16+ to 0.14 level when I decided to buy into it). For first few days, it went up to 0.150. I started to feel confident. I even think of buying more?? GREED in PLAY. But, I did not as that was not in my trading plan. As China markets pullback, ZiJin started to show weakness and back to 0.140 level, and without much problem, going below 0.130 after a week or so!! I do not put a stop-loss, but thought of buying more at 0.120 level.
Yes, it reached 0.120 level ... I was in FEAR and was too stunned to execute my plan? Hello novice trader, you are supposed to follow your plans? I did not. It went back to 0.130 level ... then, HAI YAH, why I didnt buy at 0.120 as planned? It it going to shoot up 0.15 soon!! Yeah, right. Emotions in play ...
Funny, it dived below 0.120 level ... and I was watching it and braved myself : You better buy at 0.10 level or else I will slap you. PIAK. I bought more at 0.10, to avoid being slapped by myself.
FEARS? Wait till you see my face when it went below 0.10, and dived to 0.07 level. I will buy at 0.05 level, I mumbled. Yeah right ... when it really reached 0.05 level, we will be shivering??! I was holding on to 180k units averaging at around 0.12, so at 0.07 ... I m losing almost half of my values. With the expiry date shorten each day, the FEAR is very real. What should I do? As I searching for answers(like looking at my palm lines and the formation of stars above) ... ok, last plunge to 0.05 ... BUY!
It rebounded from 0.07 very quickly back to 0.10 level. PHEW!! What a relieve tho I was still down. As markets in HK recovering, gold price shooting higher to 980 level ... wow. Suddenly there is a great interest in ZiJin. It was shooting like 20% per day. Do the calculations : 0.070 to 0.100, the 0.120. That was just in a week!! It reached my average price. What a relief. Suddenly the FEAR disappear(very fast) and confidence is back. Ok ... I will be VERY glad to clear it at 0.140, I told myself.
Arrghh ... it did reach 0.14 ... ok, I think it will reach higher, say to 0.15?? Then, I started to write about it 2/3 weeks ago, exposing my rollercoaster ride with it. Well, it reached 0.140 TWICE but finally I sold it yesterday as it reached 0.140 again for the third time.
ZiJin breached HKD8 yesterday to close at 8.15, a level never expected in such a short period of time. I started to stalk ZiJin in Feb when it was at HKD3.50 level.
There are so much emotions involved that I was numbed. I m learning to ride on roller-coasters and to numb myself when I trade. But, frankly ... I dont like the emotions in play. I wish I m totally emotionless. Guess I just need to learn and experience more ... I m such a novice. HAHA.
I m trying to be a contrarian but due to lack of discipline, I have not really been doing that. I tend to 'follow the herd', and being slow, I will be slaughtered. The control of emotions is VERY essential and important. Move on after we sell(not looking back with regrets due to greed) ... and hold on after we bought it. Markets up and markets down ... it is the trend that we should TRY to follow. As the saying goes, market ALWAYS win. We buy, it goes down ... we sell, it shoots higher. It is wiser to be longer term investor rather than short-term trader if we could not contain our emotions.
NOTE : The above story is fictional as it is being used to illustrate FEAR and GREED in a novice trader like me and should not be taken seriously.
http://cpteh.blogspot.com/
Wednesday 16 September 2009
25 Best Warren Buffett Quotes on His Strategies, Investments, and Cheap Suits
25 Best Warren Buffett Quotes on His Strategies, Investments, and Cheap Suits
Posted by Admin in KLSE Talk on 09 16th, 2009
He's called the Oracle of Omaha, and for good reason: not only is he one of the best investors of all time, but hes also a witty communicator.
Here are twenty-five awesome quotes from the man himself. I find these quotes to be especially comforting when youre financially depressed after all, he views a market slump as a good thing!so I hope these can remind everyone that we just need to do the basics, and well be OK. Be a consistent net saver, buy the market through ups and downs, be a decent human being, and rest easy.
On Investing
- Rule No.1: Never lose money. Rule No.2: Never forget rule No.1.
- Its far better to buy a wonderful company at a fair price than a fair company at a wonderful price.
- Only buy something that youd be perfectly happy to hold if the market shut down for 10 years.
- We simply attempt to be fearful when others are greedy and to be greedy only when others are fearful.
- Why not invest your assets in the companies you really like? As Mae West said, Too much of a good thing can be wonderful.
On Success
- Of the billionaires I have known, money just brings out the basic traits in them. If they were jerks before they had money, they are simply jerks with a billion dollars.
- The business schools reward difficult complex behavior more than simple behavior, but simple behavior is more effective.
- You do things when the opportunities come along. Ive had periods in my life when Ive had a bundle of ideas come along, and Ive had long dry spells. If I get an idea next week, Ill do something. If not, I wont do a damn thing.
- Can you really explain to a fish what its like to walk on land? One day on land is worth a thousand years of talking about it, and one day running a business has exactly the same kind of value.
- You only have to do a very few things right in your life so long as you dont do too many things wrong.
On Helping Others
- If youre in the luckiest 1 per cent of humanity, you owe it to the rest of humanity to think about the other 99 per cent.
- It takes 20 years to build a reputation and five minutes to ruin it. If you think about that, youll do things differently.
- I dont have a problem with guilt about money. The way I see it is that my money represents an enormous number of claim checks on society. Its like I have these little pieces of paper that I can turn into consumption. If I wanted to, I could hire 10,000 people to do nothing but paint my picture every day for the rest of my life. And the GNP would go up. But the utility of the product would be zilch, and I would be keeping those 10,000 people from doing AIDS research, or teaching, or nursing. I dont do that though. I dont use very many of those claim checks. Theres nothing material I want very much. And Im going to give virtually all of those claim checks to charity when my wife and I die.
- Its class warfare, my class is winning, but they shouldnt be.
- My family wont receive huge amounts of my net worth. That doesnt mean theyll get nothing. My children have already received some money from me and Susie and will receive more. I still believe in the philosophy – FORTUNE quoted me saying this 20 years ago – that a very rich person should leave his kids enough to do anything but not enough to do nothing.
On Life
- Chains of habit are too light to be felt until they are too heavy to be broken.
- We enjoy the process far more than the proceeds.
- You only find out who is swimming naked when the tide goes out.
- Someones sitting in the shade today because someone planted a tree a long time ago.
- A public-opinion poll is no substitute for thought.
Funny Ones
- A girl in a convertible is worth five in the phonebook.
- When they open that envelope, the first instruction is to take my pulse again.
- We believe that according the name investors to institutions that trade actively is like calling someone who repeatedly engages in one-night stands a romantic.
- When a management with a reputation for brilliance tackles a business with a reputation for bad economics, it is the reputation of the business that remains intact.
- In the insurance business, there is no statute of limitation on stupidity.
http://klse.talkmalaysia.com/2009/09/25-best-warren-buffett-quotes-on-his-strategies-investments-and-cheap-suits/
Tong Herr to set up a RM632m JV steel billet plant in Vietnam
Tong Herr to set up a RM632m JV steel billet plant in Vietnam
Written by Financial Daily
Tuesday, 25 August 2009 10:21
KUALA LUMPUR: TONG HERR RESOURCES BHD [] is teaming up with four individuals of a Taiwanese family to set up a steel billet manufacturing plant in Vietnam with an investment cost of US$180 million (RM631.8 million).
Tong Herr said yesterday it had entered into a shareholders’ agreement with Tsai Ching-Tung, Tsai Min Ti, Tsai Hung-Chuan and Tsai Yi Ting for the proposed joint venture (JV) in Fuco International Ltd.
The parties had earlier agreed to cooperate in the establishment of the steel billet manufacturing business in Vietnam through Fuco Steel Corporation Ltd.
It said Fuco Steel was granted an investment approval on April 2, 2007 by the BaRia VungTau Industrial Zone Authority to produce steel billets in Vietnam.
Subsequently, Fuco Steel had on March 18, 2008 entered into a land sub-leasing contract, amended on April 20, 2009, with the Ministry of CONSTRUCTION [], Vietnam Urban and Industrial Zone Development Investment Corporation to sublease a land measuring about 304,067 square metres at Phu My II Industrial Zone, Tan Thanh District, BaRia VungTau Province for the proposed plant. The duration of the land sublease is until June 29, 2055.
Fuco International’s current shareholders are the Tsai family members. Pursuant to the agreement, Tong Herr would subscribe for a 37.04% stake comprising 18,518 shares for a total of US$19.99 million cash.
Tong Herr said the JV parties would make a total cash investment of US$54 million via the subscription of new shares of US$1,080 each in Fuco International, which in turn will be injected into Fuco Steel, while Tong Hwei Investment Ltd will invest US$6 million cash in Fuco Steel.
It said the balance of US$120 million would be financed by Fuco Steel via borrowings from financial institutions.
Fuco International will have a 90% stake in Fuco Steel, while Tong Hwei will hold the balance 10%. Tong Herr expects the plant to be operational by 2011.
Tong Herr said it would finance its obligations of US$19.99 million from internal funds.
It said the proposed JV was consistent with its objective of seeking various strategic alliances and joint venture for synergistic benefits to enable it to expand into the steel billet manufacturing industry and enter into new overseas market.
“The proposed JV also represents a good opportunity for the group to further expand its revenue in terms of going upstream in the steel industry and hence, to further broaden its earnings base,” it said.
Tong Herr said the investment certificate offered tax incentives such as corporate income tax exemption for the first four years. Fuco Steel was liable to pay corporate income tax, an annual corporate income tax of 5%, instead 10%, for the following nine years, representing a 50% discount from the annual corporate income tax of 10%, tax of 10% for the following two years and 28% annual corporate income tax for the following years as well as other investment incentives.
This article appeared in The Edge Financial Daily, August 25, 2009.
Monday 14 September 2009
*****Warren Buffett's commonsense approach to valuing the stock market
Warren Buffett does not possess a magic formula for determining when the stock market is grossly overvalued or undervalued. By all accounts, his decisions to plunge into or escape from the market are based on several commonsense factors.
1. The relationship between stock yields and bond yields.
2. The rate of climb in the world.
3. Earnings multiples.
4. The state of the economy.
5. The big picture.
----
1. The relationship between stock yields and bond yields.
EY = 1/PE
Bond yields = Coupon rate
- Buffett covets stocks that offer earnings yields that can surpass bond yields over time. (EY of stock > Bond yields)
- When bond yields are rising and threaten to overtake stock yields, the market is generally overvalued. (Bond yields > EY of stock)
- When stocks fall to the point where their earnings yields are above bond yields, they are most attractive. (EY of stock > Bond yields)
2. The rate of climb in the market.
History tells us that the stock market cannot outperform the economy for very long. That is, you shouldn't expect corporate sales, earnings, or share prices to rise at rates in excess of economic output.
- If stock prices are rising at, say, four times the rate the economy is expanding, the market is primed for a fall at some point.
- Conversely, if stock prices are falling while the economy is surging, an undervalued condition may be opening up.
3. Earnings multiples.
In 1982, the PE ratio for the S&P 500 index was just 7 (Americans were willing to pay just $7 for every $1 corporations earned on their behalf).
By mid-1999, Americans were willing to pay $34 for every $1 of earnings generated by these same companies.
What explained the disparity?
- Falling interest rates accounted for some of the increase in PE ratios. Declining rates make every $1 of earnings worth more to an investor.
- Improved profitability also accounted for some of the increase in PE. By the late 1990s, corporate returns on equity and assets had reached 70-year highs. It stood to reason that $1 of earnings carried more value because corporations could reinvest earnings at high rates.
- Yet the majority of the climb in stock prices can be attributed to emotion - the sheer willingness of investors to pay higher and higher prices without regard to value.
4. The state of the economy.
When the economy is running full throttle and there seems to be little chance of it sustaining present growth rates, investors should ponder whether to decrease their exposure to the stock market and find alternatives.
Likewise, during tough economic times, stocks usually fall to bargain levels and offer high rate-of-return potential. Using Buffett's 15% rule, you can quickly gauge whether stocks are worthy of holding.
The general rule is to buy during a recession (when PE ratios are at their lowest) and to sell when the economy can't get any stronger (and PE ratios are their highest).
5. The big picture
Because Buffett endeavors to hold a stock for several years or more, he must take a more holistic view of companies, industries, and the entire market before buying.
Buffett won't buy or sell a stock in response to near-term changes in a company's profitability, nor will he pin his hopes on a sector "catching fire" on Wall Street to sell at a higher price.
Instead, he assesses longer-term fundamentals in the economy and the market and examines whether those fundamentals can support higher stock prices. If a stock doesn't offer the potential rate of return he seeks, he is likely to sell the security or avoid buying.
http://spreadsheets.google.com/pub?key=t7u4BYlpDKstozulNims5Hw&output=html
From the above spreadsheet, Buffett prefers to play an economic cycle to the fullest, whenever possible.
- During a recession, when nearly all US industries are experiencing a downturn, Buffett is apt to load up on numerous stocks, knowing that several consecutive years of improved profitability lie ahead.
- When the economy peaks and odds favour an eventual slowdown, selling is the prudent course.
- When stocks fall to the point where their earnings yields (1/PE) are above bond yields, they are most attractive. (EY of stock > Bond yield)
Buffett's success in gauging market conditions and profiting from them
Buffett - whether by accident or calculation - must be recognized as one of the most astute market timers in history.
His ability to sense great perils in the market or see great opportunity when others see peril sets him apart from even the legendary market timers such as George Soros or Michael Steinhardt. It is also a chief reason he rarely suffers a yearly loss in his portfolio. His ability to find bargain stocks is well documented. Less known is his success in gauging market conditions and profiting from them. When Buffett begins talking up or down the market, it pays to listen.
His form of market timing is similar to Wayne Gretzsky's approach to hockey - don't go where the puck is, go where it's going to be. The great investors of the twentieth century all seemed to have a penchant for discovering undervalued securities, but they also were forward looking.
When a recession was under way, they didn't brood. They looked for signs that a recovery was at hand. And when the economy was strong, they stayed mindful of the risk of a slowdown and planned accordingly. When playing the market, they looked for catalysts that could propel an industry ahead, even when Wall Street had turned negative on the sector. Conversely, they wouldn't wait for boom times to end but would sell ahead of others.
Click: http://spreadsheets.google.com/pub?key=t7u4BYlpDKstozulNims5Hw&output=html
Warren Buffett owes his success through the years as much to what he didn't buy as to what he did. Likewise, what he sold - and when he sold it - played just as prominent a role in his returns as did decisions to buy and hold Coca-Cola, GEICO, or Gillette. Whitney Tilson of Tilson Capital Partners in New York, a frequent columnist to The Motley Fool website, reminds us that Buffett made no fewer than four distinct market-timing calls in his career, each of which proved correct and highly profitable.
MARKET CALL 1: SELLING OUT BEFORE THE EARLY 1970s BEAR MARKET.
MARKET CALL 2: GOING LONG IN 1974
MARKET CALL 3: SEEING THE OPPORTUNITIES THAT WOULD OPEN UP IN THE 1980s
MARKET CALL 4: AVOIDING THE 1987 CRASH
Again and again, Warren Buffett will tell you that he is not concerned about day-to-day fluctuations in the stock market. It doesn't matter to him whether the Dow Industrials rises 300 points in a single day or falls by the same amount. He doesn't care whether the interest rates rose or fell for the day, or whether his portfolio declined $200 million in value (a frequent occurrence in 1999, by the way). "The market is there only as a reference point to see if anybody is offering to do anything foolish," he was quoted saying in 1988, "When we invest in stocks, we invest in buisinesses."
Buffett: Keeping abreast of market conditions
Market Call 1: Selling Out Before the Early 1970s bear market
Beginning in 1968: Buffett began to express sincere worries over stock prices. Writing near the peak of the go-go market of the 1960s, Buffett seemed to sense imminent danger to investors.
1969: Unable to find enough quality stocks at reasonable prices, he folded his investment partnership in 1969, acknowledging that his form of diligent, research-intensive stock-picking couldn't compete in a momentum-fed, short-term oriented market. "Spectacular amounts of money are being made by those participating in the chain-letter type stock-promotion vogue," he wrote his clients. "The game is being played by the gullible, the self-hypnotized, and the cynical."
"I believed the odds are good that, when the stock market and business history of this period is being written, this phenomenon regarded as of major importance, and perhaps characterized as a mania." Frustrated by the lack of sensible pricing and the inability of value-oriented managers to make headway amid a sea of momentum value fund managers, Buffett liquidated clients' accounts, put most of his personal wealth into Berkshire Hathaway stock, and stayed mostly out of the money-management business for almost 5 years. He stayed on the sidelines while Americans experienced the most brutal bear market since the crash of 1929 to 1933.
1973 - 1974: The market declined more than 60% during the crash of 1973 to 1974.
Market Call 2: Going Long in 1974
1968: Market peaked.
1973-1974: Five years after the market had peaked, most Americans had turned disillusioned by the stock market. The average portfolio had dropped 40% or more in value. Investors holding the great blue chips of the day - Xerox, Walt Disney, IBM, General Motors, and Sears Roebuck, for example - saw their portfolios decline more than 60% during the crash of 1973 - 1974.
To investors caught in the middle, it seemed like there was no end to the panic selling. Some individuals tried holding their stocks, waiting for a rebound that never took place. Exhausted, they gave in and sold after watching their portfolios lose 50% of their value. The rest took their cues from the market itself. Daily declines reinforced a selling mentality: Selling begat selling, and an orderly market turned into a vicious cylce of losses.
1974: At the bottom, in 1974, few investors could be coaxed to reenter the arena. But Buffett, refreshed from a 5-year hiatus and sitting on plenty of cash, dove headlong into the same stocks the market could no longer tolerate. Like a boy in a candy store, Buffett found more values than he could possibly digest. An investor who plunged into the market at the 1974 low made a 74% return within 2 years.
Comment:
Buffett has a good understanding of market conditions. He has the ability to value stocks and know when stocks and market are overpriced. His action in completely getting out of the market was interesting. His patience in staying on the sideline was remarkable too. How many could stay in the sideline without reentering at the slightest correction? How remarkable it was too that he chose the depth of the market in 1974 to reenter. Superb ability indeed!
Three most important questions about the stock market
Following are the three most important questions to answer about the stock market:
Is the Stock Market too expensive?
Is the Fed (government) in the way?
Is the Market going up?
The answers to these questions cover nearly all of the bases that affect the markets.
http://books.google.com/books?id=aydxD_IkJBMC&pg=PA65&lpg=PA65&dq=understanding+stock+market+conditions&source=bl&ots=9Q0jwhuGQj&sig=6XdEIyPTZUFI-v1kOHQXKFyF460&hl=en&ei=2MGtSuyINtSBkQX618CVBg&sa=X&oi=book_result&ct=result&resnum=8#v=onepage&q=understanding%20stock%20market%20conditions&f=false
Safe Strategies for Financial Freedom
By Van K. Tharp, Doyle Rayburn Barton, Steve Sjuggerud
Stock Market Sectors Classification
Stock Market Sectors Classification
There are many ways in which stocks can be classified. One of the most preferred ones is by the sector in which the particular business that issues the stocks falls. This classification, which includes the grouping together of companies from the same sector, is done for the purposes of facilitating comparisons between the companies' stocks.
However, many classifications by sectors can be found. One of them divides the market into eleven sectors, where two of them are referred to as defensive, whereas the other nine are referred to as cyclical.
Let's now turn our attention to these two classifications and examine them at a closer look.
Cyclical Stocks
Stocks from the cyclical classification tend to be sensitive to the market conditions, especially to its cycles, as their name implies. The good news is that if one sector is down, another sector may experience an upward trend.
This classification includes nine of the sectors that fall in the sector division. They are as follows:
1.Capital Goods
2.Energy
3.Technology
4.Health care
5.Communications
6.Transportation
7.Basic materials
8.Consumer cyclical
9.Financial
As it can be seen from the list above, investors will not find any difficulty in recognizing whether a particular business belongs to one cyclical sector or another.
Defensive Stocks
This classification includes two of the sectors that fall in the sector division. They are as follows:
1.Utilities
2.Consumer staples
These sectors are less susceptible to market cycles since no matter what the market conditions are people will not stop consume food or electricity. Stocks from these sectors are used as a balancing and protection mechanism by many investors in their portfolios in case the market starts to go down.
However, the advantage of defensive stocks can be their drawback as well. This is so, since no matter what the conditions of the market are people will probably not start to consume more energy or food, so when the market is up, the prices of defensive stocks may not go up as well.
Stock Sectors Purpose
The main purpose of stocks sectors is to facilitate investors' comparison of different stocks. Moreover, comparison of stocks within a particular sector can be very useful if you want to see how your sectors are performing relative to stocks within the same sector.
However, try to use the classifications of various sources, since different sources use different set of sectors.
Final Piece of Advice
Use stock sectors to make effective and reliable comparisons between your stocks and the other from the same sector. This is recommended in order to see whether there are any drastic differences in the performance and if there are such to regulate the disparities.
For knowledge we can highly recommend you subscribe to the The Wall Street Journal.
http://www.stock-market-investors.com/stock-investing-basics/stock-market-sectors-classification.html
Find a Stock Investing Strategy that Works for You
Find a Stock Investing Strategy that Works for You
By Ken Little, About.com
Investing in stocks can be as simple or as complicated as you want to make it. The important part of that sentence is the personal pronoun “you.”
Too often investors are led to believe that investing in stocks must be a complicated, deeply analytical process involving hours of pouring over financial statements, analysts’ reports, spreadsheets and market analysis before making a decision.
For some investors, this is the only way they feel comfortable investing and they enjoy the digging for information as much as the actual return on investing.
What Works
The complicated analytical approach to investing works for them, but that doesn’t mean it is the only way to successful investing or that it works for every investor.
You may not have the time or educational background to do the complicated financial analysis of every stock you make buy. Does that mean you will be less successful?
Not necessarily, some investors who do tons of research still get it wrong. Still, what can you do to improve your chances for investing success if you aren’t the analytical type and don’t have a lot of time to devote to research?
•Keep the number of targets small. Set your parameters tight to limit your universe. For example, say you’re interested in the health care industry. Pick out a sector in that industry and focus on the leaders (market leaders, not price leaders).
•If your objective is growth, invest in growth industries. This may seem obvious, but it is easy for investors to get side tracked. You will probably do better with a so-so company in a growth industry than a great company in an industry that’s going nowhere. If you want growth, invest in technology or one of the other growth industries and don’t waste your time on utilities alone.
•Invest in market leader wherever you find them if they are overpriced. Market leaders are companies that dominate their corner of the industry and the ones you are looking for are so entrenched it will be hard to dislodge them. Microsoft is the obvious example of a market leader. I’m not suggesting investing in Microsoft, that’s your decision, but they are in no danger of losing their position of market dominance. Of course, you would have said the same thing about GM 10 or 15 years ago.
Conclusion
The point is that you should find an investing strategy that works for you. If it is complicated and data heavy or simple and more intuitive, make it yours and don’t be bullied into adopting another’s strategy.
Normal Stock Guidance Doesn’t Apply
Normal Stock Guidance Doesn’t Apply
Extreme Conditions May Distort Normal Market Evaluations
By Ken Little, About.com
In a normal market, I would (and have) advised that investors look for bargains in stocks that have fallen into the value category.
A value stock is one that has been under-priced by the market. Value investors look for these stocks and buy them at a discount to their intrinsic value.
When the market corrects the price of the stock - meaning others have discovered this under-priced gem and are buying the shares - the value investor pockets a nice profit.
One of the keys to this strategy is the phrase “normal market.”
The market of late is anything but normal, in case you hadn’t noticed.
If you are confused about what to do in this market, don’t feel like you’re alone.
Experts are confused and frustrated by market conditions that don’t fit the typical models.
With large swings from low to high and back again, the long-term investor may be better off doing nothing.
If you are invested in good companies, you are probably better off sitting tight and waiting for the current crisis to work its way out.
This is not a rule, but a suggestion. If you are so concerned about your investments that you can’t sleep, then take whatever steps you need to protect you mental and emotional health.
No one can tell you with certainty what is the proper course of action.
Normal markets will return one day, but there is no way to know how long that will take.
In the meantime, if you spot a good buy in a stock, consider whether you are willing to hold it through more turbulent times that are surely to come.
http://stocks.about.com/od/evaluatingstocks/a/092208Marrisk.htm
How to Boost Your Earning Power in a Recession
How to Boost Your Earning Power in a Recession
While some people see the current economic recession as a time of worry, a small but growing group is actually taking advantage of current conditions to boost their long term earnings power.
These people are using the slowdown and the resulting changes in government and corporate priorities to ensure that they are better positioned than the competition to get and keep the best jobs in the coming years.
And they are doing it by getting an online degree.
Experts have long known that the higher the level of your degree the more you will earn throughout your life. In fact, compared to a high school degree, an employee with:
an associate degree will earn an average of $5,600 more per year
a bachelor's degree will earn an average of $21,100 more per year
a master's degrees will earn an average of $33,900 more per year
Why now?
What is it about our current economic climate that makes the right degree so much more important and, above all, achievable:
Firstly, the recession has made companies' future profits very uncertain. As a result they are being far more selective in whom they hire. Today, having a relevant degree on your resume often means the difference between being considered for a position and being passed over completely.
Secondly, the economy is changing. Traditional industries are fading, while new industries such as health care, information services, and homeland security are growing. These generally pay well, but require workers with specific technical skills. These skills are typically not learned in standard 4 year degrees, but can easily be obtained through shorter associate degrees in specific vocational fields.
Thirdly, the rapid expansion of high speed Internet has made it possible for universities to offer online degrees that are highly respected by employers. This makes it far easier for people that are currently employed, or have family responsibilities to obtain their degree.
Lastly, as a result of the recession, the government has stepped in to help subsidize individuals' efforts to return to school to get better trained - and these subsidies are available for online education degrees as well.
Where to start?
If you're interested in maximizing your value to employers and your earnings power, the first thing to do is identify the best degree based on your preferences, job experience, and education. Next, determine which schools offer the right courses. Then investigate financing options that can help pay for all or some of the degree.
Fortunately, there are some great free online services that will quickly help you navigate through available options and find the programs that are exactly right for you.
One of the best is a service called BuildACareer.net. They work with dozens of universities offering associate, bachelor's and master's degrees along with financial aid.
If you want to be one of those people that comes out of this recession in a stronger position, BuildACareer.net may be the place to start.
http://howlifeworks.com/career/boost_earnings/?cid=8088kf_finance_rm
The Buy and Hold Strategy And Your Long Term Investment Horizon
The consequences of the buy and hold investment strategy.
http://www.thedigeratilife.com/blog/index.php/2009/03/20/buy-and-hold-strategy-long-term-investment-horizon/
http://www.thedigeratilife.com/blog/index.php/2009/03/20/buy-and-hold-strategy-long-term-investment-horizon/
My Long Term Experience With An Investment Newsletter
My Long Term Experience With An Investment Newsletter
by Silicon Valley Blogger on November 12, 2007
http://www.thedigeratilife.com/blog/index.php/2007/11/12/my-long-term-experience-with-an-investment-newsletter/
by Silicon Valley Blogger on November 12, 2007
http://www.thedigeratilife.com/blog/index.php/2007/11/12/my-long-term-experience-with-an-investment-newsletter/

Bullish Trends and Significant Corrections
- Bullish Trends and Significant Corrections
June 19, 2009 - Non-Client Version
We were recently asked by a client, "If you see signs of a possible new bull market, why are we still sitting on so much cash?" It can be answered by using a fence analogy. We have been taking some smaller positions while maintaining a relatively high cash position in order to play both sides of the fence:
The Far Side Of The Fence: If stocks move lower,
- Our smaller positions reduce risk during a correction, and we have cash on hand to invest during/after a correction. If the bear market resumes (anything is possible), we have less exposure to losses with some cash on hand.
- Numerous asset classes have had significant moves off the March 2009 lows.
- Even markets which have a positive trend, correct from time to time.
- Corrections, within the context of an uptrend, can be significant.
- If a correction is orderly, we can use cash to enter markets at lower levels.
- If the correction is not orderly and a resumption of the bear looks more likely, cash and smaller positions enable us to better manage risk. If your investments lose 12%, but you have 50% of your account in cash, the loss to your account is 6%.
- As our strategy dictates, we gradually make the transition from a bear market portfolio to a bull market portfolio, and remain aware we could be wrong about bullish outcomes. If we are wrong, we stop the transition and reverse course gradually.
The Near Side Of The Fence: If stocks continue to move higher,
- We have an opportunity to participate.
- In the 2007-2009 bear market, markets came down rapidly with little in the way of countertrend moves, which means it is possible a similar situation may occur on the way back up – a rapid climb with little in the way of significant countertrend moves (which is what has happened so far during this rally). It is possible those who wait for a significant correction, will only get that opportunity from much higher levels. A significant correction is coming - the question is from what levels (now or later).
- In early June, numerous asset classes “broke out” above resistance levels which can offer a lower risk entry point since what was resistance becomes support.
http://www.ciovaccocapital.com/sys-tmpl/fencesitting/
2009-2010: Evidence of Cyclical Bull and Reflation
2009-2010: Evidence of New Cyclical Bull Markets
At CCM, we do not believe in making investment decisions based exclusively on financial market forecasting. We instead look for fundamental and technical alignment to support and confirm forecasts. The transition from a bear market to a bull market takes time. Long-term investors can migrate from bear market allocations to bull market allocations as evidence of a primary trend change unfolds over several months.
In mid-April of 2009, the NASDAQ made an important new high, which may have signaled the first major step in the transition from a bear market to a bull market. The research below covers numerous observable events which point to the possibility of a new cyclical bull market taking shape in 2009. Cyclical bull markets can last from a few months to a few years, which is in contrast to a secular bull market which can last for 20 years or more. We do not believe all the elements are in place for a secular bull market, but we must respect that cyclical bull markets can last continue for years. For example, many believe the 2003-2007 bull market was of the cyclical variety. Cyclical or secular, the market went up for four years in the last bull market, which presented an opportunity for investors. Based on studies of post recession periods and periods after the S&P 500’s 200-day moving average turns up, it is reasonable to surmise stocks could rally into the early spring of 2010.
Corrections To Be Expected
A cyclical bull market does not mean the coming months will be easy for investors. The market never makes anything easy for anyone. Significant corrections coupled with periods of uneasiness and fear are to be expected in any bull market, secular or cyclical. With a recent successful retest of lows in the S&P 500 and many markets well above their 200-day moving averages, we can afford to give our investments a little more rope during the inevitable corrections in asset prices. As time goes on, stop-loss orders and risk management techniques should be able to take on a diminished role as we will err on the side of remaining invested into early 2010.
If conditions deteriorate and the markets migrate back toward a bearish stance, we will be willing to accept the possibility that the current bear has further to run. However, bullish evidence is not in short supply as we enter the second half of 2009. We will continue to monitor the markets and invest based on the observable evidence at hand. The observable evidence at hand remains bullish.
Focus Remains on Money Supply Expansion, Asia, and Commodities
Since we have economic data and technical evidence in hand that support further gains in asset prices, for the balance of 2009 and for a portion of 2010, we will focus on the three themes below and place a reduced empasis on the two themes that follow.
Primary Drivers Next 10-12 Months
Expansion of the money supply / fiat currency concerns / inflation
Commodities, clean energy, and water
Economic shift from United States to Asia
Secondary Drivers Next 10-12 Months
Infrastructure & government programs (slow implementation of some programs)
Baby boomers' transition from consumers to savers / consumer deleveraging (still important long-term)
http://www.ciovaccocapital.com/sys-tmpl/2009bullmarkets/
Markets Make Significant Progress In Transitions From Bear Markets To Bull Markets
The transition from a bear market to a bull market is just that; a transition. Transitions take time and are not binary events like turning a light on or off. Transitions in any market can be frustrating and stressful, but if we continue to focus on the most important and telling indicators, the market should get us pointed in the right direction and aligned with the primary trends.

While there are numerous signs which can indicate the possible transition from a bear market to a bull market, the following two milestones are of uppermost importance:
- When the 50-day moving average crosses, and more importantly holds above, the 200-day moving average,
- When the slope of the 200-day moving average turns positive.
During an established bull market, a good way to eliminate less attractive markets or investment alternatives is to discard those that have a negatively sloped 200-day moving average. At the end of a bear market, it takes time for a market to send signals of the potential staying power of a rally via a positive change in the slope of a 200-day moving average. As shown in the chart below, even though stocks began to bottom in mass in March of this year, we only started to see positive changes in the slopes of 200-day moving averages in the last two weeks.
http://www.ciovaccocapital.com/sys-tmpl/200turnuppublic/
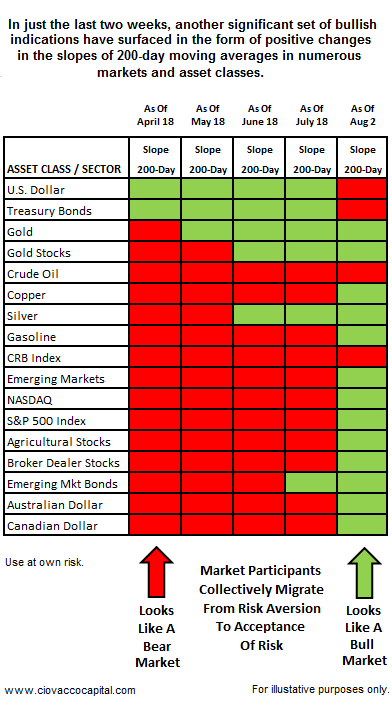
Stocks Perform Well After A Recession
If the recession has already ended as evidence suggests, then the next six to twelve months may offer an opportunity for investors.
Stocks were higher both six and twelve months after the end of nine out of the ten recessions („49, „54, „58, „61, „70, „75, „80, „82, „91, „01). The exception was 2001. However, the slope of the S&P 500‟s 200-day moving average never turned positive in 2001, which is not the case in 2009. Commodities historically have performed well following recessions.
http://ciovaccocapital.com/CCM%20ASD%20AUG%202009%20PDF.pdf
Subscribe to:
Posts (Atom)