Excluding the very high PEs and very low PEs at the extremes, its usual historical PE ranged from low PE of 8.3 to high PE of 11.9 and its average or signature PE was 9.8.
At the current price of RM 11.40 per share, it is trading at a PE of 7.08x and its DY is 4.34%.
2009 to 2022
It EPS grew from 58.28 sen in 2009 to 157.64 sen in 2022. It has grown its EPS 2.7x.
Its EPS grew at a faster rate from 2009 to 2015 (doubling over 6 years) and grew at a slower rate from 2016 to 2022 (EPS increased by about 50%),
Excluding the very high PEs and very low PEs at the extremes, its usual historical PE ranged from low PE of 11.2 to high PE of 16.5 and its average or signature PE was 14.1.
It paid out 35% of its earnings as dividends and grew its earnings by 99.36 sen (157.64 - 58.28 sen). It retained 957.61 sen (1473.01 sen - 515.4 sen). The return on its retained earnings (RORE) is thus, 10.4% (99.36 sen / 1473.01 sen).
Its usual DY ranged from low DY of 2.38% to high DY of 3.12%.
At the current price of RM 19.90 per share, it is trading at a PE of 11.06x and its DY is 2.96%.
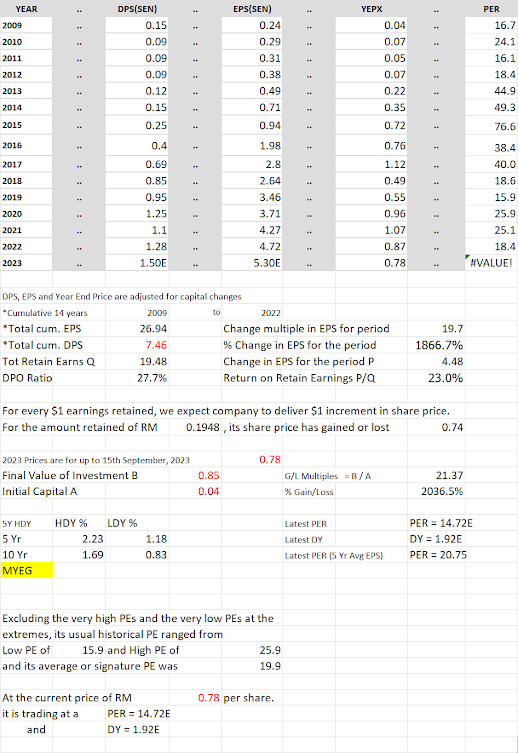
2009 to 2022
It EPS grew from 0.24 sen in 2009 to 4.72 sen in 2022. It had grown its EPS 19.7x.
Its EPS grew 11.7x, at a fast rate from 0.24 sen in 2009 to 2.8 sen in 2017. Its EPS dropped from 2.8 sen inn 2017 to 2.64 sen in 2018. From 2018, its EPS grew from 2.64 sen to 4,72 sen in 2022; it grew 1.8x.
Its PE expanded from PE of 16.1 in 2009 to PE of 76.6 in 2015. From 2015/16, its PE contracted from this highest PE to PE of 18.4 in 2022.
Excluding the extremely high PEs and extremely low PEs, the usual historical PE for MYEG ranged from low PE of 15.9 to high PE of 25.9 and its average or signature PE was 19.9.
It paid out 27.7% of its earnings as dividends and grew its earnings by 4.72 sen - 0.24 sen = 4.48 sen. It retained 26.94 sen - 7.46 sen = 19.48 sen. The return on its retained earnings is thus, 4.48 sen / 19.48 sen = 23%.
Its usual DY ranged from low DY of 0.83% to high DY of 2.23%.
At the current price of RM 0.79 per share, it is trading at a PE of 14.8x and its DY is 1.91%.
From 2009 to 2022, it has grown its earnings per share 2.9 times, from 47 sen to 136.65 sen.
It paid out 99% of its earnings as dividends and despite retaining only 1% of its earnings, it was able to grow its earnings 2.9 times.
At the price of RM 23.56 per share, it is trading at a PE of 18.12x.
Excluding the extremely high PEs and extremely low PEs, the usual historical PE for Heim ranged from 14.8 to high PE of 25.6 and its average PE was 20.5.
Its usual DY ranges 3.33% to 5.26%. At RM 23.56 per share, its DY is 5.86%.
From 2009 to 2022, it has grown its earnings per share 2.26 times, from 13.93 sen to 31.5 sen.
It paid out 48.2% of its earnings as dividends and grew its earnings by 31.5 sen - 13.93 sen = 17.57 sen. It retained 340.44 sen - 164.03 sen = 176.41 sen. The return on its retained earnings is thus, 17.57 sen / 176.41 sen = 9.96%.
At the price of RM 4.14 per share, it is trading at a PE of 12.07x and its DY is 4.35%.
Excluding the extremely high PEs and extremely low PEs, the usual historical PE for PBB ranged from low PE of 13.4 to high PE of 15.7 and its average or signature PE was 14.5.
Its usual DY ranged from low DY of 3.04% to high DY of 4.35%.
China's economy has slipped into deflation as consumer prices declined in July for the first time in more than two years.
The official consumer price index, a measure of inflation, fell by 0.3% last month from a year earlier.
Analysts said this increases pressure on the government to revive demand in the world's second largest economy.
This follows weak import and export data, which raised questions about the pace of China's post-pandemic recovery.
The country is also tackling ballooning local government debt and challenges in the housing market. Youth unemployment, which is at a record high, is also being closely watched as a record 11.58 million university graduates are expected to enter the Chinese job market this year.
Falling prices make it harder for China to lower its debt - and all the challenges which stem from that, such as a slower rate of growth, analysts said.
"There is no secret sauce that could be applied to lift inflation," says Daniel Murray from investment firm EFG Asset Management. He suggests a "simple mix of more government spending and lower taxes alongside easier monetary policy".
Most developed countries saw a boom in consumer spending after pandemic restrictions ended. People who had saved money were suddenly able and willing to spend, while businesses struggled to keep up with the demand.
The huge increase in demand for goods that were limited in supply - coupled with rising energy costs after Russia's invasion of Ukraine - inflated prices.
But this is not what happened in China, where prices did not soar as the economy emerged from the world's tightest coronavirus rules. Consumer prices last fell in February 2021.
In fact, they have been at the cusp of deflation for months, flatlining earlier this year due to weak demand. The prices charged by China's manufacturers - known as factory gate prices - have also been falling.
"It is worrisome as far as it shows that demand in China is poor while the rest of the world is awakening, especially the West," Alicia Garcia-Herrero, an adjunct professor at the Hong Kong University of Science and Technology, said.
"Deflation will not help China. Debt will become more heavy. All of this is not good news," she added.
China produces a large proportion of the goods sold around the world.
A potential positive impact of an extended period of deflation in the country may be that it helps to curb rising prices in other parts of the world, including the UK.
However, if cut-price Chinese goods flood global markets it could have a negative impact on manufacturers in other countries. That could hit investment by businesses and squeeze employment.
A period of falling prices in China could also hit company profits and consumer spending. This may then lead to higher unemployment.
It could result in a fall in demand from the country - the world's largest marketplace - for energy, raw materials and food, which would hit global exports.
China's economy is already facing other hurdles. For one, it is recovering from the impact of the pandemic at a rate that is slower than expected.
On Tuesday, official figures showed that China's exports fell by 14.5% in July compared with a year earlier, while imports dropped 12.4%. The grim trade data reinforces concerns that the country's economic growth could slow further this year.
China is also dealing with an ongoing property market crisis after the near-collapse of its biggest real estate developer Evergrande.
The Chinese government has been sending the message that everything is under control, but has so far avoided any major measures to encourage economic growth.
Building confidence among investors and consumers will be key to China's recovery, Eswar Prasad, a professor of trade policy and economics at Cornell University, said.
"The real issue is whether the government can get confidence back in the private sector, so households will go out and spend rather than save, and businesses will start investing, which it hasn't accomplished so far," Professor Prasad said.
"I think we're going to have to see some significant stimulus measures (including) tax cuts."
Additional reporting by BBC business reporter Peter Hoskins.
https://www.bbc.com/news/business-66435870