Is the Stock Market Cheap?
The Valuation Thesis
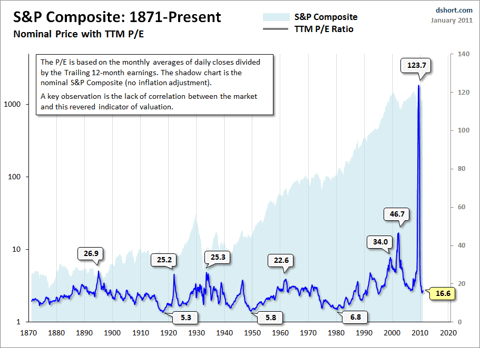
A standard way to investigate market valuation is to study the historic Price-to-Earnings (P/E) ratio using reported earnings for the trailing twelve months (TTM). Proponents of this approach ignore forward estimates because they are often based on wishful thinking, erroneous assumptions, and analyst bias.
The average P/E ratio since the 1870's has been about 15. But the disconnect between price and TTM earnings during much of 2009 was so extreme that the P/E ratio was in triple digits — as high as the 120s — in the Spring of 2009. In 1999, a few months before the top of the Tech Bubble, the conventional P/E ratio hit 34. It peaked close to 47 two years after the market topped out.
As these examples illustrate, in times of critical importance, the conventional P/E ratio often lags the index to the point of being useless as a value indicator. "Why the lag?" you may wonder. "How can the P/E be at a record high after the price has fallen so far?" The explanation is simple. Earnings fell faster than price. In fact, thenegative earnings of 2008 Q4 (-$23.25) is something that has never happened before in the history of the S&P 500.
The P/E10 Ratio
Legendary economist and value investor Benjamin Graham noticed the same bizarre P/E behavior during the Roaring Twenties and subsequent market crash. Graham collaborated with David Dodd to devise a more accurate way to calculate the market's value, which they discussed in their 1934 classic book, Security Analysis. They attributed the illogical P/E ratios to temporary and sometimes extreme fluctuations in the business cycle. Their solution was to divide the price by a multi-year average of earnings and suggested 5, 7 or 10-years. In recent years, Yale professor Robert Shiller, the author of Irrational Exuberance, has reintroduced the concept to a wider audience of investors and has selected 10 years as the earnings denominator. As the accompanying chart illustrates, this ratio closely tracks the real (inflation-adjusted) price of the S&P Composite. The historic average is 16.35. Shiller refers to this ratio as the Cyclically Adjusted Price Earnings Ratio, abbreviated as CAPE, or the more precise P/E10, which is my preferred abbreviation.
The Current P/E10
After dropping to 13.4 in March 2009, the P/E10 rebounded above 20. The chart below gives us a historical context for these numbers. The ratio in this chart is doubly smoothed (10-year average of earnings and monthly averages of daily closing prices). Thus the fluctuations during the month aren't especially relevant (e.g., the difference between the monthly average and monthly close P/E10).
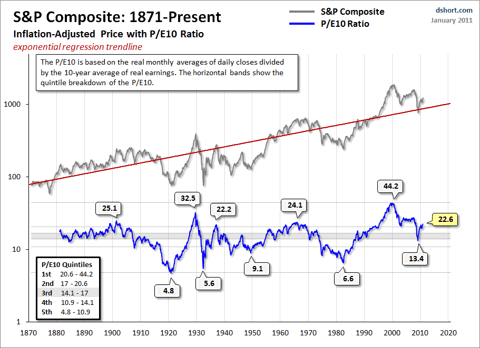
Of course, the historic P/E10 has never flat-lined on the average. On the contrary, over the long haul it swings dramatically between the over- and under-valued ranges. If we look at the major peaks and troughs in the P/E10, we see that the high during the Tech Bubble was the all-time high of 44 in December 1999. The 1929 high of 32 comes in at a distant second. The secular bottoms in 1921, 1932, 1942 and 1982 saw P/E10 ratios in the single digits.
Where does the current valuation put us?
For a more precise view of how today's P/E10 relates to the past, our chart includes horizontal bands to divide the monthly valuations into quintiles — five groups, each with 20% of the total. Ratios in the top 20% suggest a highly overvalued market, the bottom 20% a highly undervalued market. What can we learn from this analysis? The Financial Crisis of 2008 triggered an accelerated decline toward value territory, with the ratio dropping to the upper 4th quintile in March 2009. The price rebound since the 2009 low pushed the ratio back into the 1st quintile. By this historic measure, the market is expensive.
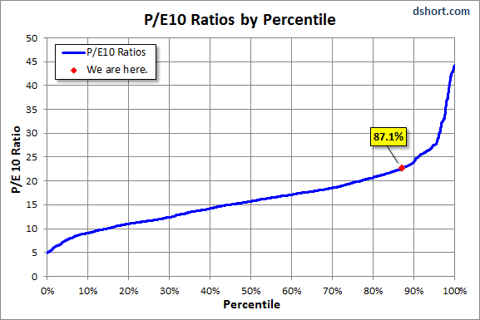
We can also use a percentile analysis to put today's market valuation in the historical context. As the chart below illustrates, latest P/E10 ratio is around the 87th percentile.
A more cautionary observation is that every time the P/E10 has fallen from the first to the fourth quintile, it has ultimately declined to the fifth quintile and bottomed in single digits. Based on the latest 10-year earnings average, to reach a P/E10 in the high single digits would require an S&P 500 price decline below 540. Of course, a happier alternative would be for corporate earnings to make a strong and prolonged surge. When might we see the P/E10 bottom? These secular declines have ranged in length from over 19 years to as few as three. The current decline is now in its tenth year.
Or was March 2009 the beginning of a secular bull market? Perhaps, but the history of market valuations suggests a caution perspective.

(Above graph: real P/E10 based on the ShadowStats Alternate CPI for the inflation adjustment, which suggests that the current market is fairly priced.)
http://seekingalpha.com/article/244408-is-the-stock-market-cheap
Related:
A rally from extreme cheapness to excellent value
No comments:
Post a Comment