This chart shows different countries and their struggle with the bounce back from the Great Financial Crisis.
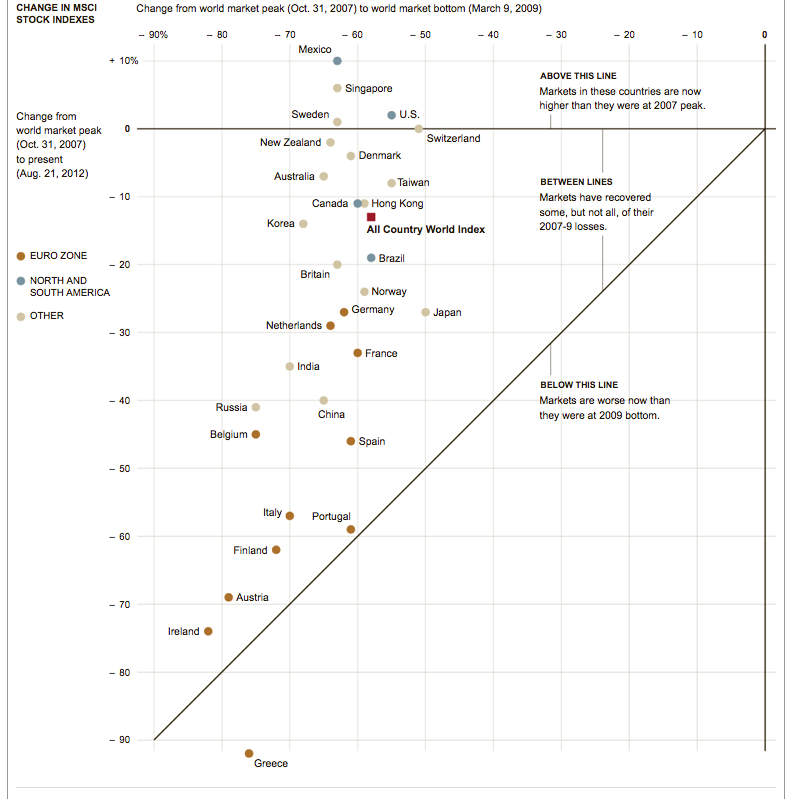
The chart shows the performance of 30 markets as measured by MSCI indexes, and of the MSCI All Country World Index, which includes all markets MSCI classifies as developed or emerging.
Click to enlarge
The X Axis shows how deep the plunge for the countries. As you can see the ones who was best insulated was Japan at –50% and the worse Ireland at > –80%
The Y Axis shows the returns since the market top in Oct 2007. Only 4 countries including Singapore and US is positive. The amazing thing was the PIIGS are still at 2009 doldrums.
No comments:
Post a Comment