Saturday 21 March 2020

15 Very Safe Blue Chips To Buy During This Bear Market


Mar. 16, 2020


Summary

  • The bear market so many have long feared is here. Stocks didn't just enter a bear market last week, they crashed into one with gusto.
  • COVID-19 panic, combined with worst oil crash since the Financial Crisis, have combined to create a perfect storm of fear, literally the second highest in 30 years.
  • However, regardless of when this bear market ends (and it surely will), great companies are always on sale, BUT especially when the market is panicking.
  • CFR, UMBF, ADM, CAT, GD, PH, CNI, GWW, MDT, SWK, TJX, ROST, CB, ADP and APD are 15 very safe blue chips who have collectively delivered 15% CAGR returns over the last 23 years.
  • From today's 25% undervaluation they could deliver about 17% CAGR long-term returns. Just don't forget to always use the right asset allocation for your needs, because when the bears roar on Wall Street, almost no stock is spared short-term pain.


1.  Why are global markets melting down over this?

Because while the COVID-19 Pandemic is indeed a global health crisis, what the market is worried about is the effect on earnings and the economy, both in the US and around the world.

US supply chains have been disrupted, with The Harvard Business Review estimating the end of March will represent peak supply chain disruption.

China's new cases have fallen below 40 per day over the last week (just 18 yesterday) and it's begun lifting travel restrictions, even in Wuhan where all this began.

By Q3 Goldman expects supply chains to be back up and running. By Q4 all COVID-19 effects are expected to reverse, resulting in 4+% GDP growth in 2020.


2.  Does that mean the market is 100% wrong to dive into a bear market? 

No, because the combined effects of the pandemic + oil crash are expected to hurt earnings significantly.


3.  Goldman expects S&P 500 earnings to fall 5% this year due to the pandemic. 

The big hit will come in Q2 and Q3, and then a strong recovery in Q4.

Goldman is forecasting a 27% bear market, that would be relatively short and mild. It expects a market bottom by the middle of the year and then a 31% rally to close the year about -2% for stocks.

That's not necessarily an outlandish forecast, given that the average non-recessionary bear market since 1945 has been a 24% decline.

Goldman Sachs just put out a new research note which states
  • it expects -5% EPS growth for the S&P 500 this year (about $156.75)
  • it expects the S&P 500 to bottom at 2,450 in the middle of the year
  • 2450 on S&P 500 represents a 15% decline from today's levels
  • it represents a forward PE of 15.6 vs 16.3 25-year average (about 4% undervalued)

Goldman expects earnings growth to "collapse" in the second and third quarters of 2020 before rebounding through the end of the year and into 2021. The S&P 500 will bottom out at 2,450 in the middle of the year, roughly 15% lower than its current level, the analysts projected. The fresh low will give way to a fourth-quarter surge and push the benchmark index to 3,200 by the end of 2020, they added." - Business Insider


4.  Of course, the big question is whether or not we get a recession this year.

Jeff Miller and Moody's both estimate about 50% probability of a short and mild recession this year.

For next year the bond market/Cleveland Fed/Haver analytics model estimate about 21% chance of recession.

The bond market is potentially so nonchalant about next year's recession risk because it's now pricing in a near 100% probability of a rate cut to zero on March 19th (Fed meetings last two days).

Moody's estimates that each 25 bp rate cut stimulates economic growth by 0.1% to 0.15% within a year. The Fed will have made the equivalent of 7 rate cuts within two weeks, potential boosting growth by as much as 1% for 2021.

The Fed is also injecting at least $1.5 trillion into the repo market and resuming QE, all to ensure ample liquidity to prevent a repeat of the financial crisis.

So this is the good news. The bad news is that until now and the end of the year we have to deal with the second-highest market volatility in modern history.


5.  Why are some people so worried that this historically mild bear market might become a raging inferno of paper wealth destruction?


Because low oil prices could trigger a wave of bankruptcies in that sector among highly leveraged junk bond rated companies. You can see that until just recently, investment-grade bond yields have been tracking 10-year yields lower. Junk bond yields have been rising throughout this crisis, as bond investors demand extremely high risk-premiums to buy high-risk bonds.

COVID-19 on its own is likely only capable of generating a short and mild recession, similar to the Gulf War oil shock recession of 1990, which lasted eight months and caused a 20% bear market.

BUT the potential is there for cascading loan defaults to trigger significant financial losses for bond investors, banks, and anyone holding high-yield debt.


6.  The Fed's Emergency Rate Cut

The Fed's emergency rate cut (the first since 2008) was NOT meant to cause stocks to go up, as so many think. Rather it was meant to reduce short-term borrowing costs, which are mostly based on LIBOR, which you can see tracks the Fed Funds rate relatively closely.

Along with the Fed's repo short-term and QE long-term bond-buying, which is designed to ensure sufficient liquidity in the financial system, the Fed is just trying to grease the wheels of the financial system.

The goal is to either
  • ameliorate the effects of the economic slowdown, or,
  • if we get a recession, maximize the chances of it being brief, and a recovery being strong and beginning as soon as possible.


7.  Bargains galore for blue chip dividend investors

So how long with the COVID-19 pandemic and bear market last?

In the meantime, there are bargains galore for blue chip dividend investors to cash in on.

There has always been volatility in the stock market and there always will be. That’s guaranteed as long as humans are the ones making buy and sell decisions.
In the short-term, the reasons for market sell-offs feel like they matter a lot. In the long-term, investors tend to forget the specific reasons stocks fell in the past.
In the short-term, market downturns feel like they will never end. In the long-term, all corrections look like buying opportunities.

Regardless of how long this correction lasts, to win in the stock market over the long haul you must be willing to lose over the short-term." -Ben Carlson (emphasis added)


8.  15 Very Safe Blue Chips To Consider During This Bear Market

Dividends are a function of share count, not price.

However, given the rapidly changing nature of the COVID-19 pandemic as well as significant economic/earnings uncertainty, for this article, I wanted to highlight companies with

9/11 blue chip quality
5/5 dividend safety
trading at fair value or better


These 15 blue chips are


Fundamental Stats On These 15 Companies
  • average quality: 9.9/11 blue chip quality vs. 9.7 average dividend aristocrat and 7.0 average S&P 500 company
  • average dividend safety: 5/5 very safe vs 4.7 average aristocrat and 3.0 S&P 500 average
  • average yield: 2.9% vs. 2.3% S&P 500 and 2.7% most dividend growth ETFs
  • average valuation: 23% undervalued vs fairly valued S&P 500
  • average dividend growth streak: 35.7= dividend aristocrat/champion
  • average 5-year dividend growth rate: 10.3% CAGR
  • average analyst long-term growth consensus: 9.0% CAGR vs. 6.3% S&P since 2000
  • average forward PE ratio: 13.6 vs 13.7 S&P 500 bottom on December 24th, 2018
  • average PEG ratio: 1.51 vs. 1.69 S&P 500
  • average return on capital: 58% = 84th industry percentile (very high-quality by Greenblatt's definition)
  • average 13-year median ROC: 65% (relative stable moats/quality)
  • average 5-year ROC trend: +6% CAGR (relative stable moats/quality )
  • average credit rating: A (investment grade, very-high quality)
  • average annual volatility: 24% vs. 15% S&P 500, 26% Master List Average, 22% average aristocrat
  • average market cap: $38 billion
  • average 5-year total return potential: 2.9% yield + 9.0% growth +5.4% CAGR valuation boost = 17.3% CAGR (12% to 22% CAGR with 25% margin of error)
Collectively these this is a group of dividend aristocrats, with a nearly 36-year dividend growth streak, A-rated balance sheet and returns on capital that are in the top 16% of their respective industries and growing over time.
In other words, just the kind of sleep well at night blue chips you can safely buy when bear market choppy waters are upsetting most investors.


9.  Risk management is the most important part of long-term investing success.
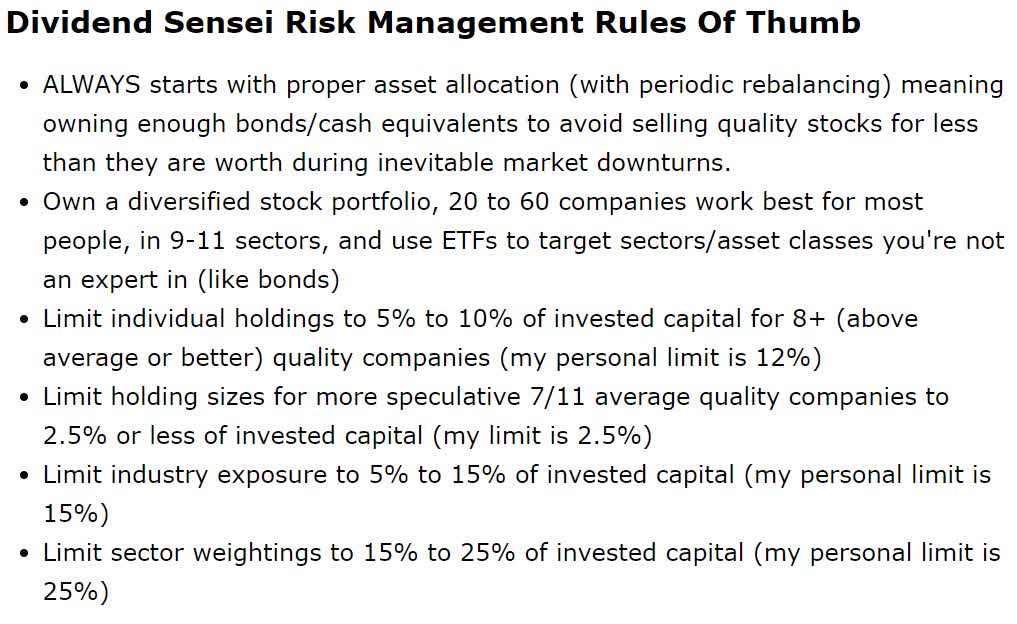
These are the risk management rules I use for all the portfolios I manage including my own. They are merely guidelines to start thinking about the best way to build a sleep well at night bunker portfolio for all market conditions, including bear markets such as this one.


10.  Consider Nibbling Today

Bottom Line: No One Knows Where The Bottom Of Any Bear Market Is So Consider Nibbling On These 15 Safe Blue Chips Today

Here's Ritholtz Wealth Management's CEO, Joshua Brown with what he's telling his clients about market timing right now.
Why don’t we just sell everything and wait this out? Get back in when the dust settles?”
The great answer is that you won’t know when the dust settles. There’s no airplane writing the “all clear” in the sky above your neighborhood. And when the dust settles, do you think stocks will be at their lows? Or will they have already rallied furiously, in anticipation of this? Let me give you an example.
Today is March 9th. Precisely eleven years ago today, in 2009, the stock market stopped going down. There was no reason. The dust had settled, without fanfare or any sort of official announcement. If you had polled people that day, or week or even month, most would not have agreed that we had seen the worst.
The economic headlines were not improving. But there it was. And by June 1st, less than 3 months later, the stock market had climbed 41% from that March low. And even with that having happened, the majority of participants still weren’t clear that the dust had fully settled. That we had, in fact, seen the worst.
There were still people calling us 3, 5 and 7 years later who had gone to cash and still hadn’t gotten back into stocks. They missed a new record-high a few years later and hundreds of percentage points in compounding on their assets." - Joshua Brown, CEO Ritholtz Wealth Management (emphasis added)
Don't get me wrong, I don't know where the bottom of this bear market is, given the factors that are hurting the global economy and corporate earnings right now.
All I do know is that great companies are on sale. I also know that the market, when it becomes excessively fearful becomes very wrong about the intrinsic value of companies.
The prices you see on your screen today are the transitory manic depressive opinions of the often mentally unstable Mr. Market. (If I have offended Mr. Market, my apologies). Mr. Market did not carefully value your companies today and decided that they are now worth less. No, he woke up in a grumpy mood and indiscriminately marked them down as if they were overripe bananas at the grocery store. (You cannot have enough metaphors here.)
The stock prices on your screen say nothing about what these companies are worth. Nothing at all. But that is all that is going to matter in the long run. I promise you one thing: The value of your companies doesn’t change 8% a day, day after day."Vitaliy Katsenelson, CEO of asset management firm IMA (emphasis added)
CFR, UMBF, ADM, CAT, GD, PH, CNI, GWW, MDT, SWK, TJX, ROST, CB, ADP, and APD represent blue chip quality dividend growth stocks with 5/5 very safe dividends that have bright futures ahead of them.

They might not necessarily have a great 2020, but good long-term investing requires looking beyond one or two bad years and looking at the likeliest long-term growth potential.
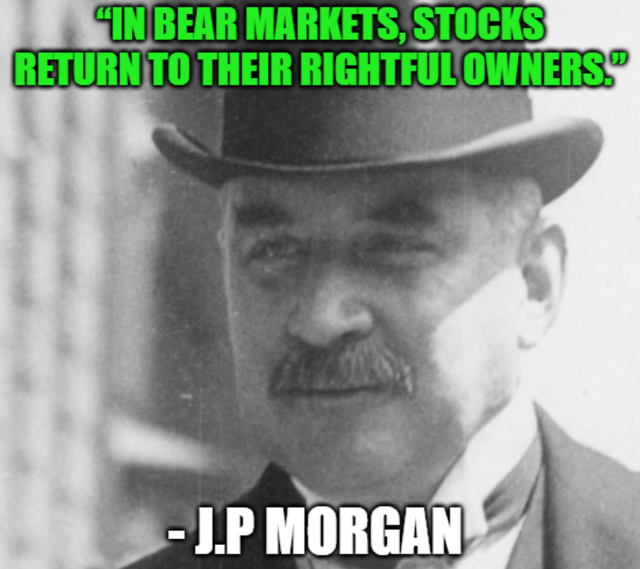


11.  Luck is when preparation meets Opportunity

(Source: AZ Quotes)

By no means am I saying anyone should go "all in" to any stock all at once. That's market timing, and numerous articles I've shown why that doesn't work for regular investors.
I'm a big advocate of buying in stages, nibbling rather than chomping on quality companies at reasonable to attractive valuations.
Where once many of the world's best dividend stocks were overvalued, today you can buy the kind of quality bargains only available in a market panic.
No one rings a bell at the top or the bottom. And 80% of the market's best days come within two weeks of its worst.
According to Bank of America, 99.6% of long-term returns over the last 90 years have come from just the 90 best market days.
So as Buffett famously said, "be greedy when others are fearful" because some of these fantastic quality bargains won't last long.
Whether the market bottoms tomorrow, in mid-2020 or the end of the year, I'm confident that anyone buying these companies today, as part of a diversified, and prudently risk-managed portfolio, will be very pleased with the results in 5+ years.


Wednesday 18 March 2020

The Objective of the Lock-down: Stay At Home - Protect Your COMMUNITY against Covid-19

Image may contain: possible text that says '#Stay At Home Protect your community against COVID-19'

Image may contain: possible text that says 'A arrive and contact with C. No matter how many C, we can find them. Family Friends Colleague Neighbor AVC Cashier Cinema Counter Staff Food Delivery Driver & More'

Image may contain: text

Image may contain: possible text that says 'Quarantined & Obsevered C'

Image may contain: text


Image may contain: possible text that says 'D stay in home & never go out D'


Image may contain: possible text that says 'A go out to find C, passby stranger B in public, A & B dont know each other. Airport Trair Train Station Bus Station Public Toilet Highway Resting Area Taxi Taxi Grab B Restaurent Salon Supermarket Lift Shopping Mall Mall Milk Tea Shop & More'

Image may contain: text

Image may contain: possible text that says 'Basically incubation period is 2 weeks. Within 2 weeks, Group B will show symptoms. FEVER 14 Days B SHORTNESS OF BREATH COUGH'

Image may contain: possible text that says 'By this method, we can Find out Group B. Quarantine & treatment applied. Reduce & stop B2. Until stop the transmission. B2'


Related articles:

Coronavirus: how Malaysia’s Sri Petaling mosque became a Covid-19 hotspot
Gathering at complex on outskirts of Kuala Lumpur has emerged as source of hundreds of new infections across Southeast Asia
Nearly two-thirds of Malaysia’s cases linked to four-day meeting

Only half of the Malaysian participants who attended have come forward for testing, the health minister has said, raising fears that the outbreak from the mosque could be more far-reaching.


Health D-G warns of tsunami-like third wave of Covid-19 if Malaysians don’t play their part now

Health D-G warns of tsunami-like third wave of Covid-19 if Malaysians don’t play their part now

Wed, 18 Mar 2020

KUALA LUMPUR, March 18 — Malaysia could suffer a third wave of Covid-19 infections reaching tsunami-like proportions unless Malaysians strictly adhere to social distancing guidelines, Health director-general Datuk Dr Noor Hisham Abdullah said today.

Dr Noor Hisham made the grim prediction as he reminded Malaysians to stay at home as much as possible to avoid Covid-19 from continuing to spread.

“Today is the first day of our ‘movement restriction order’. In simple words ‘please stay at home’ and distance yourself from others.

“We have a small window of opportunity to break the chain of Covid-19 transmission. Please help MoH to play your part, as each and every one of us has the responsibility to take all the precautionary measures to keep ourselves and families safe,” he wrote in a brief message on his Facebook page earlier today when urging for Malaysians to complement the Health Ministry’s efforts to combat Covid-19.

“Failure is not an option here, otherwise, we might face the 3rd wave of the virus. The next one will be as big as a tsunami, more so if we have a lackadaisical attitude.

“I plead to all Malaysians, please take this movement restriction order seriously. ‘Stay at home’,” he concluded.

Malaysia is under the government’s restriction of movement order now from today until March 31, with all public gatherings banned with the aim of preventing crowds from forming and to slow the spread of Covid-19.


https://www.malaymail.com/news/malaysia/2020/03/18/health-d-g-warns-of-tsunami-like-third-wave-of-covid-19-if-malaysians-dont/1847760


Monday 16 March 2020

Stock Market Bubble Threat

Stock Market Bubble Threat

By Jomo Kwame Sundaram


KUALA LUMPUR, Malaysia, Mar 11 2020 (IPS) -


The US is currently still in a stock market bubble which, if history is any guide, is likely to end, as argued by Thomas Palley. While President Trump would, of course, like to sustain it to strengthen his November re-election prospects, the Covid19 black swan is already showing signs of pricking the bubble

Meanwhile, US business investment has declined for many years. As shares of GDP, corporate profits or even market capitalization, such investment has been in decline for at least four decades. Clearly, ‘neo-liberal’ economic policies have failed to decades-long trend.


Financialization ‘unreal’

Julius Krein has underscored some dangerous financialization trends. Global stocks are now worth almost US$90 trillion, more than world output. Including equities, bank deposits, (government plus private) debt securities, etc., the total value of financial assets rose from US$118 trillion in 2004 to over US$200 trillion in 2010, more than double world output then.

Half of Americans own no stocks, while just ten per cent own over 80 per cent of equities, and the top one per cent has almost 40 per cent. With no increase in real investments, more funds in financial markets have served to worsen wealth inequality.

‘Capital returns’ in 1980, in the form of share buybacks and dividends, were about two per cent of US GDP, when real investment was close to 15 per cent. By 2016, real investment had fallen to around 12 per cent of output, while capital returns had risen to about 6 per cent.

Ironically, in an age of ostensible globalization, rising capital returns has become increasingly national in some economies, rather than involving cross-border capital flows, which fell from US$12.4 trillion in 2007 to US$4.3 trillion, i.e., by 65%.

The rise of finance, at the expense of the real economy, over the last four decades has slowed productive investments and economic growth, ending the post-war Keynesian Golden Age quarter century. Meanwhile, as profit rates declined, debt has increased.


Inflating stock market bubbles

Since the 1980s, as Palley has shown, ‘engineered’ US stock market bubbles have obscured lessons from preceding busts, explaining them away as Schumpeterian creative destruction. While each new bubble may retrieve some of the preceding loss, it never fully restores earlier economic gains.

Investors buy stock, expecting to sell at higher prices. Such purchases push up share prices, drawing new investors into the price appreciation spiral. The share price bubble continues to inflate until faith in ever rising prices ends, with the bubble imploding when enough buyers start selling.

Each new stock market bubble seduces share market punters to invest ever more, to gain even more, while obscuring public understanding of the economic malaise. And when prices fall, many shareowners hold on to their stocks, hoping for prices to recover, to make more, or at least, to cut losses.

Thus, stock market dynamics resemble Ponzi frauds, with earlier investors profiting from new investments. Handsome gains draw in more investments until even these are insufficient to meet rising expectations. Changes in market sentiments can slow the bubble’s growth, or cause reversals, even collapse.

Along the way, all investors feel richer, triggering wealth effects and market exuberance, typically irrational. When downturns occur, many are too embarrassed to admit to losses, especially if they have induced others, relatives and friends, to invest.

Thus, the dynamics of stock market speculative bubbles are akin to a collectively self-inflicted fraud as most retail investors lack the ‘inside’ information needed to make sound portfolio investment judgements.


Promoting stock market addiction

The US Federal Reserve’s apparent commitment to the stock market since Alan Greenspan was in the chair, and its growing, albeit varying influences on financial asset prices has been seen as giving the green light to speculation, enabling serial asset price bubbles over at least three decades.

Despite its balanced official mandate, unsurprisingly, US Fed leadership is widely believed to favour Wall Street, while mainstream economists view asset price inflation as the unavoidable price of overcoming recession, sustaining economic growth and the bubble’s wealth effect.

Unlike the Roosevelt era, when economic policy and war achieved full employment and improved labour conditions, decision-making in recent decades has been seen as better serving capital, with the bias justified by insisting that the interests of capital and labour are ‘joined at the hip’.

With 401K (a US employer sponsored retirement savings plan allowing employees to invest a portion of their salaries before taxes) and other investments in the stock market, widespread ‘middle class’ addiction to stock price inflation has also been economically and politically self-deluding.

But despite the sustained US stock market bubble after the 2008-2009 global financial crisis, the US ‘middle class’ continues to be economically squeezed, with relatively few having benefited significantly.

This stock market addiction is rooted in an illusion promoted by Wall Street, their enablers in the public authorities, and their cheerleaders among mainstream economists and the business media who identify the notion of shared prosperity with stock market indices.

But the history and dynamics of stock market bubbles imply that they simply cannot be the basis for shared prosperity, as suggested by all too many emerging markets’ governments. Sadly, wishful thinking to the contrary perpetuates the mass delusion promoted and perpetuated by those who stand to gain most.

Stock market bubbles serve to obscure the dangers of neoliberal financialization for the economy. Demystification of obfuscating narratives can not only improve public understanding of the problems, dangers and challenges involved, but also inform the reforms needed to address them.


http://www.ipsnews.net/2020/03/corrected-version-stock-market-bubble-threat/?utm_source=English+-+IPS+Weekly&utm_campaign=632464bdfe-EMAIL_CAMPAIGN_2020_03_15_04_37&utm_medium=email&utm_term=0_eab01a56ae-632464bdfe-5479385&fbclid=IwAR3nWVA4e7I-IeHH88Vu2BjDk1zKs054pSBUVX108-1Ly9GukR0rBDEV79w


Tuesday 10 March 2020

Top 50 Best Bursa Malaysia Dividend Stocks of the Year (2018)

Stock Name Total Dividend (cents)
NESTLE 280
PANAMY 248
DLADY 200
PEB 195
BAT 155
UTDPLT 140
CARLSBG 100
HEIM 94
PETGAS 72
PETDAG 70
PBBANK 69
LPI 68
AIRASIA 64
F&N 57.5
MAYBANK 57
BKAWAN 55
TENAGA 53.27
HLBANK 48
HLIND 47
AJI 46.5
KLK 45
AEONCR 41.13
HLFG 40
ORIENT 40
ALLIANZ 40
HAPSENG 35
UCHITEC 34
BURSA 33.6
PCHEM 32
MISC 30
PERSTIM 30
CHINTEK 30
MPI 29
PPB 28
AMWAY 27.5
LITRAK 25
CIMB 25
SAM 23.36
GENTING 21.5
SDRED 21.5
ATLAN 21
TIMECOM 20.56
RHBBANK 20.5
IOICORP 20.5
SCIENTX 20
MAGNI 20
HARISON 20
PETRONM 20
HAIO 20
MAXIS 20


3 Years Continuously Improvement in Dividend (2017,2018,2019)

3 Years Continuously Improvement in Dividend (2017,2018,2019)


Stock Name Dividend (2019) Dividend (2018) Dividend (2017)
AHP 5.75 5.63 5.2
AIRASIA 90 64 12
ALLIANZ 65 40 12
ALLIANZ-PA 78 48 14.4
ARREIT 6.2 6.08 5.49
AXREIT 9.26 8.74 8.26
BIMB 16 15.5 14
BOILERM 2 1.75 1.5
CARING 6 5 3
DIALOG 3.8 3.2 2.65
FPI 11 10 8
FRONTKN 2.5 1.5 0.5
HLBANK 50 48 45
HLFG 42 40 38
HLIND 50 47 45
JOHOTIN 6.4 5 4
KLCC 38 37 36.15
KOTRA 7.4 5 4
MAGNUM 16 15 11
MASTER 2 1.5 1
MBMR 13 12 3
METFSID 2.17 1.99 1.51
OPENSYS 1.5 1.25 1
PBBANK 73 69 61
PETGAS 82 72 66
PTRANS 1 0.95 0.7
RCECAP 9 7 3
SAM 29.05 23.36 17.23
SUNREIT 9.59 9.57 9.19
TIMECOM 29.03 20.56 17.2
TMCLIFE 0.2 0.18 0.17
ZHULIAN 12 10 7.5


Thursday 5 March 2020

The Complete VALUE IMVESTING Guide That Works! by K C Chong (Published 2020)

I picked up this book in Popular Bookshop last week for RM 69.90 and has read many pages.

The author K C Chong has been an active participant in i3 investor forum,  and has shared his investing knowledge generously with the many readers in that forum for many years.

You can now refer to this fine book for the many knowledge, and more, that  K C Chong has shared.

Congratulations to K C Chong.


Topics:
Section 1: Before starting to invest
Section 2: The Stock Market
Section 3: Value Investing, the proven successful investing framework
Section 4: Stock Analysis
Section 5: Investing in good companies at reasonable or cheap price
Section 6: Some proven successful investing strategies
Section 7: Miscellaneous topics


Who is KC Chong?

KC Chong is a retired qualified engineer with more than 40 years of experience in stock investing. He is a dedicated value investor & has coached more than 1,000 students on fundamental value investing. He has a Master in Finance degree & writes frequently on investing & personal finance.


Comments by Cold Eye

Cold Eye "Currently there is a shortage of good reading materials on fundamental investing written by local investment gurus for investor especially stock market newbies. The series of articles written by Mr. KC Chong have certainly helped to fill the vacuum. I am confident that this book will bring a lot of benefits to those looking for guidance. I therefore strongly recommend this book to those who are keen to sharpen their acumen in share investments.


KLCI 30 Component Stocks (Market PE, DY, ROE)


Company Market Cap (b) PE DY ROE Price
10.32 19.22 2.25 5.76 6.22
11.152 7.18 5.41 8.47 3.7
37.112 27.18 2.35 8.42 4.05
44.653 9.79 5.56 8.11 4.5
18.843 31.04 1.14 15.31 3.34
32.5 22.68 4.35 230.38 4.18
16.33 11.7 6.91 7.19 2.75
18.88 9.46 4.41 5.61 4.87
23.527 20.23 3.7 15.83 9.45
21.068 51.32 1.32 16.63 6.23
33.903 12.74 3.2 9.64 15.64
18.177 9.44 2.65 9.63 15.84
49.134 89.03 0.54 2.47 5.6
26.397 40.31 1.9 7.04 4.2
23.48 43.99 2.3 5.15 21.72
42.074 27.7 3.72 21.58 5.38
95.889 11.7 6.68 10.05 8.53
33.077 23.19 4.45 4.11 7.41
33.065 49.14 1.99 101.04 141
69.878 12.68 4.06 12.64 18
45.28 16.08 3.18 9.41 5.66
21.935 26.44 3.85 13.87 22.08
32.372 16.73 5.01 14.61 16.36
19.625 41.68 1.03 13.25 4.86
25.834 22.41 1.54 5.38 18.16
22.897 9.22 3.59 9.63 5.71
13.603 14.57 5 6.42 2
33.321 378.12 0.35 0.66 4.84
71.882 15.87 4.21 7.81 12.64
14.682 39.46 1.31 14.38 5.73
KLCI (Total) 960.890 17.70 3.55% 8.83%
Company Earnings (m) Dividends (m) Equity (m) DPO
536.9 232.2 9321.9 0.43
1553.2 603.3 18337.7 0.39
1365.4 872.1 16216.3 0.64
4561.1 2482.7 56240.2 0.54
607.1 214.8 3965.1 0.35
1433.0 1413.8 622.0 0.99
1395.7 1128.4 19412.1 0.81
1995.8 832.6 35575.3 0.42
1163.0 870.5 7346.7 0.75
410.5 278.1 2468.6 0.68
2661.1 1084.9 27605.2 0.41
1925.5 481.7 19995.1 0.25
551.9 265.3 22343.4 0.48
654.8 501.5 9301.8 0.77
533.8 540.0 10364.2 1.01
1518.9 1565.2 7038.5 1.03
8195.6 6405.4 81548.7 0.78
1426.3 1471.9 34704.3 1.03
672.9 658.0 665.9 0.98
5510.9 2837.0 43598.8 0.51
2815.9 1439.9 29924.8 0.51
829.6 844.5 5981.4 1.02
1935.0 1621.8 13244.1 0.84
470.8 202.1 3553.6 0.43
1152.8 397.8 21427.3 0.35
2483.4 822.0 25788.2 0.33
933.6 680.2 14542.5 0.73
88.1 116.6 13351.9 1.32
4529.4 3026.2 57995.2 0.67
372.1 192.3 2587.4 0.52
KLCI (Total) 54284.3 34083.1 615068.3 0.63


Summary:

KLCI 1491.03    5.3.2020

1.  The total market capitalization of the KLCI 30component stocks is RM 960.89 billion.
2.  The PE of the KLCI 30 component stocks is 17.70, giving a Earnings Yield (E/P) of 5.65%.
3.  The DY of the KLCI 30 component stocks is 3.55%.
4.  The ROE of the KLCI 30 component stocks is 8.83%.
5.  The total earnings of the KLCI 30 component stocks is RM 54.28 billion.
6.  The total dividends distributed by the KLCI 30 component stocks is RM 34.08 billion
7.  The total equity of the KLCI 30 component stocks is RM 615.07 billion
8.  The DPO of the KLCI 30 component stocks is 0.63.
9.  The Price to Book Value ratio of the KLCI 30 component stocks is 1.56