Showing posts with label icap. Show all posts

Tuesday, 26 September 2023

ICAPITAL.BIZ BHD


The NAV of iCap grew from 3,05 per share in 2014 to 3,40 per share in 2023.
Its price traded at a discount to its NAV all these years, this is not unexpected for a closed end fund.
At times it traded at a huge discount to its NAV, for example, in 2021 the discount to NAV was 34% and in 2022, the discount to NAV was 39%.


Saturday, 26 October 2019

iCapital.Biz Berhad price chart since listing


iCapital.biz performance over the last 14 years

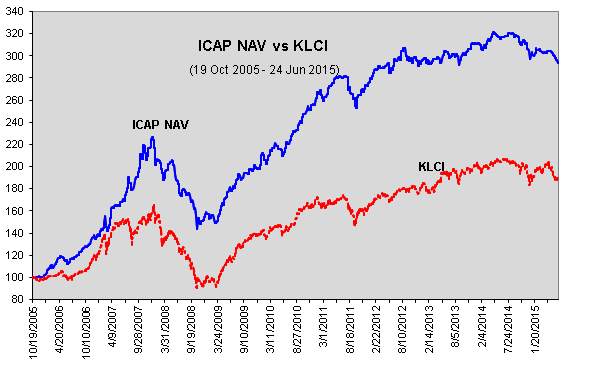
iCapital.biz was listed at the end of 2005 with a NAV of around RM 1.00.

On 24th October, 2019, its NAV was RM 3.21 and its share price on 25th October, 2019 was 2.42 per share.

Over the last 14 years, it gave 1 dividend of 9 sen per share.

Over the course of the last 14 years your investment in icapital.biz grew from $1.00 to $3.30, its compound annual growth rate, or its overall return, is 8.90%.


Share price fluctuations of iCapital.biz over the last 14 years

iCapital.biz traded at a premium to its NAV in its early years of listing. It was trading at high price of RM 2.48 in the early days of January 2008.

Its price crashed with the Global Financial Crisis. The premium to its NAV disappeared and it was trading at a huge discount to its NAV when its share price crashed to 1.06 in October 2009.

Since then, its share price has climbed upwards steadily over the years and always trading at a discount to its NAV.

On 25.10.2019, icapital.biz is priced at RM 2.42 per share.


So, who are the winners or losers in this stock?

The initial shareholders who hold onto to their shares until today from listing are obvious winners.

The buyers of this stock in and around January 2008 were obvious losers. They would have bought at very high prices and at huge premium to its NAV too.

However, for those who held onto this stock even when bought in January 2008 for the long term and who continued with a dollar cost averaging strategy over the years, they might still be winners overall.  This requires discipline and a firm investing philosophy.

Those who bought into icapital.biz from October 2008 when its price was the lowest and at any time subsequently and held till today are also winners, provided they bought below 2.42 per share.

Yes, there are obvious winners in this stock but they have to be in this stock long term and have done continuous buying of the stock over time (dollar cost averaging) when the price was obviously not too high.


Are there more winners or losers in this stock?

I believe the majority of players in the stock market are short-term traders. As traders, they are in at the time when the stock enjoys some popularity and they are out when the stock appears disfavoured. 

Thus, they are likely to be in the stock at the time when the prices were high and out when the prices dropped; they bought high and sold low.

I think icapital.biz is no different from other stocks in the Bursa. Though over the long term, icapital.biz has delivered positive returns, for those who have bought and sold icapital.biz stocks over the years, on an aggregate, there were more losers than winners.


The risk in investing is not the stock.  It is the person staring back at you in the mirror:  YOURSELF.


Suggested further reading:
https://myinvestingnotes.blogspot.com/2019/04/the-party-effect-or-recency-bias.html
No One is Immune from The Party Effect or Recency Bias


Saturday, 19 August 2017

The Investment Portfolio of iCapital.biz Berhad

INVESTMENT PORTFOLIO of iCAP

As of 31 May 2017, your Fund has not invested in unlisted investments and all other investments apart from securities listed on Bursa Malaysia Securities Berhad. The investment objectives and policies of your Fund have been consistently applied to its investment portfolio. Details of the investment portfolio of your Fund are as follows :-

Companies .... Shares .... Cost (RM) ....Value (RM) 
....Impairment Loss (RM) .... Unrealised Profit/ (Loss) (RM) 

1 APM Automotive Holdings Berhad.... 1,420,500.... 5,306,991.... 5,838,255
.... -  .... 531,264

2 Boustead Holdings Berhad ....12,147,786.... 27,444,475 ....32,191,633
.... - .....4,747,158

3 Fraser & Neave Holdings Berhad ....517,600 ....3,923,846 ....12,588,032
.... - ....8,664,186

4 Malaysia Smelting Corp Berhad ....2,902,000 ....10,082,424 ....11,753,100
.... (2,392,124) ....4,062,800

5 MKH Bhd ....1,356,830.... 3,436,689 ....3,378,507
.... - .... (58,182) 

6 Oceancash Pacific Bhd.... 2,230,000 ....1,249,861.... 1,627,900
.... - .... 378,039

7 Padini Holdings Berhad.... 19,000,000 .... 5,490,389....  66,690,000
....  -  .... 61,199,611

8 Parkson Holdings Berhad ....10,742,298 .... 21,202,731 .... 6,176,821
.... (14,327,660) .... *(698,249) 

9 Selangor Properties Berhad ....1,666,400 .... 7,743,009 .... 8,282,008
.... - .... 538,999

10 Suria Capital Holdings Berhad ....9,244,400 .... 15,400,153 .... 19,690,572
....  - .... 4,290,419

11 Tong Herr Resources Berhad.... 2,579,300.... 6,045,732.... 9,388,652
.... (513,988) .... 3,856,908


Total 
Cost (RM)                                   107,326,299
Value (RM)                                 177,605,480
Impairment Loss (RM)               (17,233,772)
Unrealised Profit/ (Loss) (RM)    87,512,953


IMPAIRMENT LOSS

Parkson      RM  (14,327,660)
Tong Herr  RM       (513,988)
MSC           RM    (2,392,124)
Total            RM (17,233,772)

As at 31 May 2017, impairment loss on investment in Parkson Holdings Berhad was RM14,327,660 due to decline in market value of Parkson Holdings. The market value as at 31 May 2017 was RM6,176,821 and the cost was RM21,202,731. This is considered significant under FRSIC issued Consensus 14 – Impairment of Investment in Equity Instrument categorised as Available-for-Sale Financial Asset. A decline in fair value below the original cost of the equity instrument that had persisted for more than 9 to 12 months would generally be considered as “Prolonged” and hence, be impaired. *As at 31 May 2017, the net unrealised loss for Parkson Holdings Berhad was RM698,249 together with the impairment loss of RM14,327,660 recognised as at 31 May 2017, giving the total unrealised loss of RM15,025,909.

For Tong Herr Resources Berhad and Malaysia Smelting Corporation Berhad, the impairment loss of RM513,988 and RM2,392,124 were made in the financial year 2014 and financial year 2015 respectively


DISPOSAL

This share was disposed during the financial year ended 31 May 2017

Tong Herr Resources Berhad

Shares  900,000
Cost (RM) 1,809,579
Disposal Value (RM)  1,744,242
Realised Loss (RM)   65,337


Description of the Companies Businesses 

APM Automotive Holdings Berhad APM 

Automotive is a Malaysian automotive parts manufacturer that has expanded rapidly to become a major regional supplier and is expanding globally.

Boustead Holdings Berhad 

Boustead Holdings is one of the largest conglomerates in Malaysia, with business spanning 6 sectors; namely, plantation, heavy industries, property, finance and investment, pharmaceutical, and trading and industrial.

Fraser & Neave Holdings Berhad 

Fraser & Neave Holdings (F&N) is a leading manufacturer and distributor of soft drinks and dairy products under various brands. F&N’s property division was formed to unlock the value of its freehold properties in Klang Valley.

Malaysia Smelting Corporation Berhad 

The MSC Group is currently one of the world’s leading integrated producers of tin metal and tin based products and a global leader in tin smelting.

MKH Berhad 

MKH is a well-known property developer. Apart from property development, MKH has ventured into other businesses such as oil palm cultivation, furniture manufacturing and trading.

Oceancash Pacific Berhad 

Oceancash Pacific is a manufacturer of resonated and thermoplastic felts. The group has expanded its range of product and services.

Padini Holdings Berhad 

Padini is a leading retailer of its own fashion labels through freestanding stores, franchised outlets and consignment counters in Malaysia and abroad.

Parkson Holdings Berhad 

Parkson is a leading operator of department stores in Malaysia, China, Vietnam, Indonesia, etc.

Selangor Properties Berhad 

Selangor Properties is involved in property investment and development, and investment holding.

Suria Capital Holdings Berhad 

Suria Capital is the leading port operator in Sabah. Apart from the port operations, the group has ventured into other businesses, including property development.

Tong Herr Resources Berhad 

Tong Herr Resources is a leading manufacturer of stainless steel fasteners and has expanded into manufacture of aluminum extrusion products in Malaysia.


Ref:  2017 Annual Report of iCAP
http://disclosure.bursamalaysia.com/FileAccess/apbursaweb/download?id=182076&name=EA_DS_ATTACHMENTS

iCAP 2017 Annual Report

The portfolio of your Fund, as at 31 May 2017, ranked in terms of the market value of each stock and the quantity held, is shown in Charts 1 and 2 below.


Chart 1: Market Value of Holdings
as at 31 May 2017 (RM ‘000)
Padini 66,690
Boustead 32,192
Suria 19,691
F&N 12,588
MSC 11,753
Tongher 9,389
Selprop 8,282
Parkson 6,177
APM 5,838
MKH 3,379
Oceancash 1,628


Chart 2: Size of Holdings
as at 31 May 2017 (‘000 shares)
Padini 19,000
Boustead 12,148
Parkson 10,742
Suria 9,244
MSc 2,902
Tongher 2,579
Oceancash 2,230
Selprop 1,666
APM 1,421
MKH 1,357
F&N 518


ii. INVESTMENTS SOLD

For the financial year ended 31 May 2017, your Fund sold 900,000 shares of Tong Herr Resources Berhad, generating a loss of RM65,336.95 with a cost of RM1.810 million.

As at 31 May 2017, your Fund invested RM107.326 million with a market value of RM177.605 million, giving unrealised gains of RM87.513 million.

Of your Fund’s investments as at 31 May 2017, Boustead Holdings Berhad, Fraser & Neave Holdings Bhd, Malaysia Smelting Corporation Berhad, Padini Holdings Berhad, Suria Capital Holdings Berhad and Tong Herr Resources Berhad have substantial unrealised gains out of which Padini Holdings Berhad has the highest substantial unrealised gain of RM61.2 million.


iii. INVESTMENTS MADE

For the financial year ended 31 May 2017, your Fund made 4 new investments shown in Chart 3. These were

  • APM Automotive Holdings Berhad, 
  • MKH Berhad, 
  • Oceancash Pacific Berhad, and 
  • Selangor Properties Berhad. 
APM Automotive Holdings Berhad is an established manufacturer of auto components. MKH Berhad and Selangor Properties Berhad are essentially property development and investment companies. Oceancash Pacific Berhad manufactures felt and non-woven fabric.

Chart 3: Purchases made after 31 May 2016 (‘000 shares)
Oceancash 2,230
Selprop 1,666
APM 1,421
MKH 1,251


Your Fund received 511,538 shares as share dividends from Parkson Holdings Berhad and 3,470,796 shares as share dividends from Boustead Holdings Berhad.

Your Fund also subscribed to 53,010 rights shares and received 106,020 bonus shares from the rights subscription of MKH Berhad.


v. PERFORMANCE: NAV & MARKET PRICE

From 1 June 2016 to 31 May 2017, the NAV per share of your Fund increased from RM3.01 to RM3.31 (a gain of 10%) and the market price increased from RM2.31 to RM2.64 (a gain of 14%). In the same period, FBMKLCI gained 9%.


The performance of icapital.biz Berhad since its listing is shown in Tables 1 and 2.

Table 1 : Cumulative Return From 19 Oct 2005 To
Ending Date... Fund's NAV (%)... Fund's Market Price (%)... FBMKLCI (%)... Fund’s Cash Level (%)
31-May-17............ 242.53........................ 172.11........................... 93.17..................... 61.29

Table 2 : Annualised Return From 19 Oct 2005 To
Ending Date ... Fund's NAV (%) ... Fund's Market Price (%) ... FBMKLCI (%)... Fund’s Cash Level (%) 
31-May-17 ..................11.18........................ 9.00 ...............................5.83 ...................... 61.29


Chart 6 : Performance as at 31 May 2017 (from the peak in 8 Jul 2014)

FBMKLCI  -6.70%
ICAP NAV  +7.82%
ICAP Price +6.02%


Chart 6 shows the performance of the FBMKLCI from its peak on 8 July 2014 until 31 May 2017, and the NAV and share price of icapital.biz Berhad during the same period.

The FBMKLCI lost 6.70%, your Fund’s NAV appreciated 7.82%, and its price increased 6.02%.


LONG TERM CAPITAL APPRECIATION

icapital.biz Berhad is a long-term capital appreciation fund, managed based on an eclectic value investing philosophy.

For those who are familiar with long-term value investing, there will be times when this time-proven investing style will yield superior returns, and there will be times when it will yield lower returns.

Even Buffett’s Berkshire Hathaway experiences such phases. We often read about Warren Buffett’s impressive longterm performance but one needs to bear in mind the times when Berkshire Hathaway was not performing.

In June 1998, Berkshire Hathaway traded at a high of US$84,000 per ‘A’ share. More than seven years later, it traded at a high of US$84,600 or a measly gain of less than 1% in total.

In that same period, the S&P 500 gained 8.6%, measured from a high of 1,145 points in  June 1998 and a high of 1,243 points in September 2005.

Investors who are not long-term focused or not genuine value investors would have been disappointed with Buffett’s performance (Berkshire Hathaway was having US$35.96 billion cash in 2003) and could have called for his retirement.

Fortunately for Berkshire Hathaway, it has plenty of like-minded investors who have stayed with Warren Buffett (in March 2009, Berkshire Hathaway fell to a low of US$70,050).

A good fund manager should not get distracted by shorter-term noises; similarly, share owners who believe in long-term value investing should not get distracted by shorter-term investors.

For your Fund to succeed year in, year out, attracting the right share owners is very crucial.


DIRECTORS

The name of the directors of your Fund who served during the financial year until the date of this report are as follows:-
1. Datuk Ng Peng Hong @ Ng Peng Hay
2. Dato’ Seri Md Ajib Bin Anuar
3. Dato’ Tan Ang Meng
4. Dato’ Sri Syed Ismail Bin Dato’ Haji Syed Azizan
5. Leong So Seh
6. David Loo Kean Beng (Retired on 24.9.2016)
7. Harun Bin Halim Rasip (Retired on 24.9.2016)


Directors Fees 
Total (RM)  315,437


STATEMENT OF PROFIT OR LOSS AND OTHER COMPREHENSIVE INCOME
FOR THE FINANCIAL YEAR ENDED 31 MAY 2017


2017 (RM) ….  2016 (RM) …. % Change
REVENUE
Interest income  7,941,121 …. 8,778,199 …. -9.5%
Dividend income  5,563,953 …. 4,399,147 …. 26.5%
Net (loss)/gain on disposal of quoted investments  -65,337 …. 30,857,557 …. -100.2%
13,439,737 …. 44,034,903 …. -69.5%
LESS: OPERATING EXPENSES
Accounting and administrative fees  108,855 …. 91,000 …. 19.6%
Advertisements  189,942 …. 185,956 …. 2.1%
Annual general meeting expenses 289,083 …. 329,206 …. -12.2%
Auditors’ remuneration  38,000 …. 38,000 …. 0.0%
Custodian expenses 147,151 …. 55,209 …. 166.5%
Directors’ fees 315,437 …. 309,493 …. 1.9%
Fund management fee 3,263,523 …. 3,075,342 …. 6.1%
Impairment loss on quoted investments  1,821,075 …. 12,506,585 …. -85.4%
Investment advisory fee 3,263,523 …. 3,075,342 …. 6.1%
Professional fee  203,364 …. 139,097 …. 46.2%
GST expenses  449,542 …. 420,066 …. 7.0%
Others 246,022 …. 92,028 …. 167.3%
10,335,517 …. 20,317,324 …. -49.1%
PROFIT BEFORE TAXATION  3,104,220 …. 23,717,579 …. -86.9%
INCOME TAX EXPENSE 12 -1,492,912 …. -2,357,991 …. -36.7%
PROFIT AFTER TAXATION 1,611,308 …. 21,359,588 …. -92.5%
OTHER COMPREHENSIVE INCOME/(EXPENSE) 13  37,477,213 …. -2,779,855 …. -1448.2%
TOTAL COMPREHENSIVE INCOME
FOR THE FINANCIAL YEAR  39,088,521 …. 18,579,733 …. 110.4%
PROFIT AFTER TAXATION ATTRIBUTABLE TO:-
Owners of the Company 1,611,308 …. 21,359,588 …. -92.5%
TOTAL COMPREHENSIVE INCOME
 ATTRIBUTABLE TO:-
Owners of the Company 39,088,521 …. 18,579,733 …. 110.4%
Basic earnings per ordinary share 14  0.01 …. 0.15 …. -93.3%


4.4 IMPAIRMENT

(a) Impairment of Financial Assets All financial assets (other than those categorised at fair value through profit or loss), are assessed at the end of each reporting period whether there is any objective evidence of impairment as a result of one or more events having an impact on the estimated future cash flows of the asset.

For an equity instrument, a significant or prolonged decline in the fair value below its cost is considered to be objective evidence of impairment. 

An impairment loss in respect of held-to-maturity investments and loans and receivables financial assets is recognised in profit or loss and is measured as the difference between the asset’s carrying amount and the present value of estimated future cash flows, discounted at the financial asset’s original effective interest rate.

An impairment loss in respect of available-for-sale financial assets is recognised in profit or loss and is measured as the difference between its cost (net of any principal payment and amortisation) and its current fair value, less any impairment loss previously recognised in the fair value reserve.

In addition, the cumulative loss recognised in other comprehensive income and accumulated in equity under fair value reserve, is reclassified from equity to profit or loss.

With the exception of available-for-sale equity instruments, if, in a subsequent period, the amount of the impairment loss decreases and the decrease can be related objectively to an event occurring after the impairment was recognised, the previously recognised impairment loss is reversed through profit or loss to the extent that the carrying amount of the investment at the date the impairment is reversed does not exceed what the amortised cost would have been had the impairment not been recognised.

In respect of available-for-sale equity instruments, impairment losses previously recognised in profit or loss are not reversed through profit or loss. Any increase in fair value subsequent to an impairment loss made is recognised in other comprehensive income.


5. INVESTMENTS 

                                                                       2017 (RM)                    2016 (RM)

At market value:-
Quoted securities in Malaysia, at 1.6.2016/2015           126,022,371                 145,596,798
Additions during the financial year                              17,736,550                      6,321,817
Disposals during the financial year                                 (1,809,579)                 (10,609,805)
Changes in fair value adjustments                                   35,656,138                  (15,286,439)
Quoted securities in Malaysia, at 31.5.2017/2016         177,605,480                  126,022,371
Impairment loss recognised due to fair value changes      1,821,075                    12,506,585


7. SHORT-TERM DEPOSITS

                                                                           2017 (RM)                   2016 (RM)

Deposits with licensed financial institutions                   282,769,489                  302,759,351

The deposits with licensed financial institutions of your Fund at the end of the reporting period bore effective interest rates ranging from 3.35% to 3.60% (2016 - 2.90% to 3.65%) per annum.

The deposits with licensed financial institutions have maturity periods ranging from 1 to 3 months (2016 - 1 to 3 months).


Significant Related Party Transactions and Balances 

Other than those disclosed elsewhere in the financial statements, your Fund also carried out the following significant transactions with the related parties during the financial year:-

                                                                                          2017 (RM)                2016 (RM)

Fund management fees paid to CDAM                             3,263,523                  3,075,342
Investment advisory fees paid to CDSB                            3,263,523                  3,075,342
Prepayment to CDAM and CDSB Note: 6                        1,207,808                  1,131,427


Thirty Largest Shareholders 

No.     Name      No. of shares    Percentage holding (%)

1. DB (MALAYSIA) NOMINEE (ASING) SDN BHD THE BANK OF NEW YORK MELLON FOR EMERGING MARKETS COUNTRY FUND 4,891,200   3.4937 
2. CHONG AH HIM @ CHONG KUM KWAN 4,711,500   3.3654 
3. TUNKU SARA BINTI TUNKU AHMAD YAHAYA 2,800,000   2.0000 
4. DB (MALAYSIA) NOMINEE (ASING) SDN BHD THE BANK OF NEW YORK MELLON FOR THE WORLD MARKETS UMBRELLA FUND PLC 2,670,500   1.9075 
5. DB (MALAYSIA) NOMINEE (ASING) SDN BHD THE BANK OF NEW YORK MELLON FOR GLOBAL EMERGING MARKETS FUND 2,273,200   1.6237 
6. HSBC NOMINEES (ASING) SDN BHD TNTC FOR UNITED MINE WORKERS OF AMERICA 1974 PENSION TRUST 2,101,300   1.5009 
7. ANNHOW HOLDINGS SDN BHD 2,000,000   1.4286 
8. MAYBANK NOMINEES (TEMPATAN) SDN BHD YEOH AH TU 1,910,200   1.3644
9. LAM FOOK SHIN 1,832,200   1.3087 
10. DB (MALAYSIA) NOMINEE (ASING) SDN BHD THE BANK OF NEW YORK MELLON FOR EMERGING MARKETS GLOBAL FUND 1,661,300   1.1866 
11. DB (MALAYSIA) NOMINEE (ASING) SDN BHD THE BANK OF NEW YORK MELLON FOR SCHOOL EMPLOYEES RETIREMENT SYSTEM OF OHIO 1,574,100   1.1244 
12. OCUVAS SDN.BHD. 1,370,000   0.9786 
13. DB (MALAYSIA) NOMINEE (ASING) SDN BHD THE BANK OF NEW YORK MELLON FOR CORNELL UNIVERSITY 1,357,400   0.9696 
14. DB (MALAYSIA) NOMINEE (ASING) SDN BHD THE BANK OF NEW YORK MELLON FOR EMERGING MARKETS INVESTABLE FUND 1,284,300   0.9174 
15. LEOW KOK MEOW & SONS SENDIRIAN BERHAD 1,250,000   0.8929 
16. HENG KIM SIANG 1,238,100   0.8844 
17. WONG YOON TET 1,080,000   0.7714 
18. VOHRAH - MERICAN SDN BHD 1,078,200   0.7701 
19. LAI HUI ENG 1,058,400   0.7560 
20. TONG CHONG KONG 1,041,000   0.7436 
21. LEE SIEW LIN 1,038,000   0.7414 
22. SOON KHIAT VOON 1,002,000   0.7157 
23. LOH KIAN CHONG 1,000,000   0.7143 
24. DB (MALAYSIA) NOMINEE (ASING) SDN BHD THE BANK OF NEW YORK MELLON FOR UNIVERSITY OF PITTSBURGH 961,000   0.6864 
25. CARTABAN NOMINEES (ASING) SDN BHD EXEMPT AN FOR RBC INVESTOR SERVICES TRUST (CLIENTS ACCOUNT) 895,900   0.6399 
26. YEOH AH TU 832,200   0.5944 
27. DB (MALAYSIA) NOMINEE (ASING) SDN BHD BNYM SA/NV FOR DESERET MUTUAL MASTER RETIREMENT PLAN 828,700   0.5919 
28. DB (MALAYSIA) NOMINEE (ASING) SDN BHD THE BANK OF NEW YORK MELLON FOR CITIGROUP PENSION PLAN 824,500  0.5889 
29. HSBC NOMINEES (ASING) SDN BHD TNTC FOR THE TRUSTEES OF THE HENRY SMITH CHARITY 791,500   0.5654 
30. CAPITAL DYNAMICS ASSET MANAGEMENT SDN BHD 739,000   0.5279 

Total 48,095,700   34.35


Thursday, 17 September 2015

iCapital Close End Fund: The Winners and the Losers over the last 10 years

This fund has done reasonably well since inception.  Its NAV has grown from RM1.00 in 2005 to the present NAV of RM 2.80 on 17.9.2015 (CAGR of 10.8%).

Its market price is RM 2.24 on 17.9.2015, giving a CAGR of 8.4% over the last 10 years.


Who are the winners?

1.  Those who have been holding the funds since inception.  They are the winners.
2.  Those who bought in 2008 and 2009, they are winners.  They would have bought icap close end fund at a low price.
3.  Yes, the fund manager has been a big winner in this fund.  This is to be expected as managing fund is a highly lucrative business indeed.


Who are the losers?

1.  Those who bought into icap at the time of over-enthusiasm, when icap was trading at a huge premium.  Those who bought into icap in 2007 and who did not hold the stocks till today were more likely to be losers.
2.  Those who bought the stock in the last 3 years.  They would have lost due to non-performance or poor performance of the fund over this period.   They would have enjoyed a better return from investing into their risk free FDs.
.


As for foreign investors who bought into the fund over the last few years, are they winners or losers?

Taking into consideration, the loss of value of the ringgit in relation to the US and the UK currency,  they may not be winners either.


Probably more shareholders burnt than benefited.

Peter Lynch delivered great returns while managing the Magellan fund for 13 years.  Yet, when he analysed the returns to the shareholders, the majority lost money!  Similarly, I am of the opinion, even today, the majority of shareholders who had bought and sold icapital close end fund were losers.   The winners are probably a minority who bought in the early years especially the initial investors into the fund at the time of launch, and who have hold onto the stocks till today.


The Fund Manager should stay focus.

Over the recent years, the fund manager of icap close end fund has been extensively involved in expansion into new funds and new geographical territory.   His activities appear to target growing his assets under management by his company.   His involvement in Investors Days, though commendable, is of doubtful benefit to the core shareholders of icap closed end fund.

As for hard core shareholders of icap closed end fund, their single focus is on the performance of the fund.  In particular, can the fund deliver >15% compound annual return over the long term.  Hopefully, by the year 2020, the year of reckoning, when the fund would have existed for a long period of 15 years and have been through a few up and down cycles, we can make a more objective assessment of the ability of the fund manager.

It is expected that most funds would just perform about the market return or slightly lower than the market return.  Will icap close end fund be able to deliver returns much higher than this?  Will icap close end fund be able to beat the returns of Buffett's during his earlier years of his involvement in stocks?


*Special Dividend of 9.5 sen per share less Income Tax of 25% for the financial year ended 31 May 2013 is deducted from NAV.


Sunday, 4 January 2015

Either you ignore market fluctuations or you buy and sell based on value.

It is people generally who make high and low markets, because they are optimistic (and greedy) in high markets and pessimistic (and disgusted) in low markets.  

How can you - a member representing the public at large - be expected to act otherwise than the public acts?

Does not this mean that you are doomed, by some law of logic, to buy when you should be selling and to sell when you should be buying?


This point is vital.  The investor cannot enter the arena of the stock market with any real hope of success unless he is armed with mental weapons that distinguish him in kind - not in a fancied superior degree - from the trading public.  

(1)  One possible weapon is indifference to market fluctuations; such an investor buys carefully when he has money to place and then lets prices take care of themselves.  

(2)  But, if the investor intends to buy and sell recurrently, his weapons must be a frame of mind and a principle of action which are basically different from those of the trader and speculator.  He must deal in values, not in price movements.  He must be relatively immune to optimism or pessimism and impervious to business or stock-market forecasts.  

In a word, he must be psychologically prepared to be a true investor and not a speculator masquerading as an investor.  If he can meet this test, he will be a member not of the public at large but of a specialized and self-disciplined group.

Returning to the matter of the market's cyclical swings,we must point out that the duration or frequency of these swings has changed considerably since 1921.  This is an added obstacle to the pleasing project of investing regularly in low markets and selling out in high ones.  Between 1899 and 1921 the industrial average made five well defined highs and five definite lows, an average cycle of about four years.  Since then there have been only two clean-cut swings and the intervals between low points have been eleven years and ten years, respectively.  

An investor nowadays is likely to grow uneasy and impatient while waiting for his cyclical buying opportunity to reappear.  In the meantime, also, his funds will bring him no interest in the bank and only a negligible rate if placed in short-term securities.  Thus he can lose more in dividends foregone than he can ever gain from buying at eventual low levels.  


Summary

Either buy carefully and then ignore the market fluctuations or if you intends to buy and sell recurrently, deal in values.  

Should you patiently wait for your cyclical buying opportunity to reappear?  The low-points of the market maybe 10 or 11 years apart.  While waiting for these hoping to buy at eventual low levels, you can lose more in dividends foregone; earning little income from your cash holdings.

Tuesday, 30 September 2014

Warren Buffett losing US$700 million in Tesco & iCapital International Value Fund

This fund started investing in July 2009. Its performance in AUD since then is shown below together with the benchmarks MSCI ACWI index and ASX200.
Table: 1 Jul 2009 to 31 Aug 2014
Total Return% Change
Currency01-Jul-200931-Aug-2014
ICIVFA$1.00001.463946.39
MSCI ACWIA$1204.2423461.398250.71
ASX200A$306.15375625.900045.22


Commentary


Mindful of the rich valuation many markets are trading at, Capital Dynamics (Australia) Ltd continues to maintain the high cash level of your fund. Is this right?

Patience is more than inactivity; it is working diligently without being anxious. Although constantly on the lookout for new opportunities, Capital Dynamics (Australia) Ltd needs to have the patience to wait for the right investment to fall into the right price range.

Unfortunately, many amateur and professional investors succumb to all sorts of pressure to avoid subpar quarterly performance or personal pressures to avoid the feeling of being left out as the market surges. They make the classic mistake of seeing investment opportunities because they want it to be there, not because they’re actually there.

An investor who has fallen into this trap, in other words, will start to gradually twist the facts, skew his own perception of the situation, and even erode his own standards for investment, just to make that investment opportunity available.

In this day and age, patience is in short supply now, which is precisely why it is a valuable core strategy. As we wait, it is interesting to note that the Oracle of Omaha, Warren Buffett, is getting hit in the Tesco debacle, having lost over US$700 million on his US1.7 billion investment, which was made in 2007. 

What is not known to many, however, is the fact that Capital Dynamics (Australia) Ltd sold all of your fund’s holdings in Tesco Plc way back in 2011. Less than a year later, Tesco dumbfounded investors by issuing a profit warning for the first time in 20 years, and reported a decline in annual profit last year. While not a massive $320 billion global conglomerate and lacking the resources and manpower Buffett has, Capital Dynamics (Australia) Ltd, a relatively small investment firm, is proudly rooted in Asia but with a global perspective and capabilities.


The NAV and distribution history of i Capital International Value Fund can be viewed at www.capitaldynamics.com.au or www.funds.icapital.biz.


Those who invested in this fund would have received this report.

Wednesday, 3 July 2013

iCAP is well invested in CASH as revealed in its latest quarterly report

Tuesday July 2, 2013 MYT 5:48:46 PM

iCapital.biz earnings jumps to RM47mil

iCapital.biz Bhd’s net profit for its fourth quarter jumped to RM47.12mil from RM1.7mil a year ago due to profit on disposal of securities and higher revenue.
Its revenue increased to RM49mil from RM4.5mil a year ago. Earnings per share were 33.66 sen compared to 1.22 sen a year ago.
For its full year, the group posted a net profit of RM56.8mil from RM15.7mil a year ago. Its full year’s revenue stood at RM65.9mil compared to RM24.8mil a year ago.
“As the company is a closed-end fund, a better indication of its performance would be the movement of its Net Assets Value (NAV). The NAV per share as at May 31, 2013 was RM2.99, compared with NAV per share of RM2.86 as at May 31, 2012,” it said.


31.5.2013

Fees
Fund management fees $3.090 million
(31.5.2012:  RM 2.895 million)

Revenue 
Interest  4.163 million
Dividend Income  12.665 million
Gains on Disposal of Securities 49.126 million
Total Revenue  65.954 million

Operating expenses 6.977 million
Profit from operations before tax 58.977 million
Taxation 2.163 million
Profit for the period 56.814 million

NAV
31.5.2013  RM 2.99
31.5.2012  RM 2.86
y-o-y change + 4.5%

Retained Profits
31.5.2013  178.848 million
31.5.2012  122.034 million
y-o-y change 56.814 million

Fair-value adjustment reserve
31.5.2013  100.071 million
31.5.2012  137.725 million
y-o-y change - 37.654 million

Total equity
31.5.2013  418.919 million
31.5.2012  399.759 million
y-o-y change 19.16 million (+ 4.79%)

Short term deposits 
31.5.2013  207.034 million
31.5.2012  133.571 million

Investments
31.5.2013  209.700 million
31.5.2012  262.658 million

Cash level
In the latest quarterly report, the cash level of iCap has risen above RM 200 million or about RM 1.43 per share.


From Annual Report of 2012
As of 12.9.2012, the stocks in its investment portfolio are (no. of shares):
1.   Boustead 7,197,850
2.   F& N 2,114,000
3.   Integrax 4,884,500
4.   MSC  2,902,000
5.   Padini  22,700,000
6.   Parkson  9,180,900
7.   Petdag  2,400,000
8.   PIE 3,407,200
9.   Suria Capital 9,344,400
10.  Tong Herr  3,479,300
11.  Pharmaniaga  125,180


Saturday, 10 November 2012

iCAP closed end fund: 87% of shareholders voted for the status quo


 Saturday November 10, 2012 MYT 5:22:15 PM

Trio fail to get elected to iCapital.biz

By John Loh


KUALA LUMPUR: Andrew Pegge, Low Nyap Heng and a shareholder Lo Kok Kee failed to get elected to the board of iCapital.biz Bhd at its packed AGM on Saturday.
At the six-hour meeting, which started at 9am, shareholders overwhelmingly threw their support behind its fund manager andfounder Tan Teng Boo.
Some 87% of shareholders voted against the resolutions seeking board representations for Pegge, Low and Lo on Malaysia's only listed closed-end fund.
Earlier, Kingsnorth told journalists outside the AGM at a hotel here that Laxey, which owns 6.9% of iCapital.biz, had accomplished what it set out to do.
"The debate (about the discount between iCapital.biz's share price and net asset value) is good. The company is better for this.
"We are still the largest shareholder and will continue to express our views," he said.

Tan Teng Boo's interview on bfm on the latest development in iCAP

http://www.bfm.my/assets/files/MarketWatch/2012_11_09_MW_TanTengBoo.mp3


To fellow Shareholders of iCAP
Let us keep to the initial objectives of this fund.
Please cast your votes to send a decisive message in this AGM.
HandshakeHandshake

I throw my support for Tan Teng Boo to maintain the status quo in iCAP.


Also read:


Thursday, 8 November 2012

iCAP closed end fund manager responds to Laxey Partners accusations

http://icapital.biz/agm/FORMAL_RESPONSE_TO_LAXEY_PARTNERS_LTD_ACCUSATIONS.pdf


My comments:

Actually, those who are disgusted with ttb or iCAP can choose to sell their shares.  I think this happened all the time.  Those who favoured ttb or iCAP may be the buyers of these shares.  I think this happened all the time.

The issue facing iCAP shareholders this Saturday is quite different.  Laxey Partner has amassed a sizeable stake in iCAP.  As a shareholder, they rightfully can request for changes.  However, their motives may not be fully aligned to many long term shareholders of iCAP.

They are invited to state their case.  How can they hope to reduce the market price - NAV gap?  I thought this was a stupid thing really.   This gap exists because of various factors.  They should propose how they hope to reduce this gap without liquidating this fund.  

Share buyback?  Will this work?  Doubtful ... 
Dividends?  Why?  I would rather have my funds retained in iCAP to compound at a high rate of return.

As I have written earlier, ttb and his board of directors (hopefully they will be retained at this AGM) should stay focus on the performance of the NAV of this fund rather than wasting any time worrying over the market price - NAV gap of iCAP which I feel they have little or no control over.

If Laxey Partner wishes to pay a price closer to the NAV price, this gap would have narrowed.  On the other hand, it was also this discount that allowed them to buy into this fund in the first place?  Now they are going for their exit strategy.  They are invited to be long term investors in this fund, just like the rest.  Hope this will be realised on Saturday.   Handshake Cash


Also read: 

Tan confident of support from iCapital.biz shareholders to against Laxey


How the Top 2 investors of iCAP closed-end fund might have acquired their 10.56% outstanding shares.

From the 1.1.2011 to 7.11.2012, there were 459 market transaction days.
The total number of outstanding iCAP shares is 140,000,000 shares.

The average number of shares traded per day for that period = 89,700 shares
The % of total outstanding shares transacted per day for that period = 0.064%.
The average RM value of shares traded per day for that period = RM 195,249.

The total number of shares traded for that period  = 41,277,700 shares
The % of total outstanding shares transacted for that whole period = 29.5%.
The total RM value of shares traded for that period = RM 89,814,731.


The Top 2 shareholders of iCAP as on 31.5.2012 own 9,028,491 and 5,748,600 shares respectively.
These Top 2 shareholders collectively own 14,777,091 shares or 10.56% of total outstanding shares of iCAP.

Assuming that these Top 2 shareholders started to accumulate their shares in iCAP from 1.1.2011 to 7.11.12, the followings can be inferred:

- they would have been responsible for 35.8% of the total transactions for this period.

- they would have invested a total RM 32,152,965 to acquire a combined total of 14,777,091 shares of iCAP.

- they would have invested an average of RM 70,050 per day to acquire their shares during this period.

- their average price per iCAP share they bought at was about RM 2.18 per share.


Excel worksheet:
https://docs.google.com/open?id=0B-RRzs61sKqRMG5WZU9mdXJld0E


Wednesday, 7 November 2012

I throw my support for Tan Teng Boo to maintain the status quo in iCAP.


I welcome shareholder activism in iCAP.  This can only be good for this fund.  However, given the short notice of this new development, it would be good to understand the issues deeper.

Questions I pose to myself:
  1. Has iCAP outlived its usefulness and its breakup or liquidation be beneficial to existing shareholders for the long-term??
  2. Has iCAP managers proven themselves incapable of making a decent return?
  3. Would iCAP having a dividend policy be beneficial to the long term investors of this fund?
  4. Would iCAP buying back its own stocks that are trading at a discount necessarily improve market price of its stock?

1.  Has iCAP outlived its usefulness and its breakup or liquidation be beneficial to existing shareholders for the long-term??
iCAP was started in 2005 with a set philosophy laid down by Tan Teng Boo.  The early investors of iCAP subscribe to his philosophy.  The fund was set up to enable small shareholders to invest in the stock market managed by a proven fund manager.  There is a need for such fund to exist.  Therefore, iCAP plays a useful role for those small or big investors whose investing philosophy are aligned with that of Tan Teng Boo, its fund manager.
Therefore, my answer to Question 1 is NO.

2.  Has iCAP managers proven themselves incapable of making a decent return?
We should be wary of short term performances of funds or any investing.  The market volatility can be such that the performances of the short term can fluctuate widely.  Nevertheless, it is the long term return one should be focus on.  On this point, iCAP has more than delivered on its promise at inception to those who are long term invested in this fund.  It has delivered 18% compound annual return in its NAV since 2005.
Therefore, my answer to Question 2 is NO.

3.  Would iCAP having a dividend policy be beneficial to the long term investors of this fund?
iCAP has delivered compound annual returns to its shareholders 18% since inception.  Given its excellent performance since inception, it is rational and logical to retain all earnings to compound at these high rates of returns to grow your networth.  In any case, this objective was stated clearly by Tan Teng Boo when he started this fund.  
Therefore, my answer to Question 3 is NO.

4.  Would iCAP buying back its own stocks that are trading at a discount necessarily improve market price of its stock?
Share buybacks offer advantages and disadvantages.  However, these too do not guarantee that the discount to NAV of the fund will narrow either.  It is not unknown that there are companies that bought back their own shares with little impact on their share price.  In fact, for many, the stock prices even continue with their relentless decline driven by fundamental reasons.  Share buybacks by companies of their own shares are not without their controversies and complicities.
Therefore, my answer to Question 4 is NO.

Tan Teng Boo should mobilise the investors who share his philosophy who are long term invested in his fund to defeat the challenge posed by Laxey Partner.
Hopefully, he will be successful.  After having survived this in the 8th AGM, he will have time to rethink and continue taking this fund to a higher level of performance.  It is far better for Tan Teng Boo and the Board of iCAP to concentrate on investment performance than to worry too much over how to shrink the discount to the NAV of the fund which they have some or little control over.