Showing posts with label Google. Show all posts

Thursday, 6 November 2025

Alphabet's Revenue and Net Earnings (2015 - 2025)

Here is a detailed breakdown of Alphabet Inc. (Google)'s revenues and net earnings for the calendar years 2015 to 2025, followed by a summary of the Compound Annual Growth Rate (CAGR).


**Important Note:** Alphabet's fiscal year aligns with the calendar year (ending December 31). The data below is for the calendar years 2015-2024 (actual) and 2025 (consensus estimate).


---


### **Alphabet's Revenue and Net Earnings (2015 - 2025)**


All figures are in USD millions. Data for 2015-2024 is sourced from Alphabet's official annual reports (10-K filings). **Data for 2025 is based on the current consensus analyst estimates** compiled by financial data providers.


| Calendar Year | Revenue ($ millions) | Net Earnings ($ millions) |

| :------------ | :------------------- | :------------------------- |

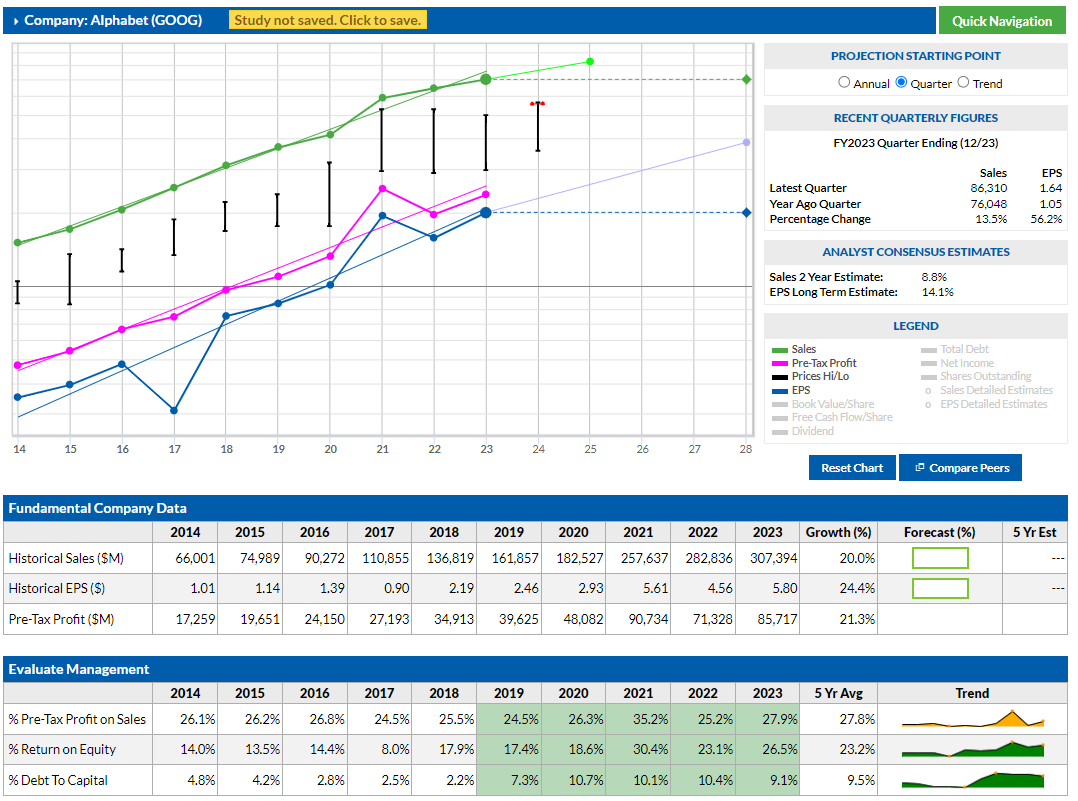
| **2015**      | $74,989              | $16,348                   |

| **2016**      | $90,272              | $19,478                   |

| **2017**      | $110,855             | $12,662                   |

| **2018**      | $136,819             | $30,736                   |

| **2019**      | $161,857             | $34,343                   |

| **2020**      | $182,527             | $40,269                   |

| **2021**      | $257,637             | $76,033                   |

| **2022**      | $283,576             | $59,972                   |

| **2023**      | $307,394             | $73,795                   |

| **2024**      | $319,616             | $84,093                   |

| **2025 (Est.)**| ~$355,500            | ~$98,200                  |


**Key Context for the Data:**

*   **2015-2017: Solid Growth & EU Fine Impact.** Steady growth in core advertising was the driver. The significant drop in 2017 net earnings was due to a **$2.7 billion antitrust fine** levied by the European Union, which is treated as an operating expense.

*   **2018-2020: Consistent Expansion.** This period saw strong, consistent growth in Google Search and the rapid scaling of YouTube as an advertising powerhouse. The cloud business also began to become a more meaningful contributor.

*   **2021: The Post-Pandemic Boom.** A massive surge in digital advertising spend as the economy reopened led to a record year for both revenue and profitability.

*   **2022: The Correction.** Growth slowed and earnings dipped due to macroeconomic headwinds, inflation, and reduced advertiser spending, highlighting the cyclical nature of the ad business.

*   **2023-2024: AI-Driven Re-acceleration.** Revenue growth stabilized and profitability rebounded strongly. The company focused on cost discipline (e.g., layoffs) and began integrating generative AI across its products (Search, YouTube, Cloud) to drive efficiency and new revenue streams.

*   **2025 (Est.): Sustained Momentum.** Analysts project a return to double-digit revenue growth, fueled by the broader adoption of AI-powered advertising products and continued strong performance in Google Cloud. Profit growth is expected to outpace revenue growth due to ongoing operational efficiency.


---


### **Summary of CAGR (2015 to 2025)**


The Compound Annual Growth Rate (CAGR) measures the mean annual growth rate over a specified period.


**Period:** From the end of **2015** to the end of **estimated 2025** (a 10-year period).


*   **Revenue CAGR (2015 to 2025 Est.):**

    *   Starting Value (2015): $74,989 million

    *   Ending Value (2025 Est.): ~$355,500 million

    *   Number of Years: 10

    *   **CAGR = ~16.9%**


*   **Net Earnings CAGR (2015 to 2025 Est.):**

    *   Starting Value (2015): $16,348 million

    *   Ending Value (2025 Est.): ~$98,200 million

    *   Number of Years: 10

    *   **CAGR = ~19.6%**


### **Conclusion**


Over the ten-year period from 2015 to the projected 2025, Alphabet has demonstrated an exceptional ability to scale its core advertising business while successfully building other massive ventures.


*   The **Revenue CAGR of approximately 16.9%** is remarkable for a company that was already a giant in 2015, showing its enduring dominance in the digital ecosystem and its ability to continuously capture a large share of global ad spend.

*   The **Net Earnings CAGR of ~19.6%** is even more impressive. It shows that the company has not only grown its top line but has also improved its profitability over the decade. This is a testament to the high-margin nature of its primary businesses and, more recently, a disciplined approach to cost management. The journey includes absorbing multi-billion dollar regulatory fines and navigating economic cycles, yet still achieving nearly 20% annualized profit growth.


This performance underscores Alphabet's resilience and its successful navigation of the transition from a desktop-search company to a diversified tech leader in advertising, cloud computing, and artificial intelligence.


***Disclaimer:*** *This information is for illustrative purposes only. Data for 2015-2024 is historical. Data for 2025 are analyst estimates and are not guaranteed. This is not financial advice. Investing in the stock market involves risk, including the possible loss of principal.*

Friday, 26 April 2024

The Magnificent Seven stocks: Apple, Microsoft, Google parent Alphabet, Amazon, Nvidia, Meta Platforms and Tesla

 Dubbed the Magnificent Seven stocks, Apple, Microsoft, Google parent Alphabet, Amazon, Nvidia, Meta Platforms and Tesla lived up to their name in 2023 with big gains. But the early part of the second quarter of 2024 showed a big divergence of returns.


Tuesday, 14 June 2022

Fundamentals of Alphabet Inc. Cl C GOOG (U.S.: Nasdaq)

INCOME STATEMENT ANNUAL 

Fiscal year is January-December. All values USD Millions.
 2021
 2020
 2019
 2018
 2017 5-year trend 

 Sales/Revenue
 257,488
 182,350
 161,402 
136,958
 111,024 

 Gross Income
 146,549
 97,618
 89,506
 77,409
 65,441 

 Gross Profit Margin 56.91 

 Non-Operating Interest Income
 1,499
 1,865
 2,427
 1,878
 1,312 

 Pretax Income
 90,734
 48,082
 39,625
 34,913
 27,193 

 Pretax Margin 35.24% 

 Net Income
 76,033
 40,269
 34,343
 30,736
 12,662 

 Net Margin 29.53% 

 EPS (Basic)
 112.20
 58.61
 49.16
 43.70
 18.00 

 EBITDA
 91,006
 54,744
 47,254
 40,566
 35,966 


 CASH FLOW STATEMENT 

 Operating Activities 
 Fiscal year is January-December. All values USD Millions.
 2021
 2020
 2019
 2018
 2017 5-year trend 

 Net Income before Extraordinaries
 76,033
 40,269
 34,343
 30,736
 12,662

 Depreciation, Depletion & Amortization
 12,441
 13,697
 11,781
 9,035
 6,915 

 Funds from Operations
 93,175
 63,297
 53,701
 43,063
 27,845 

 Net Operating Cash Flow
 91,652
 65,124
 54,520
 47,971
 37,091 

 Capital Expenditures
 (24,640)
 (22,281)
 (23,548)
 (25,139)
 (13,184)

 Repurchase of Common & Preferred Stk.
 (50,274)
 (31,149)
 (18,396)
 (9,075)
 (4,846) 

 Free Cash Flow
 67,012
 42,843
 30,972
 22,832
 23,907 

 Free Cash Flow Yield 3.41% 


 BALANCE SHEET 

 ANNUAL 
Assets Fiscal year is January-December. All values USD Millions.
 2021
 2020
 2019
 2018
 2017 5-year trend 

 Cash & Short Term Investments
 139,649
 136,694
 119,675
 109,140
 101,871 

 ST Debt & Current Portion LT Debt
 2,302
 2,794
 1,199
 -
 - 

 Long-Term Debt
 26,206
 25,078
 14,768
 4,012
 3,969 


 Total Current Assets
 188,143
 174,296
 152,578
 135,676
 124,308 

 Total Current Liabilities 
64,254
 56,834
 45,221
 34,620
 24,183 

 Current Ratio 2.93
 Quick Ratio 2.91
 Cash Ratio 2.17

 Total Assets
 359,268
 319,616
 275,909
 232,792
 197,295 

 Asset Turnover 0.76
 Return On Average Assets 22.40% 

 Total Liabilities
 107,633
 97,072
 74,467
 55,164
 44,793 

 Total Shareholders' Equity
 251,635
 222,544
 201,442
 177,628
 152,502

 Total Shareholders' Equity / Total Assets
 70.04%
 69.63%
 73.01%
 76.30%
 77.30% 


 KEY STOCK DATA 
P/E Ratio (TTM) 19.33(06/13/22) 
EPS (TTM) $110.56 
Market Cap $1.40 T (@ 06/13/22 $2,137.53USD / share) 
Shares Outstanding 313.38 M 
Public Float 273.83 M 
Yield GOOG is not currently paying a regular dividend. 
Latest Dividend N/A 
Ex-Dividend Date N/A 


 Average Growth Rates 
Alphabet Inc. Cl C Past Five Years Ending 12/31/2021 (Fiscal Year) 
Revenue +26.38%
 Income +100.10%
 Earnings Per Share - 
Capital Spending +17.38%
 Gross Margin +62.77%
 Cash Flow +36.06%


Share price

Alphabet Inc Class A
2,130.43 USD-769.63 year to date
14 Jun, 9:41 am GMT-4 


Alphabet Inc Class A
2,131.91 USD-318.71 past year
14 Jun, 9:41 am GMT-4 


Alphabet Inc Class A
2,131.91 USD+1,171.58 past 5 years
14 Jun, 9:41 am GMT-4 


Alphabet Inc Class A
2,131.91 USD+2,076.04 all time
14 Jun, 9:41 am GMT-4 

Peak price  US $2,997 (18.11.20210


Stock Price Target GOOG

High$4,533.34
Median$3,200.00
Low$2,650.00
Average$3,247.34
Current Price$2,137.53


Ratios & Margins Alphabet Inc. Cl C

All values updated annually at fiscal year end

Valuation

P/E Ratio (TTM) 19.44
P/E Ratio (including extraordinary items) 20.99
Price to Sales Ratio 7.62
Price to Book Ratio 7.62
Price to Cash Flow Ratio 21.42
Enterprise Value to EBITDA 15.74
Enterprise Value to Sales 5.31
Total Debt to Enterprise Value -
Total Debt to EBITDA 0.16
EPS (recurring) 101.46
EPS (basic) 113.88
EPS (diluted) 112.20

Efficiency

Revenue/Employee -
Income Per Employee -
Receivables Turnover -
Total Asset Turnover 0.76

Liquidity

Current Ratio 2.93
Quick Ratio 2.91
Cash Ratio 2.17

Profitability

Gross Margin +56.91
Operating Margin +30.51
Pretax Margin +35.24
Net Margin +29.53
Return on Assets 22.40
Return on Equity 32.07
Return on Total Capital 29.62
Return on Invested Capital -

Capital Structure

Total Debt to Total Equity -
Total Debt to Total Capital -
Total Debt to Total Assets 7.94
Interest Coverage -
Long-Term Debt to Equity -
Long-Term Debt to Total Capital -
Long-Term Debt to Assets 0.07

Saturday, 7 July 2012

5 Companies You Can Buy Today

By Morgan Housel
July 6, 2012

There are many ways to value a company. Price to earnings. Price to cash flow. Liquidation value. Price per eyeballs on website. Price to a number I made up (this one never gets old). Price to CEO's ego divided by lobbying activity as a percentage of revenue (this one doesn't get used enough).
Which one is best? They're all limited and reliant on assumptions. No single metric holds everything you need to know.
The metric I'm using today is no different. But it's perhaps the most encompassing, and least susceptible to hidden complexities of a company's financial statements. The more I think about it, the more I feel it's one of the most useful metrics out there.
What is it? Enterprise value over unlevered free cash flow.                                                       
  • Enterprise value is market capitalization (share price times shares outstanding) plus total debt and minority interests, minus cash.
  • Unlevered cash flow is free cash flow with interest paid on outstanding debt added back in.
The ratio of these two statistics provides a valuation metric that takes into consideration allproviders of capital -- both stockholders and bondholders.
But you invest in common stock, so why should you care about bondholders? Ask Lehman Brothers investors why. When a company earns money, it has to take care of bondholders before you, the common shareholder, get a dime. Focusing solely on profits and equity can be misleading.
Enterprise value provides a more encompassing view. By bringing debt capital into the situation, we see real earnings in relation to the company's entire capital structure. If you owned the entire business, this is the metric you'd naturally gravitate toward.
Using this metric, here are five companies I found that look attractive.
Company
Enterprise Value/Unlevered FCF
5-Year Average

CAPS Rating (out of 5)
Google (Nasdaq: GOOG  )18.135.2****
Johnson & Johnson(NYSE: JNJ  )19.821.9*****
Procter & Gamble (NYSE:PG  )24.628.4*****
UnitedHealth Group(NYSE: UNH  )6.910.2*****
Colgate-Palmolive (NYSE:CL  )22.824.4*****
Source: S&P Capital IQ.
Let's say a few words about these companies.
Three years ago, Warren Buffett and Charlie Munger had some flattering words for Google. "Google has a huge new moat. In fact I've probably never seen such a wide moat." Munger said. "I don't know how to take it away from them," Buffett said. "Their moat is filled with sharks!" Munger added.
Here's a good example: After trying to make inroads in the online ad business, Microsoft just wrote down almost the entire value of its 2007 purchase of aQuantive. The Daily Beast summed it up well: "Microsoft's $6.2 Billion Writedown Shows It's Losing War With Google."
I still like Microsoft because it's good at what it does. But advertising and search isn't it. That's Google's turf. And today you can buy Google at literally the lowest price-to-cash-flow ratio ever. Take advantage of that while it lasts.
Johnson & Johnson is one of the best-performing stocks over the last several decades. But it's having a rough go of it lately. Recalls, management blunders, more recalls, competition from generics... and on and on. Yes, growth has slowed. Yes, it might stay slow for a while. But valuation more than compensates for that. The stock currently provides a 3.6% dividend yield, and trades for 12 times next year's earnings -- below the market average. It's a good company at a good price.
Procter & Gamble is a similar story. One of the world's greatest collections of brands has hit a slowdown. That's hit shareholder returns -- P&G shares haven't budged in two years. But most of the company's missteps appear to be tied to poor execution by management. My guess: Within a year or two the company will have a new CEO, and the market will come to appreciate its value anew.
Everything important you need to know about UnitedHealth Group comes down to the Affordable Care Act, also known as Obamacare. Most health insurance companies currently trade at depressed valuations, likely because the market hates uncertainty -- something that still exists even after the Supreme Court ruled Obamacare constitutional.
But what are the two most likely outcomes here? One is that Obamacare remains law, in which case insurers will face a raft of costly new rules, but also a flood of new customers essentially mandated to buy their product. The other is that Obamacare is repealed -- likely under a Romney administration -- in which case those costly new rules would go away. Neither outcome seems particularly bad for insurers.
Past performance is no guarantee of future returns, but I can't help but point out how successful Colgate-Palmolive has been over the last 30 years. The toothpaste and soap company has produced average returns of nearly 17% a year since 1980, compared with 11% for the broader market. That's the power of two forces: A strong brand, and simple products that aren't pushed to extinction by new technology. Combine that with a pretty reasonable valuation, and Colgate-Palmolive should be a great company to own for years to come.