Showing posts with label tactical asset allocation. Show all posts

Saturday, 13 December 2025

Most of your portfolio’s performance depends on this mix, not picking individual stocks. Pick a stocks/bonds mix that lets you sleep at night while still growing your money over time.


Simple Guide for Investors

1. Start with your mix of stocks and bonds

  • Stocks = higher growth, higher risk

  • Bonds = lower growth, lower risk

  • Most of your portfolio’s performance depends on this mix, not picking individual stocks.

2. Choose your ratio based on two things:

  • How much risk you can stomach – don’t panic-sell in downturns

  • How much growth you need – to beat inflation and reach your goals

3. Use time to your advantage

  • Stocks can be rocky short-term but grow well over 10+ years

  • The longer your timeline, the more stocks you can consider

4. A simple example:

  • Conservative: 60% bonds, 40% stocks

  • Balanced: 50% bonds, 50% stocks

  • Growth-oriented: 30% bonds, 70% stocks

5. Stick to your plan

  • Once you choose your mix, keep it – rebalance once a year

  • Don’t chase hot trends or sell in panic

Bottom line:
Pick a stocks/bonds mix that lets you sleep at night while still growing your money over time. Start simple, stay steady, and let time work for you.


=====


This is an informative excerpt on portfolio construction and the risk-return trade-off between stocks and bonds. Below is a detailed analysis, discussion, and commentary based on the provided content.


1. Key Takeaways from the Text

A. Asset Allocation Dominates Performance

  • Studies show that 77–94% of portfolio return variability is due to asset allocation.

  • This underscores the importance of strategic asset allocation over stock picking or market timing.

B. Stocks and Bonds as Core Building Blocks

  • Stocks and bonds are lowly correlated asset classes.

  • Adjusting the stocks/bonds mix is a fundamental way to control portfolio risk.

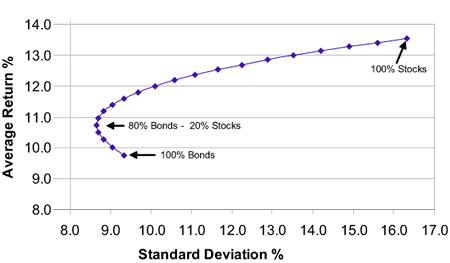
C. Historical Risk-Return Trade-off

  • The chart referenced (1880–2004) shows:

    • 100% bonds: lower return, lower volatility.

    • Increasing stock allocation: higher return but higher standard deviation.

    • 80% bonds / 20% stocks appears on the chart as a midpoint between risk and return.

D. Risk Tolerance vs. Required Risk

  • Investors must balance:

    1. Risk tolerance (emotional/psychological capacity to endure losses).

    2. Required risk (level of risk needed to meet financial goals and beat inflation).

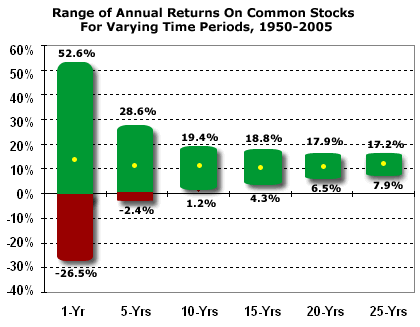
  • Time horizon matters: stocks are volatile short-term but historically positive over long periods (e.g., 25 years).


2. Discussion Points

A. Is the Stock/Bond Model Still Valid?

  • The data ends in 2004. Since then, we’ve had:

    • The 2008 financial crisis.

    • Extended low-interest-rate environments.

    • Rising bond-stock correlation at times (e.g., 2022).

  • Question: Does the traditional negative correlation still hold in all market regimes?

B. Inflation Considerations

  • The text mentions needing to “outrun inflation.”

  • In high-inflation regimes (like 2021–2023), both stocks and bonds can suffer.

  • TIPS, commodities, real assets may need to be part of the modern allocation.

C. The “Worst 25-Year Period” Argument

  • The text says the worst 25-year period (1950–2005) returned +7.9% annually for stocks.

  • This is a powerful argument for long-term equity investing.

  • However, it’s based on US data – survivorship bias? Would other countries show the same?

D. Behavioral Risks

  • Even with a “rational” asset allocation, investors may panic-sell in downturns.

  • Solution: Education, automated rebalancing, and using target-date or risk-rated funds.


3. Commentary & Critique

Strengths of the Presented View

  1. Evidence-based: Uses long-term historical data.

  2. Simple & actionable: Easy for investors to grasp stocks/bonds mix.

  3. Highlights time horizon: Crucial for matching investments to goals.

Potential Shortcomings

  1. Outdated data: Post-2008 monetary policy may have altered risk premiums.

  2. Non-US diversification ignored: No mention of international stocks/bonds.

  3. Ignores other assets: Real estate, gold, alternatives not considered.

  4. Static allocation assumption: Doesn’t discuss dynamic/tactical shifts or lifecycle investing.


4. Practical Implications for Investors

  1. Start with asset allocation — it’s more important than individual security selection.

  2. Use stocks for growth, bonds for stability — but adjust ratio based on:

    • Age/time horizon

    • Risk capacity (not just tolerance)

    • Market valuations (CAPE, yield curves)

  3. Rebalance regularly to maintain target allocation.

  4. Consider global diversification beyond S&P 500 and Treasuries.

  5. Review periodically — required risk changes with life stage and goal proximity.


5. Conclusion

The passage provides a solid foundational lesson in portfolio theory:

Asset allocation is key, stocks and bonds are the core, and risk should match both your personality and your goals.

However, modern portfolios may require more nuanced building blocks and global perspectives to achieve similar efficiency in today’s interconnected, low-yield, and inflation-sensitive world.

For a beginner investor, this is an excellent starting point.
For an advanced investor, this should be the foundation upon which more sophisticated diversification is built.


Final thought: The most important line in the text may be:

“You need to be able to keep your asset allocation in both good years and bad years.”
Discipline often matters more than the precise percentage in stocks vs. bonds.

Risk-return trade-off between bonds and stocks


Here’s a simple summary to guide an investor based on the chart:


🧭 Key Takeaways for Investors

  1. Don’t go 100% bonds
    Even a small amount of stocks (like 20–40%) can give you higher returns with the same level of risk as an all-bond portfolio.

  2. The sweet spot is in the middle
    Historically, a mix of 40% stocks / 60% bonds offered about 2% more annual return than 100% bonds, without taking more risk.

  3. 100% stocks isn’t always worth it
    Going from mostly stocks to 100% stocks adds a lot more risk but very little extra return — so think twice before going all-in on stocks.

  4. Diversify to do better
    Blending stocks and bonds has improved returns while controlling risk — that’s the power of diversification.


✅ Simple Rule of Thumb

  • If you’re conservative: Consider at least 20–40% in stocks to boost returns without much extra risk.

  • If you’re moderate: A 40–60% stock allocation has historically balanced risk and return well.

  • If you’re aggressive: Going above 80% stocks may not reward you enough for the extra risk you’re taking.

Remember: This is based on past performance (1980–2004) — but the idea that a balanced portfolio usually works better than extremes still holds true today.


=====


This chart and its accompanying text illustrate a classic risk-return trade-off between bonds and stocks over the period 1980–2004, using two benchmarks:

  • Stocks: S&P 500 index

  • Bonds: A mix of 80% five-year Treasury notes and 40% long-term Treasury bonds (note: this sums to 120%, possibly a typo in the original description—likely meant to be a different split, e.g., 50% each or similar).


Key Observations from the Chart:

  1. Efficient Frontier Shape
    The curve is upward sloping but not linear. It shows that as you increase stock allocation:

    • Return increases

    • Risk (standard deviation) increases

    • But the marginal return per unit of risk decreases at higher stock allocations.

  2. Notable Portfolios

    • 100% Bonds: Lowest return (~9%) and lowest risk (~9% standard deviation).

    • 40% Stocks / 60% Bonds: Same risk as 100% bonds (~9% standard deviation) but ~2% higher average annual return (~11% vs ~9%).
      → This is a striking example of diversification benefit: adding some stocks reduced risk-adjusted return significantly.

    • 100% Stocks: Highest return (~14%) but highest risk (~17% standard deviation).

  3. Flattening Curve at High Stock Allocations
    As you approach 100% stocks, the curve becomes flatter. This means:

    • Taking on much more risk for only a small gain in return.

    • For example, moving from 80% stocks to 100% stocks increases risk noticeably but adds little extra return.


Implications for Portfolio Construction:

  • Optimal Range: The most “efficient” portfolios seem to lie between 20% stocks and 60% stocks, where each unit of risk yields meaningful additional return.

  • Why Few Portfolios Have >60% Bonds:
    The 40/60 stock/bond mix offers same risk as 100% bonds but higher return—making very high bond allocations inefficient unless the investor is extremely risk-averse.

  • Diminishing Returns to Risk:
    At high equity allocations, additional risk may not be worth the small incremental return—important for aggressive investors to consider.


Limitations & Considerations:

  • Time Period Specific: 1980–2004 included a long bull market in bonds (falling interest rates) and strong equity performance. Results may differ in other periods (e.g., rising rate environments).

  • Bond Portfolio Composition: The bond mix described seems unusual (120% total). This might be an error; normally it would be something like 50% five-year Treasuries and 50% long-term Treasuries, or similar.

  • No Other Assets: The chart only compares stocks vs. U.S. Treasuries. Adding corporate bonds, international stocks, or other assets could shift the efficient frontier.

  • Inflation Not Adjusted: Returns are nominal, not real.


Conclusion:

The chart effectively demonstrates:

  1. Diversification improves risk-adjusted returns—adding some stocks to a bond portfolio can boost return without increasing risk, up to a point.

  2. There’s an optimal balance—in this historical window, it was around 40–60% stocks for many investors.

  3. Going all-in on stocks gives diminishing extra return for much higher risk—a reminder that extreme allocations may not be efficient.

This supports common asset allocation advice: moderate stock exposure (e.g., 40–70%) often provides the best trade-off for long-term investors, unless they have very low or very high risk tolerance.


Wednesday, 11 July 2012

Tactical dynamic asset allocation or rebalancing based on valuation, sounds easier than is practical


Tactical dynamic asset allocation or rebalancing based on valuation can be employed but this sounds easier than is practical, except in extreme market situations.  


Tactical dynamic asset allocation or rebalancing involves selling at the right price and buying at the right price based on valuation.  


Assuming you can get your buying and your selling correct 80% of the time;, to get both of them right for a profitable transaction is only slightly better than chance (80% x 80% = 64%).  


Except for the extremes of the market, for most (perhaps, almost all of the time), for such stocks, it is better to stay invested (buy, hold, accumulate more) for the long haul.


Ref: My 18 points guide to Successfully compounding your money in Stocks

Wednesday, 23 May 2012

Tactical asset allocation cannot be employed consistently

I personally feel that tactical asset allocation cannot be employed consistently for most parts of the market.  

However, this strategy can probably can be employed rationally at certain times when the market were obviously undervalued (1997/98, 2008/2009) or when it was highly overvalued  (bubble  in 1996/97). 

Therefore, in the long investment period that you are in, it is the rare occasions when you will be fully invested (80% equity:20% cash) or fully out of (50% equity: 50% cash) the market.  (My own asset allocation figures Wink ).  

Did you feel that the market was a bubble in 2008?  

http://myinvestingnotes.blogspot.com/2010/04/wealth-maximising-strategies-for-your.html
Wealth Maximising Strategies for your Portfolio

http://myinvestingnotes.blogspot.com/2010/06/overview-of-investment-strategies-and.html
Investment Strategies and Theories You Must Know for Greater Investment Success!

http://myinvestingnotes.blogspot.com/2009/07/buy-low-sell-high-approach.html
Buy-Low-Sell-High Approach

Saturday, 3 March 2012

Various methods of taking advantage of the stock market’s cycles: "Formula Investment Plans"

Formula Plans

In the early years of the stock-market rise that began in 1949–50 considerable interest was attracted to various methods of taking advantage of the stock market’s cycles. These have been known as “formula investment plans.” 
  • The essence of all such plans—except the simple case of dollar averaging—is that the investor automatically does  some selling of common stocks when the market advances substantially. 
  • In many of them a very large rise in the market level would result in the sale of all common-stock holdings; others provided for retention of a minor proportion of equities under all circumstances.
This approach had the double appeal of sounding logical (and conservative) and of showing excellent results when applied retrospectively to the stock market over many years in the past. Unfortunately, its vogue grew greatest at the very time when it was destined to work least well.
  • Many of the “formula planners” found themselves entirely or nearly out of the stock market at some level in the middle 1950s. 
  • True, they had realized excellent profits, but in a broad sense the market “ran away” from them thereafter, an their formulas gave them little opportunity to buy back a commonstock position.*
There is a similarity between the experience of those adopting the formula-investing approach in the early 1950s and those who embraced the purely mechanical version of the Dow theory some 20 years earlier.
  • In both cases the advent of popularity marked almost the exact moment when the system ceased to work well. 
  • We have had a like discomfiting experience with our own “central value method” of determining indicated buying and selling levels of the Dow Jones Industrial Average. 
  • The moral seems to be that any approach to moneymaking in the stock market which can be easily described and followed by a lot of people is by its terms too simple and too easy to last.† 
  • Spinoza’s concluding remark applies to Wall Street as well as to philosophy: “All things excellent are as difficult as they are rare.”


* Many of these “formula planners” would have sold all their stocks at the  end of 1954, after the U.S. stock market rose 52.6%, the second-highest  yearly return then on record. Over the next five years, these market-timers would likely have stood on the sidelines as stocks doubled.

† Easy ways to make money in the stock market fade for two reasons: 
  • the 
    natural tendency of trends to reverse over time, or “regress to the mean,” and,
  • the rapid adoption of the stock-picking scheme by large numbers of people, who pile in and spoil all the fun of those who got there first. 
(Note that, in referring to his “discomfiting experience,” Graham is—as always— honest in admitting his own failures.) 


Ref:  Chap 8 Intelligent Investor by Benjamin Graham

Saturday, 6 November 2010

How to Time The Market

COMMON SENSE
SEPTEMBER 25, 2010
How to Time The Market

By JAMES B. STEWART

Is the stock market losing its predictive powers?

We know the market anticipates economic activity, which is why it is pointless to buy stocks only after good news has been published. Stock prices are one of the leading economic indicators. The rule of thumb has always been that stocks anticipate the broad economy by about six months.

But now that it is official, and we know from the National Bureau of Economic Research that the Great Recession began in December 2007 and ended in June 2009, the market's crystal ball is looking a little cloudy.

The Standard & Poor's 500-stock index peaked at 1565 in October 2007. By Nov. 23 it had dropped nearly 8%, a painful fall but not the bear-market drop of 20% or more that traditionally signals a recession. As the recession actually started, the market actually rallied, with the S&P reaching 1427 in May 2008. The market gave investors little or no warning of the grave crisis to come.

The S&P hit a bottom of 677 in March 2009, less than three months before the recession ended, and rose a sharp 30% by May. That was a pretty clear signal, although the forecast came three months late.

Given that it reflects the collective wisdom of millions of investors, the market may be the best prognosticator we have. But it's just not good enough. These recent results reinforce my belief—and a fundamental premise of this column—that no one can predict the future. It is not only futile but counterproductive to invest based on our feelings about where the market is headed next. Sadly, for most investors that approach leads to buying high and selling low, which is anathema to the Common Sense system.

I believe in a disciplined approach to personal investing that minimizes emotions in decision-making, respects the past, which is knowable, and never tries to predict the future, which is not. I share my decisions in this column and the results are on display for all to see.

By following the Common Sense system, I never buy stocks at a market peak, and I never sell at a bottom. Like all investors, my aim is to buy lower and sell higher. I don't claim to have perfect timing. No one can identify markets tops and bottoms with any consistency. But my goal is to earn a profit, and over the long term, beat the market averages. So far it's worked. (A hypothetical portfolio using the strategy would have outperformed the S&P 500 even during the most volatile stretch of the financial crisis.)

The Common Sense system is also simple to execute. It requires no computers or high-speed trading capacity. Indeed, it doesn't require much trading at all, which is why you won't find a stock tip in this column every week. It's designed for average investors, not professionals.

I am a working journalist, not a stockbroker or hedge-fund manager. But I firmly believe anyone can manage their own investment portfolios and outperform a simple buy-and-hold index approach.

Here is how the system works: When the market is dropping, I buy stocks at intervals of 10% declines from the most recent peak. When it is rising, I sell at intervals of 25% gains from the most recent low.


These figures are roughly one-half the historical average losses of 20% in bear markets and gains of 50% in bull markets since 1979. They are round numbers and the math is easy to do in your head.

I use the Nasdaq composite index as my benchmark, partly because I had mostly Nasdaq-listed stocks when I began the system, and also because the Nasdaq is a little more volatile than the S&P 500 or Dow Jones Industrials, which provides more trading opportunities. Investors who want to buy and sell a little less often might prefer another index, but the Nasdaq has worked well for me.

I always alert readers when a new threshold is reached and share my decision to buy or sell. The current targets are about 2025 and 2600, respectively.

Easy as this system sounds—and it is simple in concept—it is amazing how it difficult it sometimes feels. I remember vividly being at a cocktail party in October 2008. Everyone was boasting about their recent decision to bail out of the stock market. When my turn came, and I said I had bought stocks that very morning, they looked at me like I was from Mars. The S&P 500 was trading at about 840 that day. On Friday, it closed at 1149.

Of course there is much more to this column than reacting to broad moves in the market averages. As a journalist, I am constantly translating news into investment strategies that I both implement myself and share with readers. My overall exposure to the market may be constant, but I often substitute stocks and sectors.

Most of all, I find investing and thinking about markets to be both stimulating and fun. It is an adventure and a learning experience as well as financially rewarding. I hope you will continue to share it with me.

—James B. Stewart, a columnist for SmartMoney magazine and SmartMoney.com, writes weekly about his personal-investing strategy. Unlike Dow Jones reporters, he may have positions in the stocks he writes about. For his past columns, see: www.smartmoney.com/commonsense.

http://online.wsj.com/article/SB10001424052748704062804575509811560989940.html?mod=WSJ_article_related

Sunday, 31 October 2010

Asset Allocation: Is it Necessary or Effective?

October 29th, 2009


 Asset allocation is a device used by investors and financial planners to populate a portfolio with an appropriate mix of investment vehicles selected from a smorgasbord of stocks, bonds, and occasionally other investments, each deemed to carry with it a uniquely predictable degree of risk.
Its goal is to optimize the return on the portfolio while taking into account  that investor’s tolerance for risk. And,  risk aversion is analyzed using such factors as the point the client has reached in her life cycle, her current and future responsibilities, her earning capacity—as well as the nuances of his or her character and personality.
The assumption is that there is an inverse relationship between  risk and return; and, the more aggressive the portfolio—one invested primarily in common stocks—the more risky it is.
Few amateur investors have the experience or know-how to apply asset allocation without the help of a professional. And, considering the view that most amateurs have of “investing,” the expense of such a professional might easily be justified. But….
I agree with Peter Lynch’s view that one should invest as if she were going to live forever. In my view, the most aggressive portfolio should be expected to generate no higher a return than the potential growth rate of a basket of well managed companies’ earnings—between 10% and 15% a year. And that there’s simply no need to dilute the return of a portfolio with any investment vehicles that would return less than that. I believe that’s all the “asset allocation” anyone needs!
The secret is to recognize that there is virtually no risk when you select those companies for their ability to grow their earnings consistently and adequately; and when you understand that the oscillations of the stock market—and the prices of the shares of the companies you own—have nothing whatever to do with the operation of those companies and the generation of profits for their owners. And, as an owner, you’re in it for those profits


http://www.financialiteracy.us/wordpress/2009/10/29/asset-allocation-is-it-necessary-or-effective/