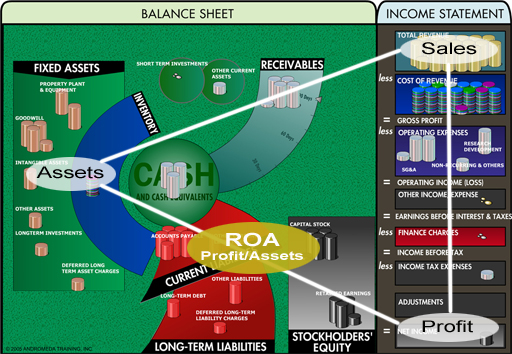
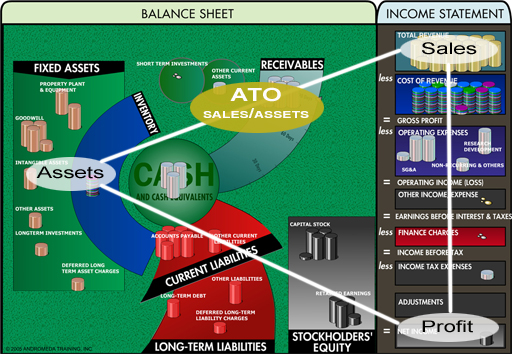
ROA of Banks, Investment Banks and Financial Companies
A company like Freddie Mac, which deals in residential mortgages, carries $175 billion in short-term debt and $185 billion in long-term debt. If your business is borrowing money at 6% and loaning it out at 7%, there is no way your return on total capital ROTC is going to even approach 12%.
In these instances, Warren Buffett likes to look at what the bank or finance company earned in relation to the total assets under its control. The rule here is, the higher the better. Anything over 1% is good and anything over 1.5% is fantastic.
Learning Point
With banks, investment banks, and financial companies, look for a consistent return on assets ROA in excess of 1% and a consistent return on shareholders' equity ROE in excess of 12%.
=====
Why Return on Assets (ROA) is a critical and preferred metric for evaluating banks, investment banks, and financial companies (as opposed to Return on Total Capital, or ROTC). Here is a discussion and summary of the key points:
Core Discussion Points:
Unique Business Model: These institutions are fundamentally in the "business of money." Their core activity is financial intermediation: borrowing at lower rates (e.g., from deposits or debt markets) and lending/investing at higher rates. This makes them highly leveraged (carry massive debt) by design.
Why ROA (not ROTC) is Key:
Their balance sheets are dominated by interest-bearing liabilities (debt). Using Return on Total Capital (ROTC), which includes this debt, would be misleading.
As the Freddie Mac example illustrates: borrowing at 6% and lending at 7% yields a slim net interest margin. When this slim profit is measured against the enormous total capital (equity + massive debt), the ROTC will always appear very low—even if the bank is run efficiently.
ROA cuts through this. By measuring Net Income / Total Assets, it assesses how effectively management is using the assets it controls (primarily loans and investments) to generate profits, regardless of how those assets were financed (with debt or equity).
Buffett's Benchmark Rules of Thumb:
ROA > 1% = Good. Indicates solid asset utilization and prudent risk management.
ROA > 1.5% = Fantastic. Suggests exceptional operational efficiency and/or a valuable, low-cost funding base (like a strong deposit franchise).
The Dual Mandate (ROA & ROE): The final learning point introduces the complete picture for evaluating these firms:
ROA (>1%): Measures operational efficiency and asset quality. A consistent ROA shows the core lending/investing business is sound.
ROE (>12%): Measures returns to shareholders. Because these firms use high leverage (debt), a solid ROA can be magnified into a high ROE. A consistent ROE above 12% indicates the firm is not only efficient but also generating attractive returns on its equity capital.
Summary:
For banks and financial companies, the standard return metrics used for industrial firms are distorted by their inherent, massive leverage. Therefore:
Focus on Return on Assets (ROA) to judge the efficiency and profitability of their core lending/investment operations. Warren Buffett considers a consistent ROA above 1% good and above 1.5% excellent.
Also consider Return on Equity (ROE) in conjunction with ROA. A strong, consistent ROE (exceeding 12%) indicates that the firm's operational efficiency (high ROA) is successfully being translated into strong returns for shareholders through prudent use of leverage.
In essence: For financial institutions, ROA tells you if they are good bankers, while ROE tells you if they are good investments for shareholders. A well-run bank should excel at both.