Showing posts with label inflation. Show all posts

Friday 14 June 2024

Supply Shocks and Stagflation


Box: Supply Shocks and Stagflation

If a supply shock is sufficiently large or persistent, it not only causes cost‑push inflation, but can noticeably reduce both the current and potential level of output in an economy. In this case, there can be the unusual combination of a period of ‘stagnation’ as output declines at the same time that prices are rising. This combination of stagnant growth – with high or rising unemployment – and high inflation is referred to as stagflation. Stagflation can become entrenched when inflation expectations are not well anchored.

The 1970s were a period of stagflation that featured two oil price shocks. In October 1973, the members of OPEC (the Organization of Petroleum Exporting Countries), as well as Egypt and Syria, imposed an oil embargo on industrial nations that had supported Israel in the Yom Kippur War of the same period. The embargo resulted in a quadrupling of oil prices and energy rationing, culminating in a global recession in which unemployment and inflation surged simultaneously. Central banks did not target inflation at this time, and this was the start of a prolonged period of high inflation in many economies.

Inflation expectations


Inflation expectations

Inflation expectations are the beliefs that households and firms have about future price increases. They are important because expectations about future price increases can affect current economic decisions that can influence actual inflation outcomes. For example, if firms expect future inflation to be higher and act on those beliefs, they may raise the prices of their goods and services at a faster rate. Similarly, if workers expect future inflation to be higher, they may demand higher wages to make up for the expected loss of their purchasing power. These behaviours, sometimes called ‘inflation psychology’, can contribute to a higher rate of actual inflation so that expectations about inflation become self-fulfilling.

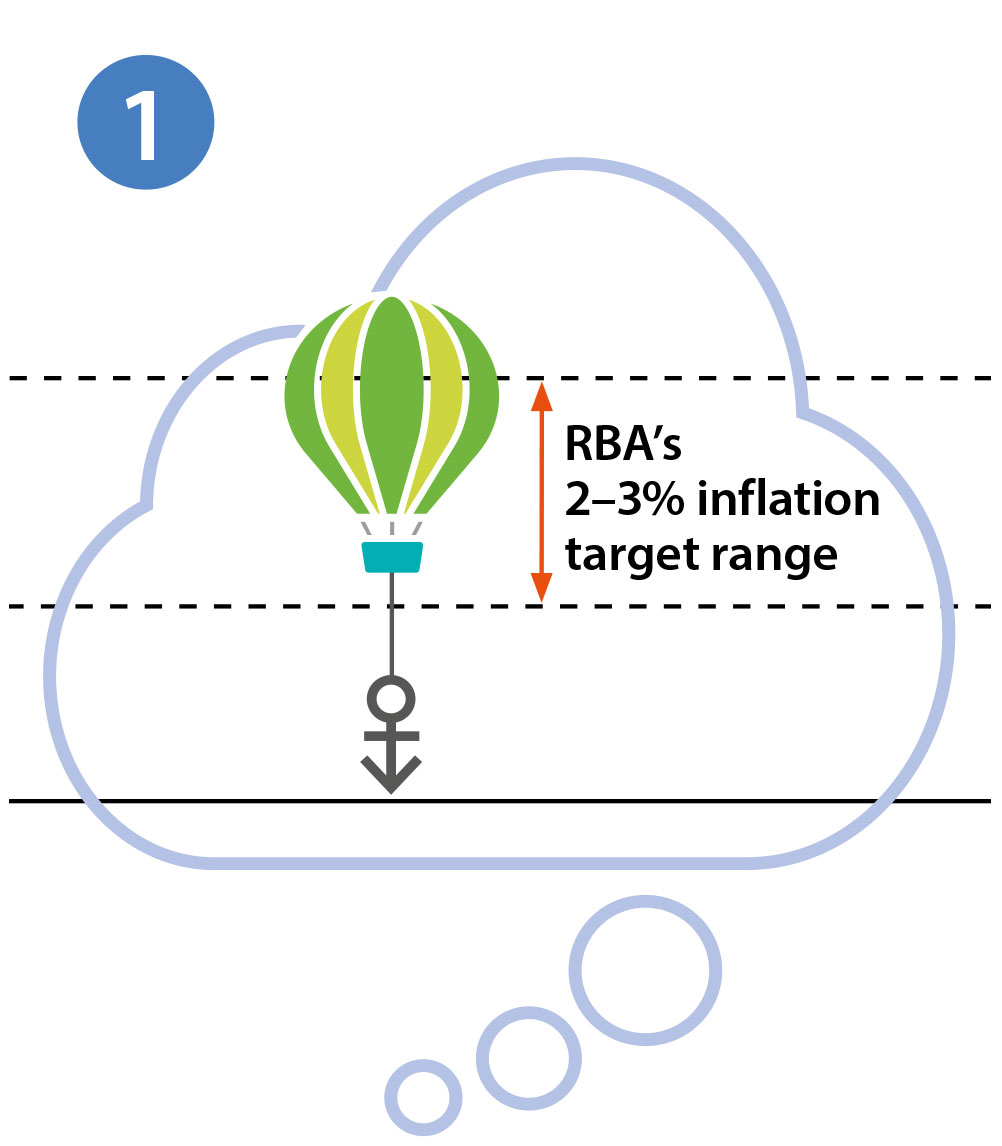
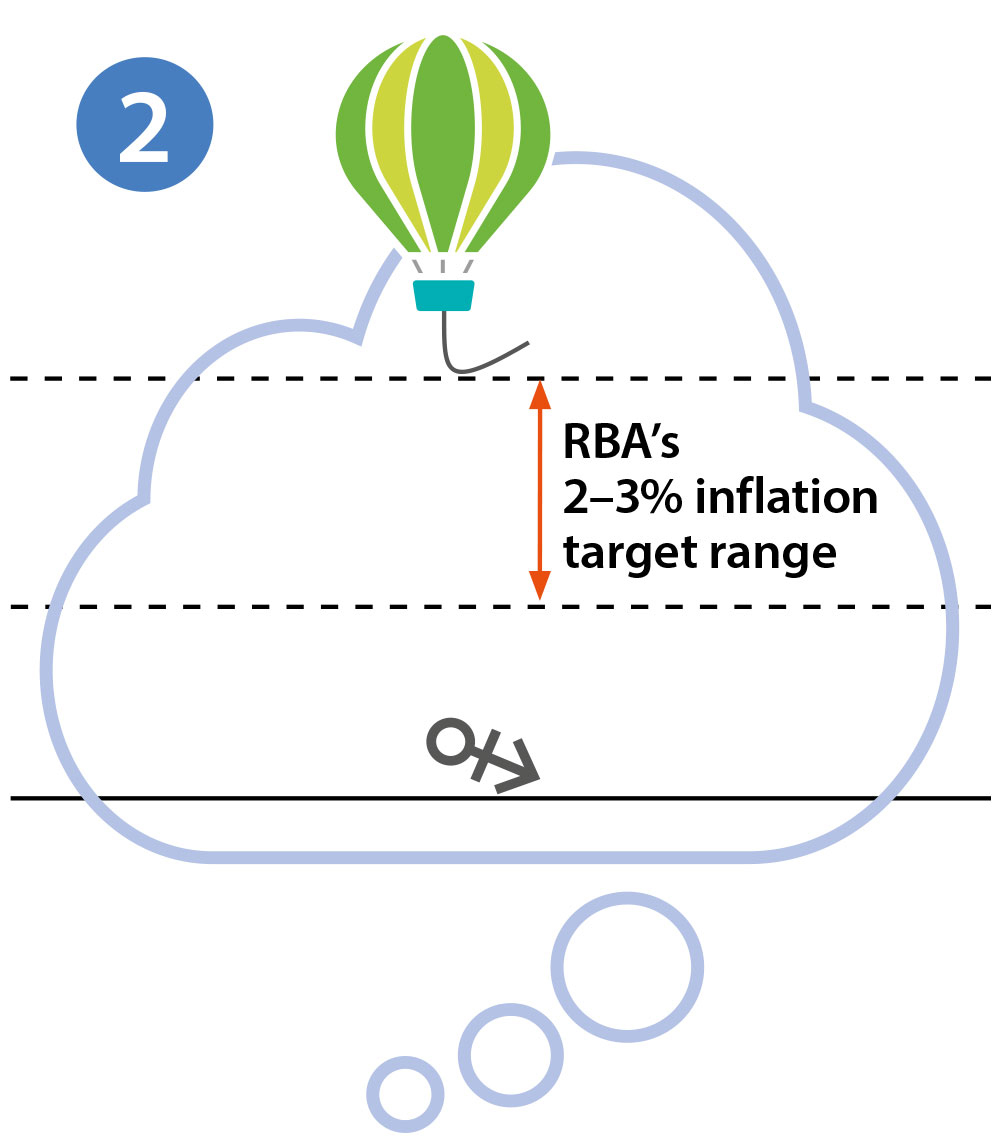
Given that inflation expectations can influence actual price and wage setting, the extent to which inflation expectations are ‘anchored’ has implications for future inflation outcomes. For example, if households' and firms' expect that inflation will return to the central bank's inflation target at some point in the future, regardless of what current inflation is, we describe their expectations as being ‘anchored’ to the inflation target. When expectations are anchored, a period of higher inflation – perhaps resulting from a cost‑push event – will not cause households and firms to change their behaviour and, as a result, inflation is likely to eventually return to its target. But if the inflation psychology of households and firms shifts and inflation expectations move away from the central bank's inflation target (i.e. they become ‘unanchored’), a period of higher inflation will become persistent because households and firms will expect inflation to be higher in the future and adjust their behaviour accordingly. Consequently, it is much easier for a central bank to manage inflation if inflation expectations are anchored rather than unanchored.

Illustrative Example of Anchored and
Unanchored Inflation Expectations
‘Anchored’ inflation expectations
Inflation expectations over the longer run remain little changed in response to a period of higher inflation. Households and firms expect the increase in inflation to be temporary and do not change their behaviour, seeing the actual rate of inflation return to the central bank's inflation target.
‘Unanchored’ inflation expectations
Inflation expectations over the longer run move higher in response to a period of higher inflation. Households and firms adjust their behaviour as they expect the increase in inflation to be more persistent, eventually leading to a higher rate of actual inflation.

While inflation expectations have an important influence on actual inflation outcomes, they are not directly observable. Instead, policymakers such as the Reserve Bank have to rely on measures of expected inflation that are based on surveys (where people are asked their views about the inflation outlook directly) or financial assets like government bonds (where the price of the asset reflects assumptions made about the future path of inflation, see Explainer: Bonds and the Yield Curve).

Cost-push inflation

Cost-push inflation

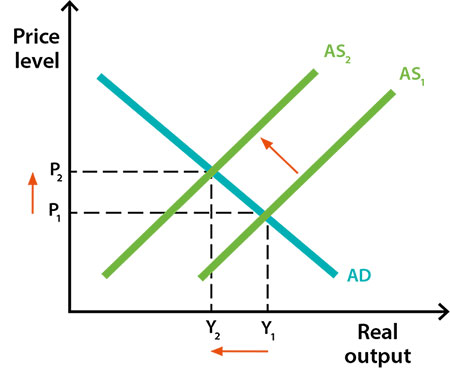
Cost-push inflation occurs when the total supply of goods and services in the economy which can be produced (aggregate supply) falls. A fall in aggregate supply is often caused by an increase in the cost of production. If aggregate supply falls but aggregate demand remains unchanged, there is upward pressure on prices and inflation – that is, inflation is ‘pushed’ higher.

Graph showing how a decrease in aggregate supply leads to an increase in prices and decrease in real output.

An increase in the price of domestic or imported inputs (such as oil or raw materials) pushes up production costs. As firms are faced with higher costs of producing each unit of output they tend to produce a lower level of output and raise the prices of their goods and services. This can have flow-on effects by pushing up the prices of other goods and services. For example, an increase in the price of oil, which is a major input in many sectors of the economy, will initially lead to higher petrol prices. However, higher petrol prices will also make it more expensive to transport goods from one location to another which, in turn, will result in increased prices for items like groceries.

Cost-push inflation can also arise due to supply disruptions in specific industries – for example, due to unusual weather or natural disasters. Periodically, there are major cyclones and floods that damage large volumes of agricultural produce and result in significant increases in the price of processed food and both takeaway and restaurant meals, resulting in temporary periods of higher inflation.

Imported inflation and the exchange rate

Exchange rate movements can also affect prices and influence inflation outcomes. A decrease in the value of the domestic currency − that is, a depreciation − will increase inflation in two ways. First, the prices of goods and services produced overseas rise relative to those produced domestically. Consequently, consumers pay more to buy the same imported products and firms that rely on imported materials in their production processes pay more to buy these inputs. The price increases of imported goods and services contribute directly to inflation through the cost-push channel.

Second, a depreciation of the currency stimulates aggregate demand. This occurs because exports become relatively cheaper for foreigners to buy, leading to an increase in demand for exports and higher aggregate demand. At the same time, domestic consumers and firms reduce their consumption of relatively more expensive imports and shift their purchases towards domestically produced goods and services, again leading to an increase in aggregate demand. This increase in aggregate demand puts pressure on domestic production capacity, and increases the scope for domestic firms to raise their prices. These price increases contribute indirectly to inflation through the demand-pull channel.

In terms of imported inflation, the exchange rate has a greater influence on inflation through its effect on the prices of goods and services that are exported and imported (known as tradable goods and services), while prices of non-tradable goods and services depend more on domestic developments.

Demand-pull inflation


Demand-pull inflation

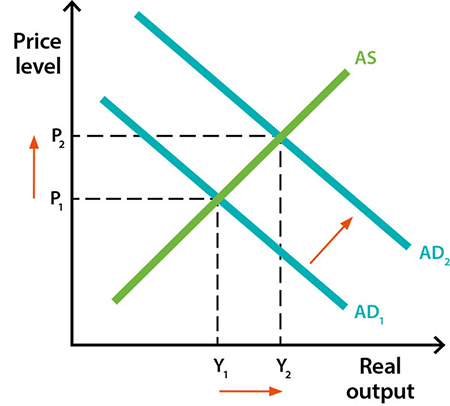
Demand-pull inflation arises when the total demand for goods and services (i.e. ‘aggregate demand’) increases to exceed the supply of goods and services (i.e. ‘aggregate supply’) that can be sustainably produced. The excess demand puts upward pressure on prices across a broad range of goods and services and ultimately leads to an increase in inflation – that is, it ‘pulls’ inflation higher.

Graph showing how an increase in aggregate demand leads to an increase in prices and real output.

Aggregate demand might increase because there is an increase in spending by consumers, businesses or government, or an increase in net exports. As a result, demand for goods and services will increase relative to their supply, providing scope for firms to increase prices (and their margins – which is their mark-up on costs). At the same time, firms will seek to employ more workers to meet this extra demand. With increased demand for labour, firms may have to offer higher wages to attract new staff and retain their existing employees. Firms may also increase the prices of their goods and services to cover their higher labour costs.[2] More jobs and higher wages increase household incomes and lead to a rise in consumer spending, further increasing aggregate demand and the scope for firms to increase the prices of their goods and services. When this happens across a large number of businesses and sectors, this leads to an increase in inflation.

Flow chart showing how an increase in aggregate demand leads to an increase
										 in firms' demand for workers, then an increase in wages and lastly an increase
										 in firms' prices. An increase in wages also leads to an increase in aggregate demand, creating a feedback loop.

The opposite will happen when aggregate demand decreases; firms facing lower demand will either pause hiring or make staff redundant which means that fewer staff are required. This puts upward pressure on the unemployment rate. More workers searching for jobs means that firms can offer lower wages, putting downward pressure on household incomes, consumer spending and the prices of their goods and services. As a result, inflation will decrease.

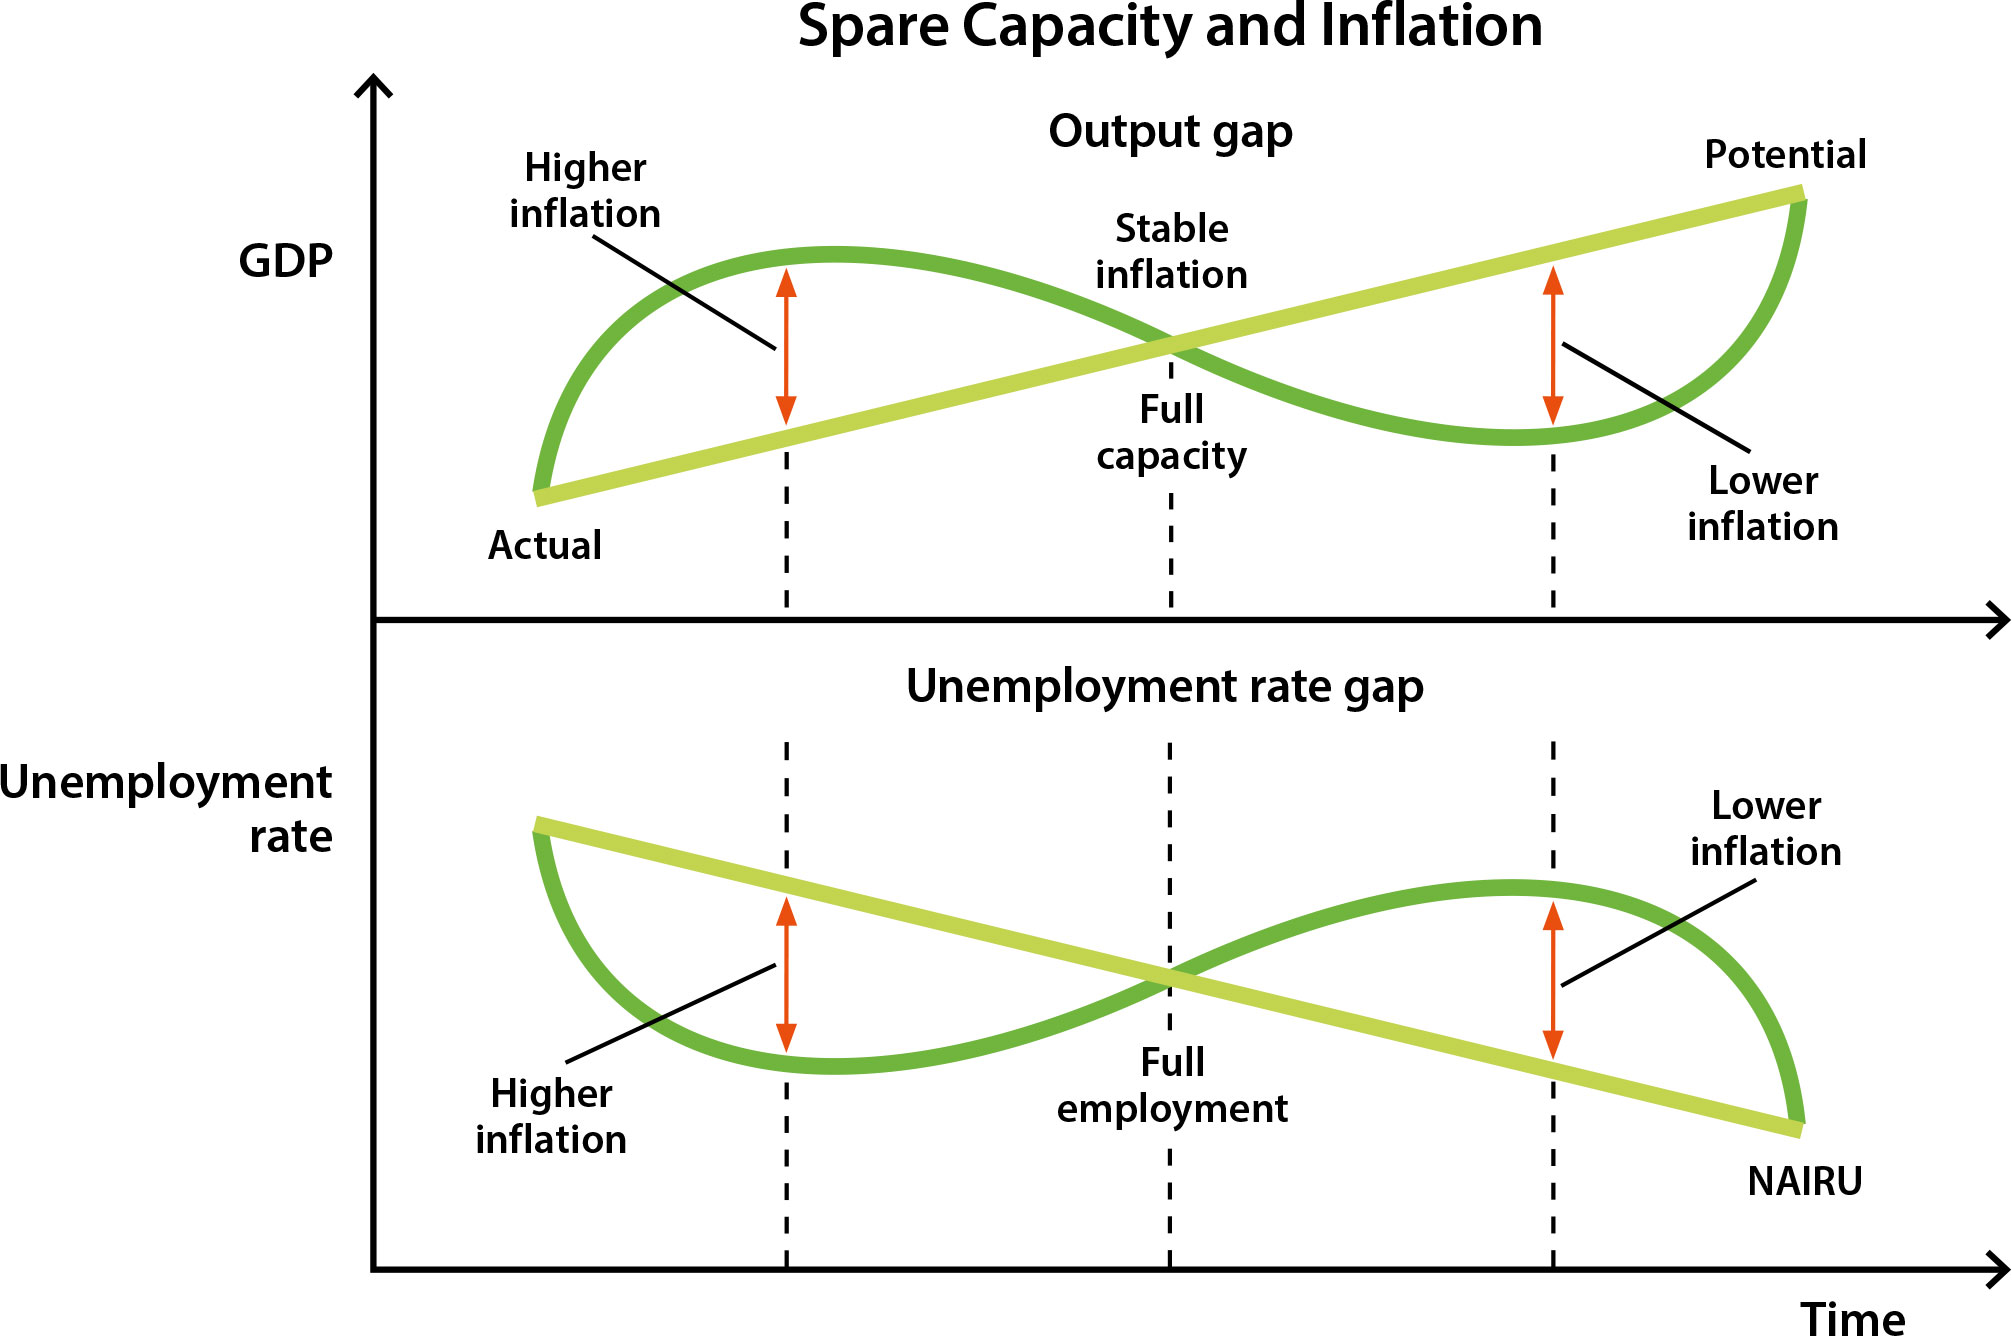
The supply of goods and services that can be sustainably produced is also known as the economy's potential output or full capacity. At this level of output, factors of production, such as labour and capital (which includes the machines and equipment firms use to produce their goods and services) are being used as intensively as possible without putting upward pressure on inflation. When aggregate demand exceeds the economy's potential output, this will put upward pressure on prices. When aggregate demand is below potential output, this will put downward pressure on prices.

So how can we measure how far the economy is from its potential output (or full capacity) and what does this mean for inflation? While we can fairly accurately measure aggregate demand on a quarter to quarter basis using gross domestic product (GDP) data from the national accounts (see Explainer: Economic Growth), potential output is not directly observable − that is, we have to infer it from other evidence about the behaviour of the economy. For instance, just as there is a level of output where inflation is stable, there is also a level of the unemployment rate that is consistent with stable inflation. It is known as the Non-Accelerating Inflation Rate of Unemployment or NAIRU for short (see Explainer: The Non-Accelerating Inflation Rate of Unemployment (NAIRU)). When unemployment is below the NAIRU, inflation will increase and when it is above the NAIRU inflation will decrease.

Image showing an example of spare capacity and inflation. When there is a positive output gap (actual output is
										  greater than potential output) and the unemployment rate is below the non-accelerating
										  inflation rate of unemployment (or NAIRU), there will be a higher rate of inflation and vice versa.

Causes of Inflation: demand-pull, cost-push and inflation expectations

Causes of inflation

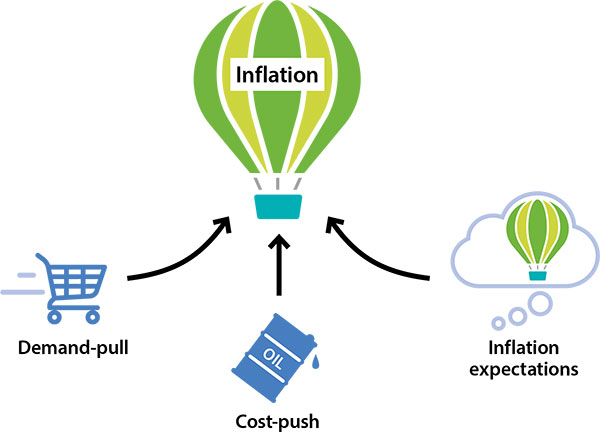
The main causes of inflation can be grouped into three broad categories:

  1. demand-pull,
  2. cost-push, and
  3. inflation expectations.

As their names suggest, ‘demand-pull inflation’ is caused by developments on the demand side of the economy, while ‘cost-push inflation’ is caused by the effect of higher input costs on the supply side of the economy. Inflation can also result from ‘inflation expectations’ – that is, what households and businesses think will happen to prices in the future can influence actual prices in the future. These different causes of inflation are considered by the Reserve Bank when it analyses and forecasts inflation.[1]

Image showing the three main causes of inflation: demand-pull, cost-push and inflation expectations.


Inflation

Inflation is an increase in the prices of goods and services. 

The most well-known indicator of inflation is the Consumer Price Index (CPI), which measures the percentage change in the price of a basket of goods and services consumed by households (see Explainer: Inflation and its Measurement). 

The CPI is the measure of inflation used by the Reserve Bank of Australia in its inflation target, where it aims to keep annual consumer price inflation between 2 and 3 per cent (see Explainer: Australia's Inflation Target). 

Other measures of inflation are also analysed, but most measures of inflation move in similar ways over the longer term.


Causes of inflation

The main causes of inflation can be grouped into three broad categories:

  1. demand-pull,
  2. cost-push, and
  3. inflation expectations.

Monday 24 July 2023

Political revolt and Food prices

There is never one cause of a political revolt, but food prices have played a role in many.  


Consumer prices have been intimately connected to the cycle of political crisis, revolt and reform.

1.  The Revolutions of 1848 targeted European monarchies and followed the spread of democratic ideas on the continent.  Spiking food prices was identified as the main catalyst too.

2.  In recent decades, Latin America has been a cauldron of inflation driven unrest.  Between 1946 and 1983, 15 governments fell in Latin America, and in 13 of those cases, from Mexico to Argentina, the regime change followed a sure in the annual rate of consumer price inflation to 20% or more.

3.  Rising prices for wheat and other grains also contributed to the 1989 fall of Communism in the Soviet Union.


Inflation fell in most emerging nations but occasional flare-ups continued to topple leaders.  

There was a strong link between food prices and unrest in many countries between 1990 and 2011.

1.  Inflation helped oust regimes in Brazil, Turkey and Russia (again) in the late 1990s.

2.  In 2008, World Bank warned that at least 33 countries faced a risk of social revolt sparked by food prices, which had risen 80% in the previous 3 years.

3.  Food prices did help spark revolts worldwide in 2011, including the Arab Spring.  

4.  In India before the 2013 election, the voters were complaining about price of onions.  The Congress Party lost to Modi's Hindu nationalist party, and polls showed that inflation had played a major role in the Congress government's downfall.


Conclusion:

High or rapidly rising consumer price inflation threatens economic growth directly and indirectly, because it can provoke destabilising social unrest.  

Watch for leaders who understand this inflation threat, and how to use the weapons that can control it.

High inflation for consumer prices is almost always a threat to growth but deflation is not.

For the eight centuries beginning in 1210, the world's average annual inflation rate was only 1%, according to the Global Financial Database.  For  most of that period, however, the long-term 1% average concealed sharp swings between inflation and deflation.

In early 1930s, deflation disappeared, for reasons that remain mysterious but include the spread of the banking industry and the wider availability of credit, with consequently more money chasing the available goods.

The end of the gold standard in the 1970s made it easier for central banks to print money, which also tends to fuel inflation.

The result was that deflation disappeared completely on the global level, and bouts of deflation - particularly longer ones - became much less common within individual nations as well.  


Though deflation has largely vanished, worldwide, it continues to surface in isolated pockets.  

Japan is the only major country to have suffered a multiyear case of deflation in the postwar era, but many countries have suffered a single-year bout.  

Again, however, these periods did not have a consistent impact on growth, for better or worse.


No clear evidence that consumer price deflation is bad - or good- for economic growth.

In early 2015, the Bank for International Settlements (BIS) looked at the postwar record for 38 countries.  In all, these countries had seen more than 100 years in which prices fell.  

  • On average, GDP growth was higher by a statistically insignificant margin during deflationary years, at 3.2%, than during inflationary years, at 2.7%.   
  • The cases in which deflation was accompanied by strong growth occurred from Thailand and China to the Netherlands and Japan.  
The BIS concluded there is no clear evidence that consumer price deflation is bad - or good- for economic growth.


High inflation for consumer prices is almost always a threat to growth but deflation is not.

How can you tell when consumer price deflation is the good kind, driven by growing supply, or the bad kind, driven by shrinking demand?  

This task requires parsing conflicting forces of supply and demand, often with unclear results.  

The takeaway is simply that while many analysts now assume that any hint of deflation is worrisome, this assumption is not borne out by the evidence.  

High inflation for consumer prices is almost always a threat to growth but deflation is not.


Sunday 23 July 2023

Understanding Real Inflation Threats

When may inflation be too high?

These are still very useful averages as benchmarks for judging when inflation may be too high:

  • Any emerging nation with a rate of inflation much above 4%, or 
  • any developed nation with a rate much above 2%.

Any country with high inflation has cause for concern.


High consumer price inflation is a growth-killing cancer.  

This still holds true.  

  • In the short-term, rapidly rising prices compel central banks to raise interest rates, making it more expensive for businesses and consumers to borrow.  High inflation also tends to be volatile, and its swings make it impossible for businesses to plan and invest for the future.   
  • Over the longer term, inflation erodes the value of money sitting in the bank or in bonds, thus discouraging saving and shrinking the pool of money available to invest in future growth.


Actions of central banks post crisis of 2008

In the slow growth-environment that took hold after the crisis of 2008, central banks often worry that inflation may be too low, not too high.

In developed countries, instead of raising rates to make sure inflation doesn't increase to far above a target of 2%, they now cut interest rates when inflation is falling too far below 2%.  

Their big fear is that low inflation will lead to outright deflation - the dreaded but overblow "Japan scenario".


"Bad deflation" and "Good deflation"

History, in fact, shows that neither low inflation nor deflation are necessarily bad for economic growth.   

Japan suffered a rare bout of "bad deflation" after the collapse of its stock and housing bubbles in 1990Consumer demand dried up, prices started to fall and shoppers began delaying purchases in the expectation that prices would fall further.  The downward spiral depressed growth for 2 decades.  

However, deflation can also follow a new tech or financial innovation that lowers production costs and boosts economic growth.

If inflation is too high, it is almost always a threat to growth but the same cannot be said of low inflation.  Even if low inflation threatens to devolve into deflation, it could be good for growth if falling prices are driven by new innovation and expanding supply rather than by depressed demand.


Need to control inflation in both consumer markets and financial market

Perhaps, the deepest flaw in traditional thinking, however, is that it still focuses on the kind of inflation that has largely disappeared.   

  • After the central banks won the war on high consumer price inflation, they cut interest rates to levels that have fueled a massive run-up in prices for financial assets, including stocks, bonds, and houses.  
  • And in recent decades, as we have seen, stock market and housing bubbles have been increasingly common precursors to financial crisis and recessions. 


Traditional thinking fails to recognize the new inflation threat in the financial market

Economists have been very slow to recognize this new inflation threat, and central banks have been very slow to think outside their official mandates, which focus on stabilising the economy by controlling inflation in consumer prices only.  

But successful nations will control both kinds of inflation, in consumer markets and in financial market.

No subject in economics is more paralyzed by traditional thinking than inflation, a term that generally refers only to the pace of increase in consumer prices, a once ubiquitous threat that has largely vanished in recent decades.  

Central bankers and economists still tend to focus on consumer price inflation, even though it has largely disappeared and to ignore prices for assets like stocks, bonds and real estate, even though there is an increasingly clear link between real estate and stock market busts and economic downturns.

Friday 19 May 2023

BNM defends recent OPR hike to 3%, saying it was to avoid greater unease of higher inflation


By Priyatharisiny Vasu & Syafiqah Salim 
/ theedgemarkets.com 
12 May 2023

Bank Negara Malaysia governor Tan Sri Nor Shamsiah Mohd Yunus says the central bank wanted to guard against a situation of raising rates too little and allowing inflation to resurge, or raising them too much and causing unnecessary economic weakness.

KUALA LUMPUR (May 12): 

Bank Negara Malaysia (BNM) defended its recent position of increasing the overnight policy rate (OPR) to 3% amid widespread misconception, saying the central bank wanted to avoid keeping the rate too low for too long when economic growth was firm. 

BNM governor Tan Sri Nor Shamsiah Mohd Yunus said at the briefing on the first quarter of 2023 on Friday (May 12) that the central bank wanted to guard against a situation of raising rates too little and allowing inflation to resurge, or raising them too much and causing unnecessary economic weakness. 

“I must also correct the perception that we want growth to be slower. That is certainly not true. Which one is more kejam (brutal)? [A rise in the] OPR, or if our inflation goes out of control? 

If our inflation level heats up, all our purchasing power will be impacted regardless of whether you have a loan or not,” the governor said. 

She added that prolonged low interest rates that are not aligned with the health of the economy could have damaging effects, such as overspending and overborrowing. 

 “This could push up prices even more. When that happens, all of us will be affected, especially the poor and vulnerable,” Nor Shamsiah said. 

 It can also encourage excessive risk-taking, and speculative investments to get higher returns, and increase chances of financial scams. 

 She added that the central bank wants economic growth to be on a sustainable trajectory, and as such, it is focused on ensuring the long-term impact of its policy rate decisions. “We want it to be sustainable, not just for today, but for months and years to come. We do not want to have a situation, where we just look at today’s growth numbers, but further down the road, it's not sustainable, where it leaves us in high inflation and even a recession. That is not what we are here for,” Nor Shamsiah said. 

 On May 3, BNM raised the OPR by 25 basis points (bps) to 3%, as the central bank believed the global economy continued to be driven by resilient domestic demand. The rate hike, after two consecutive pauses in early 2023 at 2.75%, came as a surprise after most economists predicted that the central bank would maintain the OPR to further assess the impact of four straight increases in the key rate last year that raised it by a cumulative 100 bps. 

 Inflation remains sticky 

 Nor Shamsiah said although headline and core inflation is expected to moderate over the course of 2023, core inflation would remain elevated. 

 Elevated underlying inflation has been more prolonged than in past episodes, the governor said, adding that it was partly owing to a strong recovery in domestic demand. 

 “While core inflation moderated to 3.9% during the [first] quarter, compared with 4.2% in the immediate preceding quarter, it remained elevated relative to the historical norm of around 2%,” she said. Core inflation is more indicative of demand pressures, she said, adding that both headline and core inflation will remain within 2.8% to 3.8% for the year as a whole. 

 “Even as cost has begun to moderate, strong economic activities have continued to generate demand-driven pressures, which have kept core inflation elevated,” the governor said. 

 She said higher core inflation could be observed beyond conventional demand indicators, such as retail trade and credit card spending data. 

 Existing price controls and fuel subsidies will be continued to partly contain the extent of upward inflationary pressures, according to her. 

 “The balance of risk to the inflation outlook is tilted to the upside, and remains highly subject to any changes in domestic policy, financial market developments and global commodity prices,” she said.

https://theedgemalaysia.com/node/666714


Friday 6 January 2023

Inflation and the Defensive Investor

Fixed income investments fare worse during inflationary periods than do common stocks.  During inflationary periods, firms can increase prices, profits, and dividends causing their share price to increase and offsetting declines in purchasing power. 

There is no underlying connection between inflation and the movement of common stock earnings and prices.  Appreciation does not result from inflation, but rather from the re-investment of profits.  The only way for inflation to increase common stock values is to raise the rate of earnings on capital investment, which it has not done historically.

Economic prosperity usually is accompanied by slight inflation, which does not affect returns.  Offsetting factors include rising wage rates that exceed productivity gains and additional capital needs that cause interest rates to increase.  

Graham describes alternatives to common stocks as a hedge against inflation.  These alternatives range from gold and diamonds to rare paintings, stamps, and coins.  Gold has performed poorly, far worse than returns from savings in a bank account.  The latter categories, such as paying thousands of dollars for a rare coin, can not qualify as an “investment operation.”  Real Estate is still another alternative; however, its value fluctuates widely, and serious errors may be made when purchasing individual locations.  

Again, the defensive investor is best served by purchasing a portfolio of carefully chosen common stocks and bonds.


Ref:  Intelligent Investor by Benjamin Graham

Sunday 28 November 2021

Everything You Need To Know About Money, Inflation. How The System Works


Everything You Need To Know About Money, Inflation | How The System Works | Business Documentary While the world comes out of economic recession due to the pandemic, a lot of things are changing. High inflation, stimulus packages, interest rates. All these words are popping up on the news, but it’s hard to figure out how does the whole system work. In this video, we explain all of that and more. Chapters: Hyperinflation Fiat Currency System Explained What if the dollar was still pegged to gold Why we might have high inflation soon Zombie companies

Inflation and Value of Bitcoin


Peter Schiff on Biden's Dysfunctional Economy, Inflation Concerns, and the Value of Bitcoin

Thursday 7 January 2021

Bitcoin's Bull Should Fear Its Other Scarcity Problem

As the value of this asset class rises, generating price spikes becomes increasingly difficult.


The Theory behind Bitcoins

The supply of Bitcoins was set from the start at 21 million.

That means, in the words of its pseudonymous founder Satoshi Nakamoto, it should ultimately be "completely inflation free" - making it a far better store of wealth than assets whose real value declines over time.

That's in theory, at least.


Digital currencies are still a tiny share of the world's investments

With the price of Bitcoin climbing as high as $34,792 Sunday (3.1.2021) and putting the value of all coins in circulation at around $647 billion, there is a different scarcity problem looming larger.


It is easier to think about this in terms of asset allocation.

World equity and bond markets  = $217 trillion

World equity markets = $103 trillion

World bond markets = $114 trillion

Bitcoins = 18.6 million coins = $647 billion.

Cryptocurrencies = $884 billion

Investment Gold = $3 trillion


If investors in aggregate decide to put just 0.1% of their stock and bond portfolios into Bitcoin right now, that represents an additional $200 billion or so, chasing the same pile of 18.6 million coins that have been mined to date - enough to push the price well over $40,000.

In that sense, the roller--coaster ride that Bitcoin has ridden in recent years looks almost sedate.

At current prices, all the digital Bitcoins in circulation are equivalent to about 0.6% of the $103 trillion market capitalization of the world's equity markets.

That is higher than the 0.4% allocation when the crypto price last peaked on Dec. 18, 2017 and much higher than levels shy of 0.1% that have prevailed at times since then - but it looks a whole lot less dramatic than the 79% run-up in coin prices from their last peak.


The success of cryptocurrencies tends to eat itself

The problem for digital bulls is that the success of cryptocurrencies tends to eat itself. 

As the value of the asset class rises, the shifts away from more conventional investments needed to provoke price spikes get larger and larger.


Bitcoin versus Gold

Bitcoin on its own is worth about 6 times the 56 million ounces of metal represented by all the contracts outstanding on the Comex 100-ounce gold contract.   

The world's biggest gold ETF, SPDR Gold Shares, holds about $72 billion of the yellow metal.  

Add in other forms of private investment gold and you've got about $2.87 trillion worth of metal -  but much of that is in the form of bars and coins that aren't easily liquidated when investors want to tweak their portfolios.


Turnover of digital coin derivatives 

Turnover of digital coin derivatives in the September quarter came to $2.7 trillion, according to Tokeninsight, a research company.  

That is not all that far behind the run rate of the world's biggest equity markets.    

The value of all shares traded in Japan in 2019 came to just $5.09 trillion, according to the World Federation of Exchanges, enough to make it the third-largest equity market on that basis.


Hedge Maze

Far from looking like a hedge against equity markets, the correlation between Bitcoin and the S&P is stronger than for many stock indexes.


Why would you choose to allocate a slice of your stock and bond holdings into a digital currency, instead of more conventional assets?

Once momentum stops driving the price higher, as it inevitably will, the best argument is still the hope that it might balance out the swings in your broader portfolio.  The prospect of Bitcoin becoming that sort of negative beta asset is the most promising way for it to become something more useful than a dice game for investors.

Unfortunately there is still little sign of that happening.  These days it looks not so much like a hedge against the gyrations of the equity market as a leveraged bet on the same movements.

  • The correlation between Bitcoin and the S&P 500 index was 0.767 over the past year - somewhat closer than the link between the S&P and the FTSE 100 index, and substantially tighter than that between U.S. and Hong Kong stocks.  
  • Gold's correlation with the S&P 500 was a far lower 0.299, while the Bloomberg Barclays U.S. Treasury index of total sovereign bond returns posted a prized negative beta of minus 0.036.

Crypto will only grow up if and when it finds a different driving force to the animal spirits that govern equity markets.  If it really wants to be an alternative asset to stocks and bonds, it needs to start behaving  like one.


https://www.bloomberg.com/opinion/articles/2021-01-04/bitcoin-price-surge-creates-a-different-scarcity-problem

January 4, 2021 by David Fickling

Bitcoin Price Surge Creates a Different Scarcity Problem - Bloomberg

Bitcoin’s Bulls Should Fear Its Other Scarcity Problem

As the value of this asset class rises, generating price spikes becomes increasingly difficult.


Saturday 19 December 2020

The main tool for fighting uncontrolled inflation: reduce the money supply

The main tool for fighting uncontrolled inflation is for the government and local monetary authorities to reduce the money supply.

Since most easily accessed money is in the form of bank deposits, the most efficient way for a central bank to control the money supply is by regulating 

  • bank lending and 
  • reserve requirements.

Essentially, when banks have more money to lend to customers, the economy grows  And when banks reduce their lending the economy slows.

The reason central bank monetary policy works so well is because of the multiplier effect.

Inflation versus Deflation

Inflation and hyperinflation

By the time the popular Venezuelan government called for next economic measures to end rampant hyperinflation at the end of 2018, the local currency had become virtually worthless.

After 80,000% inflation over the previous year, it took more than 6 million bolivars to buy a loaf of bread - that is, if you could find a store that had a loaf of bread in stock.

After more than a decade of economic mismanagement, the financial meltdown has become so bad that by the late 2010s, clean water distribution had slowed to a trickle, and gravely sick citizens were dying in make-shift hospitals, unable to get the treatments that were keeping people alive in almost every other country in the world.

It is nearly impossible to index prices and salaries in the chaotic world of hyperinflation, and consequently, no one is left untouched by uncontrolled inflation. 

  • From the top 1% to the poorest of the poor, an economy in crisis eventually hurts virtually everyone.  
  • But it's the most vulnerable who suffer the most.  When the cost of a loaf of bread exceeded the total monthly minimum salary in Venezuela, those at the bottom of the economic ladder had to face the worst aspect of economic hardship:  starvation.  Millions ended up fleeing across the border as economic refugees to Colombia and Brazil.

Hyperinflation has ravaged countries as diverse as Germany, Mexico and Argentina - even China during the Yuan dynasty, where too much paper money in circulation led to uncontrolled inflation.  In Germany's postwar Weimar Republic, in 1923, inflation became so bad that the government had to resort to issuing postage stamps worth fifty billion marks and people had to use wheel barrows to carry enough cash to make simple household purchases.


Deflation

The economic crisis in Japan at the beginning of the twenty-first century was marked by severe deflation, where a chronic decline in prices led to decades of sluggish economic growth.

When deflation was accompanied by a sharp decline in consumers - with the total population in Japan expected to decline precipitously by 2050 - the crisis in Japan appeared to be just as intractable as the inflationary crises in Venezuela and other parts of the world.  

  • In a country with persistent deflation, consumers will simply stop buying goods and services as prices decline expecting to get a better price at some point in the near future.  
  • Likewise, companies also tend to delay investments in new plants and machinery when they think prices for their products will soon decline.  
  • In deflationary environments, companies try to find ways to reduce input costs, often leading to a reduction in salaries.  The lower salaries then translate into even lower consumer spending, completing the vicious circle of deflationary economic crisis.


The solution is to change long term expectations

The problem with too much deflation, just like to much inflation, is that growth screeches to a halt because of the economic uncertainty both problems create.

In periods of crisis, however, central banks are often unable to change the perception in the minds of consumers and business-people that there will be no end to the vicious cycle of inexorably rising or declining prices.  

The solution for deflation, as for hyperinflation, essentially involves finding a way to change long-term expectations - not an easy task in an economy out of control.


Neither too hot nor too cold

Like the Three Bears' porridge, an economy should be neither too hot nor too cold.  

Neither acute inflation nor acute deflation are positive for sustainable economic health.

Despite the desire of some populist leaders to have a high inflation rate of 3 or even 4%, most economists recommend a "just right" inflation rate of about 2% per year.

Fighting excessive deflation once interest rates have been reduced to zero

Fighting excessive deflation is in some ways more difficult than fighting hyperinflation.

During inflationary times, there is basically no limit to how much central banks can raise interest rates.

But in the battle against deflation, once interest rates have been reduced to zero, there is little that central banks can do to stimulate further growth.  

The two things that can be done once interest rates reach zero are:

  • negative interest rates or 
  • quantitative easing.

Wednesday 16 December 2020

Measuring and Monitoring Overheating economy and Slowing economy

Interest rates and Money supply

Interest rates and money supply are the major tools the Fed and other central banks have traditionally used to control economic growth; the key is in how the tools are applied.

A country's economy is regulated by its money supply, which determines interest rates.  And each country's money supply is controlled by its central bank.  These quasi-public institutions are set up by governments but are then given the independence to keep an economy under control without undue interference from dabbling politicians.


How to measure and monitor growth and inflation in an economy?

Despite the tendency of the media to concentrate on the latest major economic statistic, such as GDP growth or unemployment, there is no one single indicator that tells us 

  • how fast an economy is growing or 
  • if that growth will lead to inflation down the road.

In addition, there is no way to know how quickly an economy will respond to changes in monetary policy.  

  • If a country's central bank allows the economy to expand too rapidly - by keeping too much money in circulation, for example - it may cause bubbles and rampant inflation.  
  • But if it slows down the economy too much, an economic recession can result, bringing financial turmoil and severe unemployment.  
  • When economic stagnation coincides with high inflation, sometimes referred to as stagflation, a worst-case scenario is created.

Central bankers, therefore, need to be prescient and extremely careful - keeping 

  • one eye on inflation, which is usually a product of an overheating economy, and 
  • one eye on unemployment, which is almost always the product of a slowing economy.

In the twenty first century, with the amount of capital flowing around the world dwarfing many countries' money supplies, it is almost impossible to know with certainty what the effect of any one monetary decision will have on a local economy, let alone on the world.


Fiscal policy or Massive deficit spending

Given the extremely low inflation rates in the 2010s, some have called for alternative methods for controlling economic growth.  Instead of using the central banks' authority to raise tor lower interest rates, referred to as "monetary policy," another solution would be to use "fiscal policy" to alter the money supply - essentially allowing governments to circumvent central banks by printing massive amounts of money to increase the money supply, for example.  

The use of a government's ability to issue new currency to influence economic growth, commonly referred to as Modern Monetary Theory (MMT), is not unproblematic in that inflation can come roaring back at a moment's notice.  

Many governments may misuse the power of MMT to pay for massive deficit spending in ways that lack the prudent guidance provided by the world's central banks.


Unforeseen and unpredictable events

Sometimes financial crises are caused by - and sometimes solved by forces -  entirely unconnected to the original problem.  

Most of the recent financial meltdowns, 

  • from the stock market crash of 1987, 
  • to the bursting of the dot-com bubble in 2000, 
  • to the market collapse following the terrorist attacks of September 11, 2001, 

were exacerbated by economic and sociopolitical forces well outside the control of any one country and greatly affected markets around the world.


Thursday 10 December 2020

The Real Inflation Threats

Inflation generally refers to the pace of increase in consumer prices.


1.  Historical inflation data

1970s

Consumer prices were rising at a double-digit pace and wreaking economic havoc all over the world.  

In early 1980s, they began to recede under pressure from rising global competition and a concerted attack by central banks.  

Raising interest rates to painful heights, central banks choked off money flows and won the war on inflation just about everywhere.


1981 to 1991

The average rate of inflation in developed nations fell from 12% to just 2%, where it remains today.

Meanwhile, in emerging nations, the average rate of inflation peaked at a staggering 87% in 1994 and reached the hyperinflationary triple digits in major countries like Brazil and Russia.  Then, over the subsequent decades, it receded to its current, much calmer rate of just 4%.


2.  Average inflation rates today

Any emerging nation with a rate of inflation much above 4% or any developed nation with a rate much above 2%, has cause for concern.  

In a world where double- and triple-digit consumer price inflation is a rare threat, the outliers are worth watching closely because they are out of balance and seriously at risk.


3.  Traditional thinking focuses on consumer price inflation only

High consumer price inflation is a growth-killing cancer

In the short term

  • rapidly rising prices compel central banks to raise interest rates
  • making it more expensive for businesses and consumers to borrow.  
  • High inflation also tends to be volatile, and its swings make it impossible for businesses to plan and invest for the future.

Over the longer term

  • inflation erodes the value of money sitting in the bank or in bonds, thus discouraging saving and 
  • shrinking the pool of money available to invest in future growth.


4.  Post crisis of 2008 slow-growth environment fears outright deflation

The central banks are now fighting a very different war.  

Central banks often worry that inflation may be too low, not too high in the slow-growth environment that took hold after the crisis of 2008.  

In developed countries, instead of raising rates to make sure inflation doesn't increase too far above a target of 2%, they now cut interest rates when inflation is falling too far below 2%.  

Their big fear is that low inflation will lead to outright deflation - the dreaded but overblown "Japan scenario."


5.  Low inflation and deflation can be bad (depressed demand) and can be good (driven by new innovation and expanding supply)

History, shows that neither low inflation nor deflation are necessarily bad for economic growth.


"Bad deflation"  

Japan suffered a rare bout of "bad deflation" after the collapse of its stock and housing bubbles in 1990.  

  • Consumer demand dried up, prices started to fall and shoppers began delaying purchases in the expectation that prices would fall further.  
  • The downward spiral depressed growth for two decades.  


"Good deflation"

However, deflation can also follow a new tech or financial innovation that 

  • lowers production costs and 
  • boosts economic growth.


High inflation is always bad for growth, deflation maybe neither bad nor good

If inflation is too high, it is almost always a threat to growth but the same cannot be said of low inflation.  

Even if low inflation threatens to devolve into deflation, it could be good for growth if the falling prices are driven by new innovations and expanding supply, rather than by depressed demand.


6.  Post 2008 low interest rates environment

After central banks won the war on high consumer price inflation, they cut interest rates to levels that have fueled a massive run-up in prices for 

  • financial assets, including stocks, bonds and 
  • houses.  
In recent decades, stock market and housing bubbles have been increasingly common precursors to financial crises and recessions.


7.  The Real Inflation Threats

Economists have been very slow to recognize this new inflation threat, and central banks have been very slow to think outside their official mandates, which focus on stabilizing the economy by controlling inflation in consumer prices, only.  

But successful nations will control both kinds of inflation, 

  • in consumer markets and 
  • in financial markets.


Conclusions

The general rule is that strong growth is most likely to continue 
  • if consumer prices are rising slowly or 
  • even if they are falling as the result of good deflation, driven by a strengthening supply network.

In today's globalised economy, cross-border competition tends to 
  • suppress prices for consumer goods but 
  • drive them up for financial assets (stocks, bonds and houses).  
Thus watching consumer prices is not enough.

Increasingly, recessions follow instability in the financial markets.  

To understand how inflation is likely to impact economic growth, you have to keep an eye on stock and house prices too.

Thursday 8 October 2020

Is Inflation Good for Stocks?


Conclusions:  

Back-tested data does not show any significant relationship between inflation rates and stock market returns.

Stock valuations may be negatively impacted by higher-than-normal inflation (due to increase in the risk-free rate which makes short-term Treasuries more attractive relative to equities).

Stocks may not be as good a "hedge" against inflation as the theoretical argument may suggest, this may be limited to SHORTER-TERM stock market movements.   

LONG-TERM investors in the stock market should take comfort in the fact that the S&P 500 has steadily outpaced inflation with an annualised real (inflation adjusted) return of 3% between 1871 and 2009.


Notes:

1.  Deflationary fears amidst weak economic growth have led to much liquidity being injected into the financial system by various central banks around the world.

2.  Motto:  "Deflation:  Making sure "it" doesn't happen here."

3.  Fundamentally, there appears to be a strong case for stocks to perform under inflationary conditions.  
  • When raw material costs rise, companies can raise selling prices and pass on the increased costs to the consumer.  The goods and services produced by companies make up the composition of the CPI, and it is not unreasonable to expect selling prices to rise in tandem with the CPI.
  • Also, companies hold real assets like property and land which can rise in nominal value over time.  Thus, investors in such companies should benefit over an inflationary period as the underlying assets increase in nominal value.

4.  The threats of deflation to economic prosperity are perhaps more obvious to investors who look to the beleaguered Japanese economy as a prime example.  
  • An economy where consumers postpone spending as items become cheaper in the future is certainly not an ideal one, especially for stock investors whose companies suffer from declining revenue and shrinking asset values.


Back-Testing the S&P 500

Monthly historical inflation and stock market returns

1.  Inflation in the US has historically been represented by year-on-year changes in the CPI and this is reported on a monthly basis.  

2.  We looked at monthly stock market returns based on the S&P 500 and compared the historical stock market returns to different levels of inflation.

3.  The majority of monthly historical inflation data was below 4%, with a surprisingly huge number of periods where inflation was negative (14.4%).

4.  Instead of the expected poor returns in periods of deflation, the S&P 500 actually averaged a 1.1% monthly return where the CPI posted year-on-year declines.

5.  The best average monthly return was logged in months where inflation was between 7% and 8%, but this accounted for only 18 of the 1150 months, less than 2% of the data tested.

6.  On the other hand, inflation rates higher than 8% saw negative average monthly returns.

7.  Inflation between 1% and 4%, more moderate levels of inflation, saw an average return of 0.8%.


Extension of the study to annual inflation and stock market returns.

1.  A large proportion (61%) of the annual inflation rates fell between 0 and 5%.

2.  There appeared to be little correlation between high/low inflation rates and stock market returns.

3.  The high or low inflation rates resulted in both positive and negative stock market returns.


Theoretical Benefits of Inflation May Not be Reflected in Stock Returns

This evidently does not show up in back-tested data for the S&P 500, where our results indicate a lack of any observable correlation.

Why? 

1.  Both company specific and industry-specific factors can play a huge role in determining the ability of a company to raise prices.

2.   The uniqueness of a company's product or its extent of substitutability can determine whether the company is able to raise prices without hurting demand.  If there are many substitutes available, the company may be forced to keep prices low to remain competitive.

3.  Companies whose business models depend on being low-cost producers will find it difficult to do well in an environment where raw material prices rise without a corresponding increase in selling prices.

4.  In certain highly regulated industries like the utilities or fixed-line telecommunications sector, regulatory authorities may prevent companies from raising selling prices, resulting in a price ceiling which caps profits.  

5.  Ultimately, a higher input cost which cannot be passed on to the tend consumer means lower profit margins and smaller profits.

6.  Recognizing the inflationary pressures faced by companies, it would appear that the benefits of inflation (rising asset prices, higher nominal revenue and profits) may take a significant period of time to occur.

7.  Industry consolidation and technology breakthroughs may also take place to counter the short-term negative impact of inflation, with surviving companies reaping the benefits while others go out of business.


Impact of inflation on valuations

1.  Inflation between 2% and 3% saw a wider range of valuations over the past nine decades (1950s, 1960s, 1990s and 2000s).

2.  Valuations of the 1920s and 1930s are perhaps less meaningful, as they encompass the Great Depression where unprecedented corporate bankruptcies could have skewed market earnings and thus valuations.

3.  More noteworthy are the decades with higher average inflation (1940s, 1970s and 1980s) were met with lower valuations.  How can this anomaly be explained by the impact of inflation on valuation metrics for the stock market?    

-  Periods of high inflation are generally met with interest rate hikes (as a means to subdue inflationary pressure), which make short-term treasuries more attractive relative to equities.  
-  Inflation normally results in an increase in the risk-free rate, which raises the required return on equities.  
-  The resulting impact on the stock market lowered valuations.