Keep INVESTING Simple and Safe (KISS) ****Investment Philosophy, Strategy and various Valuation Methods**** The same forces that bring risk into investing in the stock market also make possible the large gains many investors enjoy. It’s true that the fluctuations in the market make for losses as well as gains but if you have a proven strategy and stick with it over the long term you will be a winner!****Warren Buffett: Rule No. 1 - Never lose money. Rule No. 2 - Never forget Rule No. 1.
Sunday, 28 April 2024
What you look for in the financial statements of those great businesses with durable competitive advantage
Friday, 26 April 2024
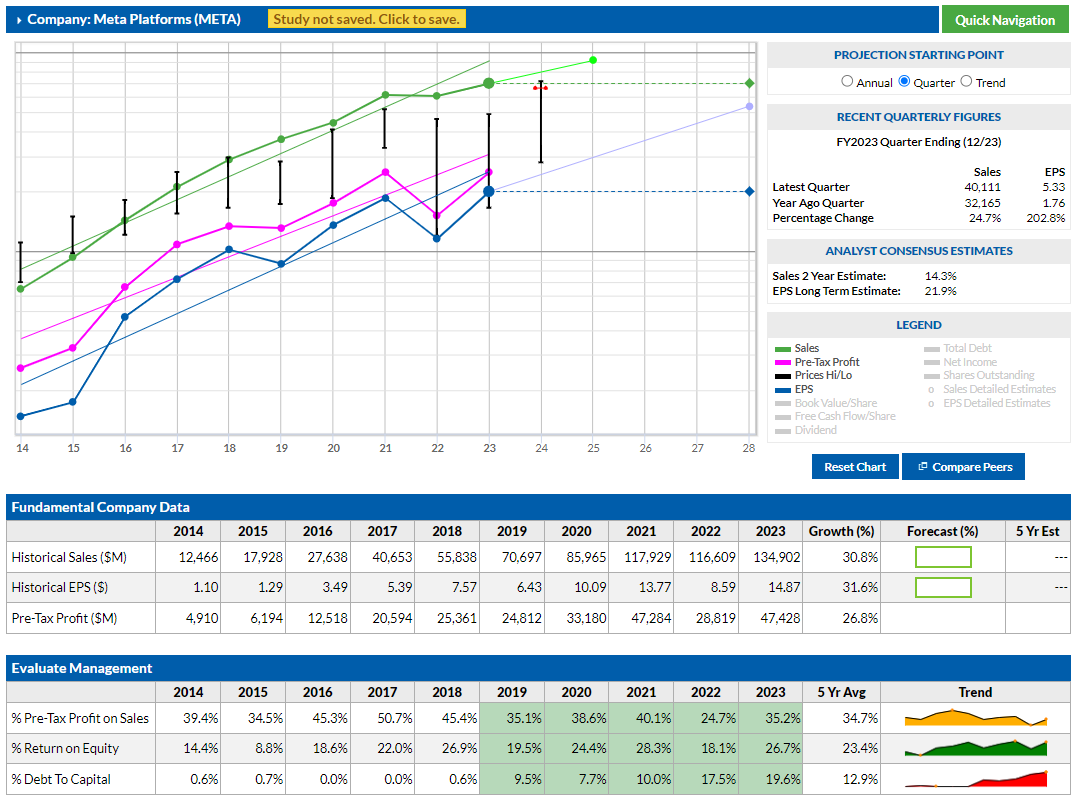
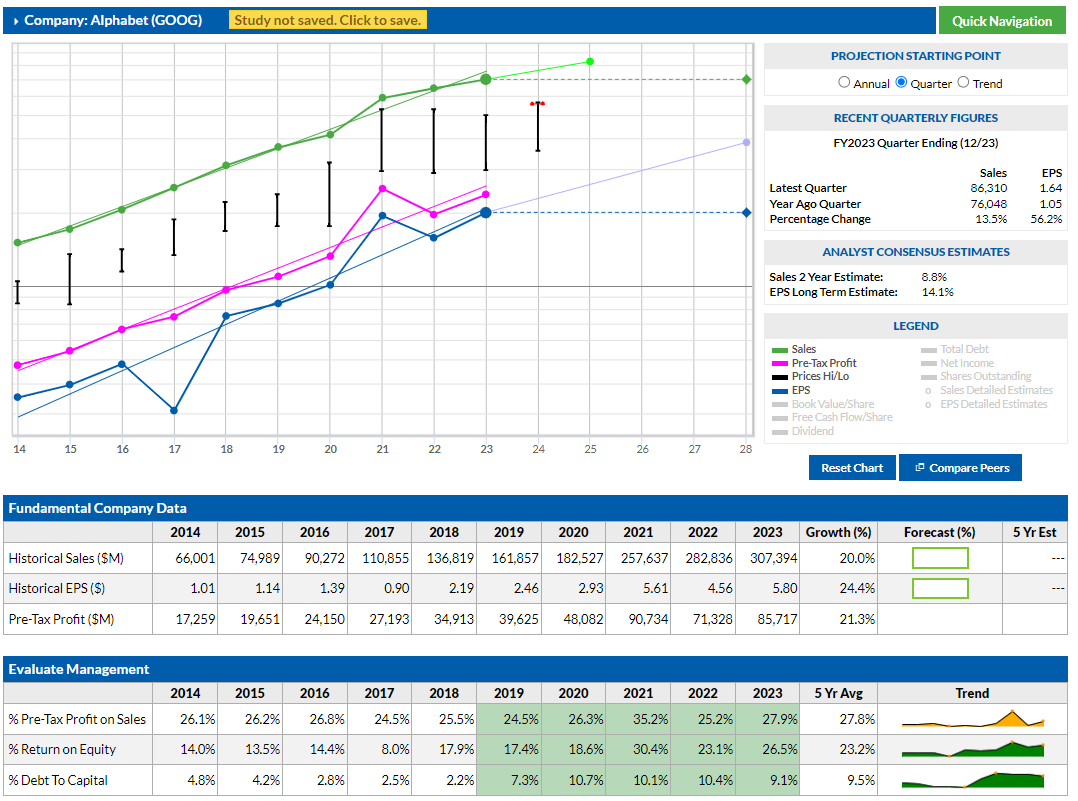
The Magnificent Seven stocks: Apple, Microsoft, Google parent Alphabet, Amazon, Nvidia, Meta Platforms and Tesla
Dubbed the Magnificent Seven stocks, Apple, Microsoft, Google parent
Thursday, 25 April 2024
Wednesday, 24 April 2024
Tuesday, 23 April 2024
Monday, 22 April 2024
Comparing Dutch Lady and Farm Fresh
Period 2019 to 2023
Revenue
Farm Fresh grew revenue from 164m to 636m.
Dutch Lady grew revenue from 1067m to 1443m
Net Earnings
Farm Fresh grew net earnings from 27.4m to 50.1m
Dutch Lady dropped its net earnings from 103m to 72m
Gross Margin
Farm Fresh's GPM for 2023 was 23.73% (average of last 5 Years GPM was 26.98%)
Dutch Lady's GPM for 2023 was 29.66% (average of last 5 Years GPM was 32.38%)
Net Profit Margin
Farm Fresh's NPM for 2023 was 7.95% (average of last 5 Years NPM was 11.05%)
Dutch Lady's NPM for 2023 was 4.99% (average of last 5 Years NPM was 9.32%)
ROE, ROA, P/B and P/E
Farm Fresh ROE 7.87% ROA 4.65% P/B 4.33 P/E 55.03
Dutch Lady ROE 16.47% ROA 7.60% P/B 4.81 P/E 29.19
Free Cash Flow
Farm Fresh FCF for 2023 was -174.6m
Dutch Lady FCF for 2023 was 14.3m
Market Capitalisation
Farm Fresh @1.48 per share Market Cap 2,755.6m
Dutch Lady @32.48 per share Market Cap 2,101.6m
Sunday, 21 April 2024
Detecting Frauds. When to Sell. Avoiding Value Traps.
How do you decide whether it is a value trap or not?
Value traps are statistically very cheap and very alluring.
First question to ask: “Why is God so kind on you that you are the only one who has this tremendous insight that this stock is cheap and all the other people who are very active, smart and intelligent in the market are ignoring this company?”
Is there an embedded growth optionality in the company? Can the company have a growth phase? Can the company come out with some new product offering which can introduce growth?
This is a dynamic exercise. You will need to revisit the hypothesis every now and again, at intervals.
Two characteristics of value traps are:
- (1) They typically don’t tend to grow more than the nominal GDP
- (2) They cannot reinvest their cash flow.
So the question you should ask is what is the catalyst which will change this and allow them to reinvest the capital which they are throwing off? In its absence, you have a classic example where the company had great cash flows and no catalyst.
Your sole focus of whether to participate in a seemingly value trap could be you calling out the catalyst that will catapult it out of this situation.


