Friday 13 November 2009

Valuation: What's it worth?

What's it worth?
Although there are several formulas you can use, there are no black-and-white answers on valuation techniques.

It’s important to conduct your own research, then get independent advice from a business valuer or broker. Here are four of the most commonly used valuation methods.

Method 1: Asset valuation
Method 2: Capitalised future earnings
Method 3: Earnings multiple
Method 4: Comparable sales

Method 1: Asset valuation
This approach determines the value of a business by adding up the value of its assets and subtracting liabilities. It tells you what the business would be worth if it were closed down today and its assets sold off, but it doesn’t take into account the ability of those assets to generate revenue in the future. For that reason, it may understate the true value of the business.

How it works

1.Add up the value of all the assets such as cash, stock, plant and equipment and receivables.
2.Add up liabilities, such as any bank debts and payments due.
3.Subtract the business’ liabilities from its assets to get the net asset value.


Example
Richard wants to buy a manufacturing business. Here’s an extract from the business’ balance sheet.


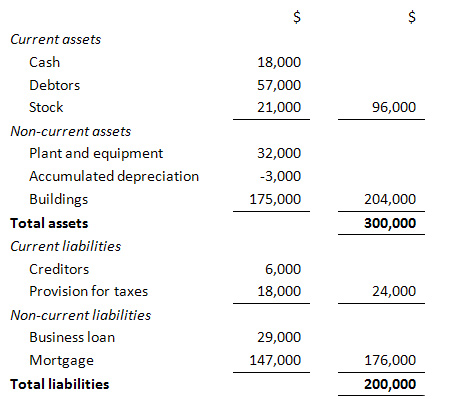
With assets of $300,000 and liabilities of $200,000, the net asset value of the business is $100,000.

What about goodwill?
This method doesn’t include a value for goodwill or the right to earn future profits, so it may understate the true value of a business. Goodwill is the difference between the true value of a business and the value of its net assets. It can be crucial to the value of retail and service-based businesses.

For example, when you are valuing a business such as a hairdressing salon, where the standard of service, location and reputation are important, the value of any goodwill would have to be added to net assets to get a valuation.

You need to consider whether goodwill can be transferred when you buy the business. While goodwill can come from physical features such as location, it can also arise from personal factors, such as the owner’s reputation or their relationships with customers or suppliers, which may not be transferable.

And if the business is underperforming and there is no goodwill attached to it, then using the net assets valuation method could be an accurate way of determining its value.


Method 2: Capitalised future earnings
When you buy a business, you’re not only buying its assets. You’re also buying the right to all of the profits that business might generate. Different valuation methods try to capture that.

Capitalising future earnings is the most common method used to value small businesses. The method looks at the rate of return on investment (ROI) that you can expect to get from the business.

How it works

1.Work out the average net profit of the business over the last three years using its profit-and-loss statements. You’ll need to adjust the profit for any one-off expenses or other irregular items each year.
2.Decide the annual rate of return that you’re looking for as a business owner (for example, 20%). There are no hard and fast rules about what number you should choose, except that the higher the risk, the higher your return should be. A good starting point is to compare the business with other investment opportunities — everything from safe havens like term deposits, to riskier investments like shares. You can also look at the rate of return that similar businesses in the same industry achieve.
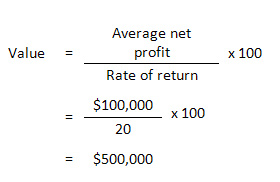
3.Divide net profits by the rate of return to determine the value of the business, then multiply by 100.


Example
David is looking at buying a bakery business with average net profits of $100,000 per annum after adjustments. David wants an annual rate of return of 20%. The capitalised earnings valuation is:


Method 3: Earnings multiple
If you invest in shares, you might already be familiar with this method, since it’s often used to assess the value of companies whose shares are traded on a stock exchange and therefore reflect market expectations. But it can be used to value unlisted businesses.

Its big advantage is its simplicity. The difficulty lies in deciding which multiple to use.

How it works
Simply multiply the business’ earnings before interest and tax (EBIT) by your selected multiple. For example, you might value the business at twice its annual earnings — so a business with an EBIT of $200,000 might be valued at $400,000.

The multiple you choose will depend on the industry and the growth potential of the business. A service-based business might be valued at as little as one year’s earnings, while an established business with sustainable profits might sell for as much as six times earnings. (Listed companies trade at much higher multiples, because their size and liquidity makes them less risky investments.)

This method can be useful for valuing a business where there are regular sales of similar businesses to help you determine an objective earnings multiple. A business broker should be able to tell you this.


Method 4: Comparable sales
Whatever other valuation method you use, you should also look at prices for recent sales of similar businesses. Like buying a house, it makes sense to know what is happening in the market in which you’re interested.

Speak to a few business brokers and gauge their feeling about the business’ value. They might know what similar operations are selling for and how the market is placed at that particular time. Check business-for-sale listings in relevant industry magazines, newspapers or websites.


Tools and templates

Buying a business checklist

Important information
As this advice has been prepared without considering your objectives, financial situation or needs, you should, before acting on the advice, consider its appropriateness to your circumstances. All products mentioned on this web page are issued by the Commonwealth Bank of Australia; view our Financial Services Guide (PDF 59kb).

http://www.commbank.com.au/business/betterbusiness/buying-a-business/whats-it-worth/

Low Multiples

Another interesting way to assess PE of individual stocks, relative to their respective industry and country multiples

Low Multiples
04.08.09, 06:00 PM EDT
Forbes Magazine dated April 27, 2009

These stocks have estimated 2009 price-to-earnings multiples below their respective industry and country multiples. One example: Bombardier of Canada, which makes jets and railroad locomotives and coaches, trades at an estimated 2009 P/E of 6, versus 15 for all aerospace stocks and 13 for Canadian stocks.


http://www.forbes.com/forbes/2009/0427/152-global-2000-companies-cheap-and-cash-rich.html

The world's richest men say go buy stocks, global economic panic is over

Updated: Friday November 13, 2009 MYT 7:48:41 AM
The world's richest men say go buy stocks, global economic panic is over


Buy attractive stocks, they say


NEW YORK: Capitalism is still alive and well, say the world's two richest men, despite lingering shocks from the longest, deepest recession since the Great Depression.

"The financial panic is behind us," said famed investor Warren Buffett, who recently made what he called an "all-in wager" on the U.S. economy by acquiring railroad Burlington Northern Santa Fe.

"The bottom has come in stocks. Don't pass on something that's attractive today."

Sitting facing each other in an auditorium filled with nearly 1,000 cheering people at Columbia University in New York, the CEO of Berkshire Hathaway Inc. and Microsoft founder Bill Gates fielded questions from Columbia Business School students on the recession, investing and what's the next Microsoft.

There were at first reassurances that the U.S. economy had not collapsed since the last time the two sat in front of a student audience, in Nebraska in 2005.

"We proved that we can make mistakes," said Gates.

"But the fundamentals of the system, a marketplace-driven system where we invest in education and a great infrastructure for the long-term, that's continued."

Even in the country's "darkest hour," he said, American businesses were still innovating.

"Last fall was really blindsiding," Buffett said later.

Still, "I did not worry about the overall survival of our economy."

The worst recession since the 1930s may be over, but the recovery isn't expected to be strong enough to stem job losses and get businesses hiring again.

Employers shed a net total of 190,000 jobs in October, a government survey showed Thursday.

It was the 22nd straight month of losses.

And the unemployment rate jumped last month to 10.2 percent, a 26-year high.

Buffett also commended the Bush administration's actions last September, saying "only the government could have saved things" after the collapse of Lehman Brothers triggered a freeze-up in credit markets and panic on Wall Street.

In the future, however, Buffett said "there should be more downside to the head of any institution that has to go to the federal government to be saved for reasons of the greater society. And so far, we have been better at carrots and sticks in rewarding CEOs at the top. But I think some more sticks are called for."

The two endeared themselves to the audience with tips.

Buffett exhorted students to "marry the right person" and said, "The worst investment you can have is cash."

Gates, meanwhile, said he sees big opportunities in environmentally friendly energy and medicine.

"Capitalism is great," he said.

Gates wore a suit and tie, flashing the inner red lining of his jacket as he walked to his chair. Buffett, who earned a master's degree from Columbia in 1951, wore a sweater with the Columbia insignia.

Students in the audience said they were glad the two were so confident about the economy.

"That probably weighs a lot to a lot of people to hear Buffett say we're out of the crisis," said Andrea Basche, an Earth Institute student at Columbia. - AP

PLANTATION sector


Pile in as stocks pile up

Tags: Astra Agro | Brokers Call | CIMB Research | CPO | Golden Agri | Indofood Agri | Plantation | Sampoerna Agro | Sime Darby | Wilmar

Written by Financial Daily
Thursday, 12 November 2009 10:46

PLANTATION []s sector
Neutral: Malaysia’s palm oil stock figures for end-October 2009 were above both our and market estimates, which is slightly negative for the sector. However, we are keeping our 2009 crude palm oil (CPO) price forecast of RM2,240 per tonne, which is only a tad higher than the RM2,221 average achieved in 9M09. If this news of a rising stockpile triggers a correction of CPO price and planters’ share prices, investors should snap up the opportunity to accumulate selected plantation stocks ahead of a likely recovery of CPO price, potentially in 1Q10.

We remain neutral on the Malaysian plantation sector and continue to prefer the Singapore planters for their more appealing valuations. Our picks in the region remain Wilmar, Sime Darby, Indofood Agri, Golden Agri, Astra Agro and Sampoerna Agro.

Higher imports and output pushed Malaysia’s palm oil stocks to a 10-month high of 1.97 million tonnes at end-Oct, above market expectations of 1.82 million tonnes and our forecast of 1.72 million tonnes. The discrepancy came largely from a 27.5% month-on-month (m-o-m) uptick in production. We believe the key variances were higher production and imports. These statistics are negative as the rise in inventories will limit CPO price upside in the medium term.

Palm oil stocks are projected to rise further and potentially peak in November. We now estimate that Malaysia’s CPO stock level could increase 3% m-o-m to around 2.03 million tonnes in November, which we think could be the peak instead of our initial expectation of a peak of 1.9 million tonnes. This stems from the unexpected surge in production in October which may not be sustainable as we suspect some harvesting was carried over from the previous month.

Assuming steady crude oil prices, we continue to expect CPO prices to trade within a range of RM2,100 to RM2,300 per tonne in the short term. Despite the higher-than-expected palm oil stockpile, we are sticking to our view that CPO price could rally in 1Q 2010 as demand is expected to pick up, driven by the Chinese New Year festivities, the global economic recovery, lower domestic oilseed crops for India and higher biofuel mandates.

Although stocks appear to be closing in on last year’s record level, the outlook for demand is brighter than a year ago as global economies are on the mend and some governments have set or increased their biodiesel mandates. Also, the higher crude oil price of US$79 (RM267.02) per barrel compared to the year-ago level of US$60 may boost conversion to biodiesel. — CIMB Research, Nov 11


This article appeared in The Edge Financial Daily, November 12, 2009.

http://www.theedgemalaysia.com/business-news/153471-pile-in-as-stocks-pile-up.html

Top pick in banking sector


Adventa surges on CIMB upgrade

Adventa surges on CIMB upgrade

Tags: Adventa | CIMB | Top Glove | Upgrade

Written by Joseph Chin
Thursday, 12 November 2009 10:38

KUALA LUMPUR: Shares of Adventa surged in early trade on Thursday, Nov 12 after CIMB Equities Research initiated coverage on the glove maker with an Outperform and a target price of RM4.12.

At 10.25am, it was up 17 sen to RM2.12 with 1.58 million shares done.

The research house said the prognosis for the medical glove industry is favourable given rising healthcare needs and greater awareness of the need for hygiene, especially with the rising incidence of health scares.

"Adventa is in a great position to tap into this growth as well as the growth arising from ageing populations around the world and more demand for elective surgery," it said.

CIMB Research said due to the company's smaller size relative to its biggest rival Top Glove, it pegged it to a 30% discount to its target market price-to-earnings of 15 times.

"This gives us an end-CY10 target price of RM4.12, which implies share price upside of 111%. We begin our coverage with an OUTPERFORM recommendation, premised on the potential share price trigger of improving quarterly earnings driven by its surgical glove and OBM segment as well as its ongoing expansion," it said.

http://www.theedgemalaysia.com/business-news/153469-adventa-surges-on-cimb-upgrade.html


Comment:  What gives?  Perception.

Hong Leong Bank posts 1Q net profit of RM234.2 million

Hong Leong Bank posts 1Q net profit of RM234.2 million

Tags: Hong Leong Bank

Written by Joseph Chin
Wednesday, 11 November 2009 21:13

KUALA LUMPUR: HONG LEONG BANK BHD [] posted a net profit of RM234.21 million for its first quarter ended Sept 30, a slight decline of 3.2% from RM242.04 million a year ago.

Announcing its earnings on Wednesday, Nov 11, it said revenue was 7% lower at RM511.67 million from RM550.13 million. Earnings per share were 16.2 sen versus 16.7 sen.

Bank of Chengdu Co Ltd, in which Hong Leong owns a 20% stake, contributed RM31 million to the 1Q profit.

The performance showed an improvement from the fourth quarter ended 30 June,2009, with net profit up 18% to RM234 million.

Hong Leong Bank said returns on average shareholder funds remained resilient at 15.9% on an annualised basis.

"Total net income increased 3.7% q-o-q to RM512 million. Net interest income increased 9.8% q-o-qr to RM335 million. Non-interest income increased by 0.05% q-o-q to RM129 million. Cost-to-income ratio was 41.1% for 1QFY10 . Total assets were RM77 billion. Gross loans grew by 0.4% y-o-y to RM36 billion," it added.

http://www.theedgemalaysia.com/business-news/153455-hong-leong-bank-posts-1q-net-profit-of-rm2342-million.html

Warren Buffett: Financial panic is over

Warren Buffett: Financial panic is over
Written by Reuters
Friday, 13 November 2009 07:55

NEW YORK: Warren Buffett, perhaps the world's most admired investor, said on Thursday, Nov 12 the financial panic that gripped the globe last year is a thing of the past, even as the U.S. economy's struggles persist, according to Reuters.

"The financial panic is behind us," the world's second-richest person said at Columbia University's business school. "Our economy was sputtering, still is sputtering some."

Buffett, 79, nevertheless said there is greater opportunity for investments inside the United States than outside, noting that the U.S. economy is far larger than any other.

He appeared at Columbia with Microsoft Corp (MSFT.O) founder Bill Gates, the world's richest person and a Buffett friend and bridge partner.

Last month, preliminary government data showed the U.S. economy expanded in the third quarter, the first three-month period of growth since the second quarter of 2008.

Nonetheless, the U.S. unemployment rate last month reached 10.2 percent, the first double-digit reading in 26 years.

Buffett last week made a big bet on the U.S. economy when his Berkshire Hathaway Inc (BRKa.N) (BRKb.N) agreed to pay about $26.4 billion for the 77 percent of railroad company Burlington Northern Santa Fe Corp (BNI.N) that it did not already own.

"There will be more people in this country, 10, 20, 30 years from now," Buffett said. "They'll be moving more and more goods back and forth to each other and the most environmentally friendly and cost-efficient way of doing that is railroads."

Buffett said rail transport uses one-third less fuel and pollutes the air less than trucks, and that one train can supplant about 280 trucks.

Gates, who is also a Berkshire director, said other sectors might also boost the economy over the long term, including information TECHNOLOGY [], energy and medicine.

Separately, Buffett advised the U.S. government not to coddle companies that need bailouts to survive or preserve capital.

"More sticks are called for," he said.

Buffett gave Federal Reserve Chairman Ben Bernanke and U.S. Treasury Secretary Timothy Geithner "high marks" for how they managed the financial crisis.

The billionaire has praised Bernanke in the past, while mocking Geithner's stress tests for banks.

CNBC television was a host for the Columbia event. - Reuters

High-income goal needs ‘reality check’

High-income goal needs ‘reality check’

Tags: 10MP | Developed high-income nation | GDP growth | High income goals | Kenanga Research | Per capita income | reality check | Wan Suhaimie Wan Mohd Saidie | World Bank

Written by Financial Daily
Thursday, 12 November 2009 11:00

KUALA LUMPUR: The country’s high-income goals needs a reality check and it would be a very challenging task to become a developed, high-income nation by 2020, said Kenanga Research.

“It’s a deceiving notion to believe that in order for Malaysia to achieve a developed nation status, its GDP needs to grow by only an average of 6% till 2020.

“For one, our average GDP growth needs to consistently expand by at least 8% annually to meet the current World Bank’s minimum classification to achieve a high-income nation [per capita income of US$17,000 or RM57,460],” the research house said in a report yesterday.

This was assuming that Malaysia’s population would grow at an average of 2.1% annually and the ringgit appreciated at a steady rate of 5% per annum against the US dollar, the research house said.

It added that this was a simplistic assumption, which does not take into account the rapid changes in global trade and TECHNOLOGY [] as well as the gradual socio-politico shift domestically and abroad.

“Plus, the World Bank’s minimum requirement may be adjusted even higher over time, not to mention the possibility of a devaluing US currency,” it said.

Economists said the success of the private-sector-led growth under the 10th Malaysia Plan (10MP) would be viewed in totality against the backdrop of a challenging global economic backdrop.

They said existing weaknesses in the US economy, the world’s largest, would still be a key factor in dictating Malaysia’s economic fortunes going forward. This is despite the rise of China as a major source of demand for local exports.

“Though China’s economic influence is catching up and growing steadily, it may not be sufficient to offset any demand shortfall in the advanced economies. At this juncture, a more realistic long-term growth trend for Malaysia would be between 4% and 5%,” economist Wan Suhaimie Wan Mohd Saidie wrote in the Kenanga report.

He said unless Malaysia took a more aggressive stance to stem human-capital loss and sluggish private-sector investments, it would be difficult for the country to rise above its minimum growth potential of 6%. “It’s going to be tough,” he said.

The 10MP is deemed crucial because the five-year plan from 2011 till 2015, is the second last blueprint before the 11MP from 2016 to 2020, in facilitating the nation’s goal of achieving developed-nation status by 2020.

Hence, policymakers have decided to table the 10MP earlier in June 2010, six months ahead of the initial year for the national initiative. Previous plans were usually tabled during the first year of their implementation.

A key theme is competitive private-sector-led growth to spur the country’s economic fortunes while the government functions as an effective facilitator.

As such, private-investment growth is expected to increase by 10.5% a year, surpassing public investment expansion of 0.7% during the five-year plan, translating into an annual real gross domestic product (GDP) growth of 5.5% during the 10MP compared with the projected 3.2% growth under the 9MP.

Policymakers have identified the services, manufacturing, and agriculture sectors as main growth drivers under the 10MP.

In a note yesterday, CIMB Investment Bank Bhd head of economics Lee Heng Guie said, while global dynamics were not within the country’s control, policymakers had to ensure that domestic resources were optimally utilised via the better management of government funds.

“The execution risk and leakage have to be brought down to the lowest possible point to ensure the resources are optimally allocated.

“Fiscal resources should be deployed for socio-economic development, education, human-capital formation as well as to promote a sustainable eco-friendly environment,” Lee said.

Meanwhile, Kenanga Research also said it would not be a surprise if the goods and services tax (GST) were to be announced as part of the 10MP.

It said the gradual reduction and realignment of both personal income tax and corporate tax rates was a step closer towards converting Malaysia’s current tax regime to the GST system, which had been postponed indefinitely since it was first announced in the 2005 budget.

Kenanga Research said the broader tax base was expected to be able to increase the government’s coffers and would likely more than compensate the shortfall in corporate and individual tax collections.

“Singapore and Australia are role models of successful GST regimes and they are less prone to declining income during an economic downturn,” it said.


This article appeared in The Edge Financial Daily, Nov 12, 2009.

Glove makers take the lead

Glove makers take the lead

Tags: Adventa | Kossan | Supermax

Written by Joseph Chin
Thursday, 12 November 2009 16:31

KUALA LUMPUR: Glove manufacturers again saw renewed interest in late afternoon trade on Thursday, Nov 12, supported by analysts' positive outlook for the sector.

Adventa was up 29 sen to RM2.24 with 5.52 million shares done at 4.19pm after CIMB Equities Research initiated coverage on the glove maker with an "outperform" rating and a target price of RM4.12.

Supermax added 19 sen to RM3.83 with 6.54 million shares done while Kossan was up 15 sen to RM5.27.

http://www.theedgemalaysia.com/business-news/153518-glove-makers-take-the-lead.html

F&N to pass on higher cost if sugar prices go up

F&N to pass on higher cost if sugar prices go up
By Jeeva ArulampalamPublished: 2009/11/11

FRASER & Neave Holdings Bhd (F&N) (3689) will increase the prices of its food and beverage (F&B) products should the government decide to remove the sugar subsidy locally.


F&N chief executive officer Tan Ang Meng said that the cost of higher sugar prices will have to be passed on to consumers as F&B producers will not be able to absorb the cost impact.

"Whatever you eat or drink, like the prices of roti canai or teh tarik, will go up," Tan said at F&N's financial year 2008/09 results briefing in KL yesterday.

Although the quantum of the price increase for F&N products will depend on the hike in sugar prices, it will take less than a month for the cost to be factored into the F&B products.

"So the government has to balance between how much (sugar subsidy) they plan to withdraw and its subsequent impact on inflation," said Tan.

The government is said to be spending some RM720 million on sugar subsidy this year.

For its financial year ended September 30 2009, F&N saw its net profit increase 35 per cent to RM224.4 million while revenue grew 2 per cent to RM3.74 billion.

Despite the deep regional economic recession, the group posted higher revenue driven by strong volume growths for its soft drinks, mainly the 100Plus and Seasons brands.

Tan said that the dairies division operating profit improved by 59 per cent over the last year to RM140 million and is now on par with the soft drinks as a key contributor to the group's profits.

The group is planning a bonus dividend of 5 sen per share on top of a final dividend of 24 sen. This will make its total net dividend for the year at 41.75 sen.

Meanwhile, F&N will look to launch 50 new products, including tea, coffee and energy drinks, within the next two to three years, once its "exclusivity clause" with Coca-Cola expires on January 26 2010.

The new products will help cushion the loss of revenue once F&N stops selling Coca-Cola from September 2011, which accounted for 33 per cent of F&N's total soft drinks volume for the financial year just ended.

http://www.btimes.com.my/Current_News/BTIMES/articles/jfn10/Article/

Wilmar delays China IPO, to invest in Africa

Wilmar delays China IPO, to invest in Africa
Published: 2009/11/13

SINGAPORE: Wilmar International, the world's largest listed palm oil firm, signalled a promising outlook for its earnings but said the US$3.5 billion (US$1 = RM3.38) listing of its China unit is on hold due to its concern over valuations.

The palm oil giant's listing plan was the recent trigger for a rally in its shares, which retreated yesterday despite a quarterly profit that beat expectations.

"We will shelve it for the time being and wait for market conditions to improve," Wilmar's chairman and CEO Kuok Khoon Hong said after a media and analysts' briefing for its third-quarter results.

"We only will list the China operation if it commands better price than what Wilmar is commanding right now in the stock market," he added.

Analysts have estimated that Wilmar's China unit could be valued as by much as 20 times earnings, matching the parent company's current price-to-earnings multiple.

With more than 30 firms eyeing listings in either Hong Kong or India over the next few months, leading to more than US$10 billion in share sales, companies wanting to list have had to keep their hopes for high prices in check.

Analysts have said Wilmar, which has a market value of US$30 billion, has no immediate need for funds.

The company said it was optimistic about prospects for the rest of this year after a one-off gain helped it post a better-than-expected 35 per cent rise in its third quarter profit.

Analysts were less impressed. "Excluding exceptional and one-off items, Wilmar's operating performance in its third quarter 2009 was not as strong as we would expect from normal seasonality," Goldman Sachs analyst Patrick Tiah said in a research note.

"Notwithstanding, given the market's low expectations we believe consensus earnings could rise following the results," he added.

Wilmar's Kuok said the company plans to invest at least US$1 billion in China, Indonesia and Africa to expand its plantations and plants.

The company has raised profits in the last few quarters thanks to its processing and refining capabilities, outperforming rival palm oil firms that depend primarily on plantations.

Wilmar's shares have more than doubled this year, but some analysts cut their ratings after the company delayed plans in late September to float its China unit due to volatile markets.

The listing would have raised around US$3.5 billion.

CEO Kuok said earlier in a statement that he was optimistic about the firm's prospects for the rest of the financial year given the diversity of its business segments.

Wilmar, derives about half of its total sales from China, and owns oil palm plantations and runs crushing and refining plants in Indonesia and Malaysia.

The company, the second-largest on the Singapore Exchange after Singapore Telecommunications, earned US$653 million in July-September, up from US $483 million a year ago. - Reuters

Green Packet - behind the headline figures

Green Packet sets ambitious profit target
By Goh Thean EuPublished: 2009/09/24

GREEN Packet Bhd (0082), a telecommunications and broadband service provider, has set a net profit target of RM1 billion for 2013, driven by a maturing broadband and solutions business.

The company posted a net loss of RM54.98 million for the financial year ended December 31 2008.

"It's an ambitious goal. That's why we are really working hard on that. We believe both our business pillars of solutions and service provider will grow. By then, we will have more than one million subscribers on broadband space," group managing director Puan Chan Cheong told Business Times in an interview.

The company expects to sign up 200,000 subscribers by year-end, from 35,000 in the first quarter of 2009.
"By end of the third quarter, we should have more than 100,000 subscribers. We believe that we can sign up over 30,000 subscribers per month for the final quarter," he said.

Green Packet expects revenue to increase more than threefold to RM300 million this year, from RM88.43 million in 2008.

"Our first-half 2009 revenue was already 11 per cent more than what we had in the entire 2008. We expect the momentum growth to be bigger in the second half and we believe we can comfortably achieve RM300 million this year and RM1 billion two years later," he said.

The company offers broadband services to homes and offices using the WiMAX (Worldwide Interoperability for Microwave Access) technology.

To achieve its subscriber target, the company would need to expand its broadband coverage area, so that more people will have the opportunity to subscribe it.

"In terms of sites, we are also on track to hit 700 sites, or 2,100 base stations by year-end," he said.

Over the next two years, the company will be aggressively expanding its coverage and acquiring broadband customers. When its subscriber base hits the critical mass, it is expected to launch its new service - mobile voice.

"We are looking to launch mobile voice service in 2011. We can do it by ourselves, but initially, we will be looking at domestic roaming. On areas we don't have coverage, then we will fall back to existing operator's network," said Puan, who expects to sign up more than two million mobile voice customers by 2013.

It also develops WiMAX customer-premises equipment (CPE), such as the WiMAX modems. For the first half, it has delivered over 150,000 WiMAX CPEs to 35 operators worldwide.

"The estimation for WiMAX product shipment world is going to be about 1.6 million to 1.7 million this year. We aim to capture 20 per cent of the world's market shipment, or to ship some 350,000 units of CPEs this year," he said.

Besides developing CPEs and offering broadband services, it also develops telecommunications software - such as its InTouch connection management software - for operators.

The InTouch connection management solution, allows the user to integrate multiple wireless network.

Developing the solutions pillar is critical for Green Packet's bottomline growth, as it commands higher margins than some of its other businesses and it helps the company to strike a balance.

"Moving forward, we see half of our revenue coming from our service provider (WiMAX broadband) business and the other half from solutions.

"In terms of topline for our solution business, 30 per cent will come from software and 70 per cent will come from CPEs. However, for bottomline, software will contribute 50 per cent of the profit for the solution business," he said

http://www.btimes.com.my/Current_News/BTIMES/articles/gpkt21/Article/index_html


----

Green Packet: RM500m more needed to widen 4G coverage
By Zuraimi AbdullahPublished: 2009/11/13


GREEN Packet Bhd (0082), which announced its third quarter results yesterday, will need up to RM500 million in capital expenditure (capex) in the next 12-18 months to increase its 4G Wimax coverage nationwide to 65 per cent.

This does not include a RM155 million capex it plans to spend first over the next three quarters to raise the high-speed broadband service coverage to 45 per cent.

Green Packet managing director C.C. Puan said it had so far invested RM337 million to roll out the 4G service.

The company's 4G service, known as P1 and run by subsidiary Packet One Networks (Malaysia) Sdn Bhd, now covers 25 per cent of the peninsular.
Puan said about RM400 million of the RM500 million capex would be raised from vendor financing and borrowings.

The remaining RM100 million should come from equity and convertible debts, he told reporters at a briefing on Green Packet's interim results in Petaling Jaya yesterday.

The company has group cash and cash equivalents of RM174 million as of end-September. With another RM65 million from bank and vendor facilities, it has total funding of RM239 million, more than the RM155 million required for the next nine months.

Meanwhile, Green Packet's revenue for the third quarter to September 30 this year rose 11.5 per cent to RM63 million from RM56.5 million in the preceeding quarter.

But it made a net loss of RM32.9 million mainly due to the investments in P1's deployment and activities.

A turnaround is possible starting from the middle of next year as he said P1 should break even in the first quarter on 2010, which could push Green Packet into the black as early as first half of next year.

Green Packet's 4G subscribers have increased to 100,000 in 14 months and the company plans to double it to 200,000 in the next two months.

The company plans to extend its 4G service to Sabah, Sarawak and Singapore and increase exports of its 4G devices by several fold next year, Puan said.

http://www.btimes.com.my/Current_News/BTIMES/articles/ket/Article/index_html


----


Green Packet suffers bigger loss
Published: 2009/11/12

Green Packet Bhd's pre-tax loss for its third quarter ended Sept 30, 2009, rose by 200 per cent to RM32.377 million from RM10.784 million in the same quarter last year.

This was due to its investment in subsidiary Packet One Networks (M) Sdn Bhd (P1)'s deployment plan and activities, Green Packet said in a statement today.

However, its revenue increased by 246.9 per cent during the third quarter to RM63.035 million from RM18.172 previously.

Green Packet said P1's subscriber growth increased by 44 per cent in the third quarter as compared to the second quarter.

"In line with the group's business strategy, we are investing heavily in our 4G WiMAX operator, P1, which is rapidly expanding across Malaysia and gaining momentum in terms of subscribers," said Green Packet's group managing director and chief executive officer Puan Chan Cheong.

Puan said Green Packet's advertising and promotion activities had increased substantially, with the company moving to mainstream broadcast media to introduce its service packages to the masses.

"The quantum of subscriber increase is exciting, and we target for P1 to be EBITDA (earnings before interest, taxes, depreciation, and amortisation) breakeven by first quarter 2010," he said.

P1, now the only nationwide 4G WiMAX operator in the country, plans to extend its network to East Malaysia and Singapore next year.

Green Packet said it has healthy cash reserves, having recently conducted a rights issue and announced a proposed private placement expected to be completed by the end of this financial year.

The proposed private placement is expected to contribute positively to the group's future earnings and should result in an increase in the company's total issued and paid-up share capital.

"Our fund raising is part of our business strategy, which requires working capital for capital expenditure and operating expenses, including the deployment of 4G WiMAX infrastructure in Malaysia and other overseas markets," Puan said.

Green Packet said its products and solutions have increased their shipments in recent months and were profitable since the second quarter.

The group is also expected to announce contracts with East European and American operators, and launch new products before the year-end. -- Bernama

http://www.btimes.com.my/Current_News/BTIMES/articles/20091112211908/Article/index_html

Media Prima revises upwards offer for NSTP

Media Prima revises upwards offer for NSTP
Published: 2009/11/13

Media Prima says it proposes to increase the offer price of each NSTP share to RM2.40 from RM2 previously offered.


Media Prima Bhd (MPB) (4502) yesterday revised upwards its takeover offer for The New Straits Times Press (M) Bhd (NSTP).

MPB, which holds a 43 per cent interest in NSTP's equity, wants to buy all shares not owned by it in the newspaper company and later take it private. The takeover will be done through a share exchange.

Through CIMB Investment Bank Bhd yesterday, MPB announced its proposal to increase the offer price of each NSTP share to RM2.40 from RM2 previously offered.


Consequently, it proposed to revise the exchange ratio to six new MPB shares for every five offer shares accepted and one new MPB warrant free for every five offer shares accepted.
(6 new MPB share + 1 new MPB free warrant = 5 NSTP shares)

In its earlier offer, MPB offered an exchange ratio of one new MPB share for every one offer share and one new MPB warrant for every five offer shares.
(5 new MPB share + 1 new MPB warrant = 5 NSTP share)

MPB said its board thinks the higher exchange ratio is justified to improve attractiveness of the offer while not detrimental to interest of its existing shareholders. It said the revision was done after considering views of various stakeholders of NSTP and the prevailing market sentiment.

"The revised offer is attractive and fair as the revised exchange ratio represents a 10 per cent premium over the average market price of NSTP shares for the last month and a 33 per cent premium over the average market price in the same period based on absolute price.

"This revised offer reinforces MPB's belief of the greater benefits to be gained and synergies that can be crystallised by the enlarged group post completion of the transaction," MPB's group managing director Datuk Amrin Awaluddin said.

Separately, NSTP yesterday declared a special tax-exempt special dividend of 40 sen for every share held as at November 26 2009.

"We view positively NSTP's declaration of the special dividend as it is consistent with MPB's practice of returning excess capital to its shareholders.

"Our intention of returning the entire proceeds from the special dividend received from NSTP reiterates our commitment to continually enhance our shareholders' returns on their investment in the group," Amrin added.

The announcement will see NSTP paying out some RM86.9 million in dividends to shareholders. Its board said that the company has a substantial amount of retained earnings which can be rewarded to shareholders.

MPB said as an existing shareholder, it will be entitled to its portion of the special dividend amounting to around RM37.6 million.

It added that it intends to distribute to its own shareholders the entire amount of NSTP special dividend it will receive but said NSTP shareholders who accept its revised offer will not be entitled to the MPB special dividend.

NSTP shareholders who have accepted the original offer on November 5 2009 will however be entitled to receive the revised offer and also the NSTP special dividend.

http://www.btimes.com.my/Current_News/BTIMES/articles/mpb12-2/Article/index_html

Maybank Q1 net profit jumps 54pc to RM881.8m

Maybank Q1 net profit jumps 54pc to RM881.8m
Published: 2009/11/13


Malayan Banking Bhd's (Maybank) (1155) first quarter net profit jumped 54 per cent, on account of strong performances of its treasury operations, international business, investment banking and insurance and takaful.

Results for the quarter to September 2009 were also boosted by the absence of one-off items of impairment charge recorded in the same period in 2008.

Maybank yesterday reported a net profit of RM881.8 million for the latest quarter, compared with RM572 million in the previous comparable period.

Maybank said its core commercial banking operations are expected to perform better with positive but modest loan growth although recovery in the small- and medium-sized enterprise segment, which has been adversely impacted by the downturn in the external sector, will be uncertain.

"Whilst seeking to expand and regain market share in selected business segments, the group will continue to be vigilant in ensuring that asset quality is preserved. Prudent risk management practices and stringent asset quality management should contain the risk of deterioration in asset quality," Maybank said in an announcement to Bursa Malaysia yesterday.

The group's net interest income for the first financial quarter ended September 30 2009 increased by RM362.6 million or 28.7 per cent over that of the corresponding period in 2008 to RM1,627.6 million.

The higher net interest income is mainly attributed by the income contribution from PT Bank Internasional Indonesia Tbk (BII), a 97.5 per cent subsidiary, which was only taken into account this year.

Non interest income was higher by RM647 million or 130.7 per cent compared to that of the previous corresponding period.

The higher non interest income was contributed by foreign exchange profit, fee income and other income, which were higher by RM232.9 million, RM79.4 million and RM137.9 million respectively.

Allowance for losses on loans, advances and financing was higher by RM232.3 million or 125.3 per cent due mainly to the specific allowance made at BII, whilst there was no consolidation of BII's specific allowance made in the corresponding period.

"We are confident of sustaining the current momentum for growth and we look to sustained business growth in our key markets across the region," Maybank president and chief executive officer Datuk Seri Abdul Wahid Omar said in a statement released to the press.

http://www.btimes.com.my/Current_News/BTIMES/articles/mayb12/Article/index_html


Date Dividends
10/7/2008 0.2
3/24/2008 0.15
12/31/2007 0.175
10/30/2007 0.4
4/10/2007 0.4
10/30/2006 0.35
12/23/2005 0.5
10/12/2004 0.25
3/11/2004 0.25
10/15/2003 0.17
4/14/2003 0.1

Thursday 12 November 2009

Bank of England's Mervyn King says UK only just started on recovery road


Bank of England projections for GDP based on market interest rate expectations and £200bn of asset purchases. The fan chart depicts the probability of various outcomes for GDP growth. Bank of England's projection for CPI inflation based on market interest rate expectations and £200bn of asset purchases. The fan chart depicts the probability of various outcomes for CPI inflation in the future.


Bank of England's Mervyn King says UK only just started on recovery road
Bank of England Governor Mervyn King said he has an open mind on whether to inject more money into the economy, as the UK has only 'just started' along the road to recovery.

Mr King said today that the Bank's Monetary Policy Committee has an 'open mind' on whether to add to the £200bn of new money pumped into the economy, as its latest quarterly Inflation Report delivered higher forecasts for growth and inflation.

"We have a completely open mind as to whether to do more," Mr King told a press conference where he outlined the new forecasts, which see the economy returning to growth by the beginning of next year and then expanding at a 3.75pc pace by the end of 2011 - faster than its projection in August.

The Bank also expects inflation to rise above its 2pc target in the next few months before heading back down to 1.6pc within two years.

The higher growth and inflation forecasts come amid signs that Britain is emerging from its deepest recession since the 1930s. The Bank said today that it expects figures from the Office for National Statistics that last month showed the economy was still mired in recession in the third quarter to be revised upwards.

Economists reckon that the Bank's new forecasts don't signal that interest rates will be raised from their record low level of 0.5pc anytime soon. The Bank slashed rates to historic lows at the depth of the financial crisis last autumn, and has also pumped in £200bn of new money into the economy in an unprecedented policy known as quantitative easing (QE).

Mr King told a press conference that commentators had been mistaken in assuming that the policy of QE is now over.

“Any monetary stimulus is likely to face headwinds," said Mr King. "That is not to say quantitative easing is not working - it is - but it means we’ve had to put more in than would have been necessary if the banking sector was stronger.”

Sterling fell almost a cent against the dollar to $1.6650 and weakned against the euro too. Prices for government bonds rose.

"In short, it’s too soon to rule out further monetary policy action," said Jonathan Loynes, an economist at Capital Economics. "At the very least, any tightening looks a long way off."


http://www.telegraph.co.uk/finance/financetopics/recession/6544674/Bank-of-Englands-Mervyn-King-says-UK-only-just-started-on-recovery-road.html

Assets to invest in.

Here are some assets to invest in.

1.  A residence.
This is often the first property acquired.  Choose a great property to make a good home.

2.  A premise for own business.
With so many commercial buildings available, renting is also an option.   Location and suitability to the business are important.

3.  Commercial property(ies) for rental income.
Location. Location. Location.  But be prepared for the problems of being a landlord.  Capital appreciation the last 10 years and rental income have been poor in those locations where the supplies exceed demands for rental properties.

4.  Land for residential, industrial or commercial use.
Needs a large initial capital.  No income or minimal income yield for many years until the full potential of the land is realised.  However, capital appreciations over many years are often huge.

5.  Plantations for income.
For those with the enthusiasm to manage an oil palm plantation, this is still a great investment.  Equally, acquiring stocks of plantation counters serve the same purpose.

6.  Cash in FDs or fixed income investment products.
Worth keeping some cash for emergency use.  However, the buying power of cash is eroded by inflation over many years.

7.  Shares in the local bourse.
Probably the better investments for those with the necessary financial education.  But be prepared for the market price fluctuations (volatilites).  Take advantage of market volatility and make it your friend.  Do not fall folly to it.

8.  Shares in the overseas bourses.
This is part of diversifying your assets overseas.

9.  Own business.
A challenge for those who has the zeal of an enterpreneur.  Higher risk but the rewards can be hugely substantial.

10.  Buying whole or part of new businesses.
For those with the enterpreneur spirit.  But be prepared to manage the business.

How is a P/E multiple used?

The Price/Earnings Multiple Enigma

If the Price to Earnings Multiple (P/E) were to be judged by usage, it wins hands down compared to any other valuation metric. It is easy to compute, can be applied across companies and across sectors, with a few exceptions. What is this ratio, how is it computed, and how to use it are questions to which you will find answers in this section.

What is a P/E multiple?
The P/E multiple is the premium that the market is willing to pay on the earnings per share of a company, based on its future growth. The ratio is most often used to conclude whether a stock is undervalued or overvalued. The P/E is calculated by dividing the current market price of a company's stock by the last reported full-year earnings per share (EPS). In effect, the ratio uses the company's earnings as a guide to value it. The P/E thus computed is also known as the trailing or historical P/E since it uses the trailing (historical) EPS in its calculations. With the advent of quarterly results, it is also possible to compute P/E, based on the earnings of the latest four quarters’ EPS. This is known as trailing twelve months P/E.

A variant of the P/E - called the forward P/E - has also been developed wherein the current market price of the stock is divided by the expected future EPS. The attempt to study P/E ratios in this manner reflects the effort to factor in the expected growth of a company.

Since stock market valuations factor in the future expectations of the market, a P/E multiple computed using historical earnings can at best be of academic value since it does not factor in the future growth in earnings. It fails to capture events that may have happened after the earnings date. For example, suppose a merger happens after the earnings have been declared, a P/E multiple based on the historical P/E will fail to capture this event in the EPS whereas the price would reflect it, creating a distortion.

The forward P/E is popularly used to find out if the premium the market is willing to pay on the earnings is line with the growth expectations. For example, the market price of Stock A is Rs 1,000, with a P/E multiple of 30 based on historical earnings. Assuming an earnings growth of 50%, the one year forward P/E changes to 20, which means the market is willing to pay 30 times its historical earnings and 20 times its one-year forward earnings.

For an investor it makes much more sense to look at the forward P/E for taking an investment decision. Each investor would have his or her own expectations regarding the future earnings growth. To that extent the forward P/E for a particular stock will vary from investor to investor.


How is a P/E multiple used?
P/E multiples reflect collective investor perception regarding a company's future. This perception is a function of various factors, like industry growth prospects, company’s position in industry, its growth plans, quantum change expected in sales or profit growth, quality of management, and other macroeconomic factors like interest rates and inflation.

Is a stock trading at a P/E of 30 more expensive than a stock trading at a P/E of 60? Such a wide variation in P/E multiples can be owing to a few reasons. If the companies are in the same industry, it could be that the company with a high P/E may be one with superior size and financials, with better prospects or even better management. The market expects this stock to outperform its peers. If they are from different industries, it could also be due to different growth prospects. For example, an energy utility will have a more sedate earnings profile than say a software company.

Besides different expectations regarding future earnings growth, some of the difference in P/E can also be attributed to the disclosures made by the management to their shareholders. Hence, qualitative factors like transparency, quality of management also impact a stock's P/E.

Stock prices, in isolation do not give any indication whether the stock is undervalued or overvalued. They have to be viewed along with the company's future prospects to arrive at any conclusion. Generally, higher the expected growth in a company's earnings, higher is the P/E multiple that it attracts in the market. The time period used for P/E calculations depends on the investment horizon of the investor and would be different for each investor. However, P/E multiples cannot be applied to loss making companies since they do not have any earnings.


Price to Earnings Growth Multiple (PEG)
The PEG multiple takes the P/E analysis to the next stage. Since P/E ratios are computed based on historic earnings, they project an inaccurate picture of the future. The PEG multiple uses expected growth in earnings, to give investors additional information. The PEG divides the historical P/E ratio by the compounded annual growth rate of future earnings. Generally, the compounded earnings growth is calculated using the forecasted earnings for the next two-three years.

For example, if a company is quoting at a P/E of 60 based on historic earnings and the compounded annual growth rate of its earnings for the next three years is 20 per cent, then its PEG is 3.

The lower the PEG, the more attractive the stock becomes as an investment proposition. It is obviously more appealing to buy a stock on a P/E of 20 whose earnings are growing at 50 per cent than to buy a stock on a multiple of 50 whose earnings are growing at 20 per cent. As a thumb rule, stocks quoting at a PEG multiple below 0.5 are considered to be undervalued, 1 to be fairly valued, and 2 to be overvalued.


http://www.hdfcsec.com/KnowledgeCenter/Story.aspx?ArticleID=8153321b-8faa-4429-abba-bbfe5f29e77d

Business valuation with price earnings multiples

Business valuation with price earnings multiples

Tuesday, 12 December 2006 02:45 Anton Joseph
E-mail | Print | Tags: valuation | business sale/purchase | ip revenue | strategy

When it comes to selling or buying a business the sale price is the greatest obstacle and point of disagreement in many transactions. If there is a reasonable and easily understandable way of determining the value of the business the parties can quickly progress more than half way through the sale process. Although it is said that the right tools must be used to value businesses, no simple method suits all types of businesses. Instead, there are several financial and non-financial performance indicators that are commonly used by businesses to monitor their progress. Some are used to measure profitability whilst others are used to test liquidity.

Financial indicators are normally measured by using ratios calculated using numerical values appearing in the profit and loss account or the balance sheet. Since the indicators are snapshot calculations based on historical figures (figures for the past year), there is an understandable reluctance to always rely on them. This is especially so when a small business is examined for its value for sale.

A prudent business seller or buyer can use financial indicators (such as industry conventions, multiples and ratios) as part of a toolkit to negotiate an acceptable business sale price. One indicator is a price earnings multiple. Elsewhere we have examined business valuation with EBIT multiples.

PE multiple or PE ratio definition

A price earning multiple (PE multiple) is used mostly to estimate the performance of companies whose shares are traded in public and therefore reflect market expectation to a credible extent. The PE multiple of a share is also commonly called its "PE ratio", "earnings multiple", "multiple", "P/E", or "PE").

The PE multiple method, while unorthodox for small and medium-sized businesses, may provide a useful indicator of the value of a business for sale purposes.


Examples of use of PE multiples in Australian business

You can achieve better outcomes as a seller or buyer if you properly prepare for and anticipate positions that various interested parties might hold during the negotiation dance that takes place for a business sale, purchase, takeover, merger or acquisition. It is useful to study prior transactions and to keep a close watch on market developments. Here are recent examples illustrating the use of PE multiples in media commentary, research reports and takeover documents.

Wealth Creator Magazine in its Sep/Oct 2006 issue reviews "hot" stocks in the 2006-07 financial year. In its commentary it says John Fairfax Holdings Ltd (ASX code: FXJ) "...is currently trading on a price earnings of 16 x and provides a yield of 4.5% fully franked..." and Fosters Group Ltd (ASX code: FGL) "...is trading at a price earnings multiple of 15.6 x 2006 earnings, which we believe is reasonable earnings, reduced gearing and upside potential as the cycle improves."

Intersuisse Ltd in an investment research statement dated 24 August 2006 makes a buy recommendation about BHP Billiton (ASX code: BHP) concluding: "We believe the depth and quality of the company's earnings are such that the stock deserved to be placed on a higher price/earnings (p/e) multiple than the prospective p/e of 10.4 times for FY07 and 9.8 times for FY08 and that multiples of at least 12 to 14 times would be more appropriate."

In an Independent Expert's Report Grant Samuel & Associates Pty Ltd assesses the takeover bid by Rank Group Australia Pty Ltd for Burns, Philp & Company Ltd. Grant Samuel states (at its page 18):

"Capitalisation of earnings or cash flows is the most commonly used method for valuation of industrial businesses. This methodology is most appropriate for industrial businesses with a substantial operating history and a consistent earnings trend that is sufficiently stable to be indicative of ongoing earnings potential. This methodology is not particularly suitable for start-up businesses, businesses with an erratic earnings pattern or businesses that have unusual capital expenditure requirements. This methodology involves capitalising the earnings or cash flows of a business at a multiple that reflects the risks of the business and the stream of income that it generates. These multiples can be applied to a number of different earnings or cash flow measures including EBITDA, EBIT or net profit after tax. These are referred to respectively as EBITDA multiples, EBIT multiples and price earnings multiples. Price earnings multiples are commonly used in the context of the sharemarket. EBITDA and EBIT multiples are more commonly used in valuing whole businesses for acquisition purposes where gearing is in the control of the acquirer."


How to calculate the PE multiple for your business

The PE multiple method is the most commonly used earnings capitalisation methodology. It appears in the following two equations:

1.Total value of business = PE multiple x net profit after tax (NPAT)
2.Value per share = PE multiple x earnings per share

The above two equations can be used to provide some indication of the value of a business. First, using the second equation, dividing the market price of a share by the earnings per share you will be able to calculate the PE multiple for the business. Then by multiplying the PE multiple by NPAT a value for the business can be determined.

With a public company, assume the market value of a share of the company is $35 and the earnings per share is $5, then the PE multiple is 25 divided by 5 which is 7. If the NPAT is $110,000 then the value of the business is $110,000 multiplied by 7, which is $770,000.

As a first step in using the above method, one needs to find a listed company carrying on a business similar to the business of the company to be valued. Next, obtain a copy of the most recent financial statements published by the company, from which the NPAT and EPS of the company can be obtained. Now obtain the recent price quoted for the shares in the company from its Website or the ASX Website.

EPS is a measure of the amount of profit that can be attributed to ordinary shares in the company. If the financial statements of the company do not provide the EPS, it can be calculated by dividing NPAT (after deducting NPAT attributable to any outside equity interests, such as preference shares and any payments made to such outside equity interests) by the total number of ordinary shares on issue. The total number of shares on issue can be got from the balance sheet of the company.

If the PE multiple of the company selected is high it can mean that the shares of the company are overpriced and yet the market is expecting a high return in the future. This could be for several reasons, such as potential for growth in the overseas market or even a change of the CEO. Similarly the PE multiple could be low and the shares underpriced because the company selected is about to be brought under a strict regulatory regime by the Government or it has lost a crucial licence. What is suggested here is that the PE multiple calculated using a typical company in the industry may not totally reflect the situation of the business under review.


PE multiple caution

Since the PE multiple method of valuation is dependent on factors that are approximations, consideration of other relevant performance ratios is recommended, eg dividend per share, dividend yield, dividend cover, net tangible assets per share and cash flow per share.

Ultimately working out the PE multiple is a job for a specialist or professional. It is not a job for a lawyer. It is also not a job for a non-financial business executive who is not properly briefed. But it is useful for everyone to be aware of how the numbers are derived.


http://www.dilanchian.com.au/index.php?option=com_content&task=view&id=166&Itemid=148

Modern trading making earnings multiples obsolete

Modern trading making earnings multiples obsolete
by Grace Chen on May 19, 2008

Price to earnings multiples were once the basis of investment decisions. The analysis was simple: the return divided by the stock price should properly valuate a certain company. But with many companies all over the map in both PE and PEG ratios, investors are looking for other guidelines for evaluating an investment. Technical trading has all but taken over the short term trader, and it looks ready to conquer the long term as well.

Old value investors

Warren Buffett dominates the field of value investing. Rather than following the world’s hottest stocks, he looks for companies that are considerably undervalued, both by assets and what he believes the company is really worth. While he’s made a large fortune from his studies on value investing, the markets are seemingly turning out of his favor. Valuing a company is no longer as easy as looking for cheap assets, as many companies have little assets to back their valuations. Others trade at huge multiples of their earnings, while their competitors enjoy smaller ratios, and even others are destined to stay cheap forever due only to the nature of the business.

Case in point

It seems that many companies are selling for high premiums, even with little to back up their valuations. Take for example the internet stocks. Google sells for a PE ratio of 41 but a PEG of 1.02. While Google does sell for an extreme premium over its earnings, adjusted for growth Google is still in the buy range. Compare these statistics to the lesser rival Yahoo, which trades for a PE of 33 and a PEG of 2.8. Even prior to the failed Microsoft bid, Yahoo traded at a similar PE and PEG ratio; for the most part, it’s horribly overvalued.

Traditionally, you would think that the two valuations would come to meet each other in the middle. Google’s price would ultimately rise while Yahoo would shed a few points to come back to earth. Though this is what the rational person would think, it seems like Yahoo will forever enjoy being overpriced and Google will always be under priced. In fact, Google has never traded for a PEG ratio higher than 2. Yahoo has traded for both extremely high PE ratios and PEGs, though its data is somewhat skewed by the y2k internet bubble fiasco.


Has technical analysis beat out fundamentals?

It appears as though technical traders have finally won over the market. By looking at today’s measurements, Yahoo’s stock is kept afloat largely by technical support and resistance, while Google is much the same. The difference in trading techniques even from just 2004 to today would suggest that stocks are now traded more independently than ever. Rarely are stocks compared to reasonable value to their competitors by investors. The new age of trading is systematically making investors “one stock” types, those only willing to trade the ups and downs and day to day of a specific stock, rather than comparing it to its competition.

Investing at its roots has been crippled. The sustainability or profitability of future results are rarely calculated in many investors algorithms. Technical analysis has instead brought trading to a whole new level, where stocks are nearly as good as any other commodity. The earnings of a company no longer matter, nor do its assets, nor its valuation. The digits in the stock price are the few things that matter to most modern day traders; forget the business behind the ticker.


http://www.investortrip.com/modern-trading-making-earnings-multiples-obsolete/


Comment:  Ohhhh!!!!!

A Crash Course on Earnings Multiples

A Crash Course on Earnings Multiples


As a trusted business advisor you’ve probably heard former business owners telling people that they sold their business for “six times earnings.” As investment bankers, the first question we hear from prospective clients is “Can I get the same multiple if I sell my business?” The answer is an unequivocal "it depends." It depends on a number of things, but first and foremost, it depends on how you define “earnings”.

As all investment bankers and sellers know, “Cash is King.” After all, cash removes the seller’s risk in the transaction. However, when a buyer pays cash for a business, that buyer wants to know exactly how much the business is earning.

Let’s start with what seems to be a pretty basic concept: earnings.


The Definitions of Earnings

There are several definitions of earnings; each is potentially different from the other depending on the type of company and the way its owner runs the company. Typical measures of earnings include:

§ Net Operating Income: This is sales less the cost of goods sold and operating expenses.

§ Pre-tax Income: This is net operating income plus non-operating income (like interest on notes, etc.) less non-operating expenses (like one-time, non-recurring expenses).

§ After-tax Income: Pre-tax income, less all company (but not individual) taxes.

§ EBIT: This stands for earnings before interest and taxes.

§ EBITDA: This stands for earnings before interest, taxes, depreciation and amortization


Add to these measures, the need to “adjust" earnings by deducting capital expenditures, and adding back excess rents, excessive salary and bonuses paid to the owner and his or her family. The result is something called:

Owner’s Discretionary Cash Flow or True Cash Flow: This is the amount of pre-tax money distributed to owners via salary, bonus, distributions from the company such as S-distributions, and rental payments in excess of fair market rental value of the equipment or building used in the business. This provides buyers with the most accurate indicator of how much “cash” a company can actually produce and is often the most meaningful indicator of value.

Which brings us back to our original question: Is it realistic for a business owner to expect a six times multiple when he sells his business? There is no one right or wrong answer to this question.

To show you how tricky this can be, let’s look at a former client of ours. His business was not doing well. He had revenues of approximately $7 million but, even using the most generous definition of earnings, the company was not earning more that about $100,000 per year. We ultimately sold the company to a buyer of distressed companies who paid book value for its assets or about $2 million. Despite this low value, our client was extremely happy because his business sold for 20 times earnings! In this case the buyer was buying assets, not earnings, so an earning multiple wasn’t even appropriate.

To determine which measure of earnings is appropriate for a business, you need to look first at how the seller’s industry defines “earnings”. This "earnings" measure reflects how much a buyer can afford to pay for the business. The actual multiple applied will be based on:

§ which definition of cash flow is being used,

§ what is appropriate for a given industry,

§ what the company’s specific growth prospects are,

§ how the company’s earnings compare with similar companies in the same industry, and finally

§ how the company’s earnings compare with the company’s asset value.

Richard E. Jackim, JD, MBA, CEPA is the author of the critically acclaimed book, “The $10 Trillion Opportunity: Designing Successful Exit Strategies for Middle Market Business Owners”, available at http://www.exit-planning-institute.org/


http://www.imakenews.com/epi_hfco/e_article001197834.cfm?x=bdnqbsy,w

New Approach to Uncertainty in Business Valuations

 
New Approach to Uncertainty in Business Valuations

 
By Thomas E. McKee


The typical business valuation has a significant limitation: the failure to recognize uncertainty. Business valuation specialists try to cope with uncertainty by triangulation of three different valuation techniques,
  • applying a premium or discount to a capitalization rate, or
  • adjusting future revenue and
  • adjusting future expense projections.
 These techniques generally can do no better than narrow the valuation range among valuation results to +/-- 15%, a limitation that users should understand.  Fortunately, “fuzzy math” functions in spreadsheets can formally incorporate uncertainty in business valuations in a way that incorporates significant additional information into valuation reports and helps mitigate the limitations of traditional valuation approaches.

 
Uncertainty in Valuation Opinions

 
The typical report—“It is our considered opinion that the Fair Market Value of 100% of the common stock of ABC Inc. as of December 31, 2003, is best expressed as $12,800,000”—would not reveal the possibility that ABC Inc. might be worth as much as $15 million or as little as $10 million. The range of possible values usually is not available under traditional valuation reporting approaches.

 
Contrast the previous opinion with the following opinion and Panel 1 of the Sidebar: “It is our considered opinion that the Fair Market Value of 100% of the common stock of ABC Inc. as of December 31, 2003, is best expressed as most likely to be $12,800,000, according to the enclosed belief graph.”

 
The belief graph in Panel 1 shows a 40% probability that the company may be worth as little as $10 million. It also indicates the belief that there is 0% probability of the company being worth more than $17 million.

 
The belief graphs in the Sidebar illustrate possible reporting tools with fuzzy math.

 
Risk Assessment

 
Risk is the possibility of an adverse event. For a potential purchaser of ABC Inc., the company in the previous example, an adverse event would be paying $12 million for the company only to find out subsequently that its fair market value is only $10 million.

 
Risk is typically assessed in terms of both the likelihood an adverse event will occur and the monetary impact it would have. A purchaser of ABC Inc. willing to pay $12 million faces a 40% possibility that the company is worth $2 million less.

 
Risk can be assessed in terms of statistical probabilities determined by sampling from large populations. Further refinement through simulation analyses can provide additional insights. Simulation approaches can be extremely complex and time-consuming, however, leading to a search for alternatives for typical valuation work.

 
Another approach to risk assessment considers the possibility or likelihood of an outcome. For example, any valuation expert performing a valuation of ABC Inc. would know that it is not absolutely true that the company value is exactly $12,800,000; this value simply represents the single best estimate. Fuzzy math logic provides a means to manage, and disclose, the degree of uncertainty or imprecision in the valuation amount of $12,800,000.

 
Fuzzy Logic

 
Fuzzy logic was developed in the mid-twentieth century to deal with the uncertainty that arises from ambiguity or vagueness, which differs from the randomness associated with uncertainty in statistical probability. Ambiguity or vagueness may occur because of imprecision in linguistic terms or from an inability to measure an object precisely.

 
Under classical logic, a statement is either true or false; however, under fuzzy logic, the truth of a statement can be described as anything between 0 (false) and 1 (true). Thus, a statement with a value of .8 would represent a fairly strong belief that the statement is true. Fuzzy logic has become widely accepted by scientists and mathematicians, who use it in a wide array of applications, including weather forecasting.

 
Fuzzy math allows the simultaneous assignment of possibilities to a number of mutually exclusive outcomes. For example, a valuation of 10 could occur with a belief of 100%, but a valuation of 9 could occur with a belief of 50%. One belief does not preclude the other. Beliefs about many different valuations over an interval would be possible.

 
Fuzzy math beliefs are not the same as statistical probabilities. Statistical probabilities for an event typically have to sum to 1, which implies 100% certainty in statistical probability. Fuzzy math beliefs do not need to sum to 1 or any other value.

 
Implementing Fuzzy Logic in Business Valuations

 
Fuzzy logic can be implemented in business valuations through spreadsheet software such as Microsoft Excel. FuziCalc, by FuziWare Inc., introduced a practical Windows-based spreadsheet incorporating a variation of fuzzy math over a decade ago.

 
For example, using the multiple of earnings valuation model, with an earnings multiple of 10, a company with normalized earnings of $120,000 would have an estimated company value of $1,200,000.

 
Sensitivity analysis using fuzzy math can convert earnings multiples and normalized earnings point estimates to fuzzy amounts by associating possibility beliefs with them. For example, it could be determined that an earnings multiple between 8 and 12 is appropriate, with 10 being the most likely. The multiple could be expressed in a triangular belief graph shaped similar to the one shown in Panel 2. Similarly, it could be determined that normalized earnings of $120,000 are most likely but, based on past variations, earnings could range from slightly above $100,000 to slightly below $160,000, as shown in Panel 2. Note that the midpoint for this belief graph is not the normalized earnings estimate of $120,000 but rather $125,900, because the interval is weighted in this direction. The midpoint is the point at which half of the distribution is on either side. By introducing the range of possible values for normalized earnings, new information, such as the midpoint of the belief function, becomes available.

 
The normal mathematical operations of addition, subtraction, multiplication, and division apply to fuzzy numbers. Exhibit 1 shows how the fuzzy number, the minimum, the midpoint, and the maximum can be factored into a valuation.

 
When the possible range of values for both the price earnings ratio and the normalized earnings is considered, the value of the company is not simply $1,200,000, the point estimate from traditional math, but rather $1,293,000, the midpoint of the fuzzy number for the overall company value estimate.

 
Present Value of Future Earnings or Cash Flow

 
Because all normal mathematical operations apply to them, fuzzy numbers can also be used with present value of future earnings cash flow techniques.

 
For example, consider ABC Inc., a mature company in a stable industry. Assume a forecast horizon of only three years with a terminal value assumption for the fourth year, consistent with the valuation of a mature company with no anticipated, significant long-term changes.

 
Assume that current-year free cash flow is $91,000 and is expected to grow 10% annually for the next three years before reverting to the long-term industry growth rate of 5%. The weighted average cost of capital is 8%. The traditional valuation might resemble Exhibit 2, focusing on the value of core operations while ignoring other items that might influence the free cash flow.

 
This valuation indicates a company value of $3,547,580. Some small changes to the assumed growth rates in the previous assumptions, however, can make a difference. First, assume that the anticipated growth rate for the next three years is a fuzzy number of 10% that ranges from a minimum of 8% to a maximum of 12%. Second, assume that the long-term industry growth rate for Year 4 and beyond is a fuzzy number of 5% that ranges from a minimum of 4% to a maximum of 7%. Changing these two assumptions to fuzzy numbers would result in the valuation in Exhibit 3 and the value of core operations of $5,384,453 is a fuzzy number represented by Sidebar Panel 3.

 
Panel 3 shows that the value with the highest belief of 1 is a point that is slightly above the $3,500,000 point on the belief graph. This is consistent with the traditional valuation estimate of $3,547,580. The valuation amount using the fuzzy numbers becomes $5,384,453, approximately $1.8 million higher than the traditional valuation of $3,547,580. The higher valuation derives from the conversion of growth rates from traditional point estimates into fuzzy numbers.

 
The valuations of $3,547,580 and $5,384,453 are both correct according to the assumptions used to produce them. The fuzzy number valuation better reflects the reality that there is greater upside potential to long-term growth than can be expressed by a point estimate. Panel 3 shows that, although the point of highest belief is $3,547,580, there is more upside than downside potential to the valuation. This indicates that the potential value of the company is somewhere between $3,547,580 and $5,384,453. A seller for ABC Inc. should know about the upside potential when negotiating a sale, as should the buyer.


--------------------------------------------------------------------------------
Thomas E. McKee, CMA, CIA, PhD, CPA, is a visiting professor in the department of accounting and legal studies at the College of Charleston, Charleston, S.C.


http://www.nysscpa.org/cpajournal/2004/404/essentials/p46.htm

The earnings multiple valuation method

The earnings multiple valuation method

The earnings multiple valuation method is the preferred valuation method for most situations. It represents what someone would pay if you tried to sell under normal conditions, which is arguably the most appropriate valuation method for private equity investments.

In the broad strokes, this method entails applying an industry-based multiple to the earnings of a business to arrive at an implied enterprise value. From this enterprise value, subtracting net debt gives the equity value. In simple scenarios (involving only ordinary equity), a private equity firm’s relevant investment value is equal to their proportional stake in the investee’s equity.

The subjectivity of this method comes in the following forms:

•Do you use last year’s actual earnings number? Do you use a forecast? If so, whose forecast do you use? And what earnings are we talking about: NPBT, NPAT, EBIT, EBITDA? What about the effect of non-recurring costs, contributions from discontinued business units, forecast acquisition synergies, etc?

•What is an appropriate multiple? Are transactions from six months ago reasonable comparisons? Should I only use transactions from the same industry as comparables? What about company size: should I only compare those of similar size? What if there haven’t been any transactions for 12 months (this is especially applicable now)? Should I use the mean, mode or median of comparable transactions?

There are a lot of questions there and not many answers; it really depends on how honest you want to be with yourself and the limited partners. Here are my suggestions:

•Earnings - You should use the earnings number that you expect at the time of reporting. For example, this may be the current year’s EBIT forecast adjusted for the latest actual earnings figures (that is, if you were below budget, adjust the forecast months accordingly). If the trend is towards using the previous year’s earnings, then you should follow suit.

•Multiple - In the current climate, you may need to look outside your industry for trends, but also make sure to look for similar sized transactions. There’s no perfect multiple to use, but there’s certainly a range that will seem reasonable. I’d say in the current environment that anything over 8-10x would be unreasonable. For mid-market deals, I wouldn’t expect to see multiples over 6-7x, unless there is a strong case for exceptional growth. It may surprise you, but I’m seeing some interesting deals go for 3x now.

You’ll know in your own mind whether you’re being fair with your analysis. Try not to cheat yourself because there’s a real danger that it could come back to haunt you. There’s always the argument that if things really do get better, investors will be glad to see a significant uptick in your next report. If you’re too optimistic now, disappointing them twice will hardly be fun. Also, investors won’t be surprised with value losses now; they’re probably expecting them. So take this opportunity to take an honest look at your portfolio and move on to planning for the upturn (now there’s some positive thinking).

http://www.theprivateequiteer.com/the-earnings-multiple-valuation-method/