Wednesday 7 February 2024

Value traps in real life.

Company X is a private limited company that owns a lot of assets.  It owns plantations, factories, shop houses and various businesses.   Its net book value is very high.   If it can sell off everything at the fair market price, it should be worth a lot of money.

It has many shareholders.  Many are from the same related brothers and sisters.  There are also many outsiders who own shares in the company.   

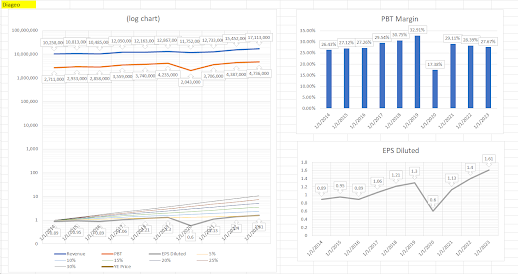
The company makes good profit every year and is cash rich.   It is well managed.  It chooses to distribute a small portion of the yearly profits as dividends and retains the major portion as cash which is  kept in the bank.   Every year its net book value increases due to its retained earnings.   The shareholders get their dividends without fail, though these have not increased through the years, despite the company earnings having improved over the period.  

The management remains sound and those in control of the management and the directors enjoy their fees for their services, which are fair and reasonable.

The company continues to grow its assets and earnings over the years.  Its assets, which are land, properties and businesses have appreciated a lot over the very many years.


Alas, some shareholders wish to cash out.  Who are the buyers?  Yes, some of the shareholders are still accumulating the shares in the company regularly.   There are also many who also are not willing to buy, not because the company is not good and also not because it is overvalued.   They do not wish to tie their money up in the company as they cannot see how they will be rewarded in the coming years.  Except for the dividends received yearly, which weren't much when you compared with the yields from the risk free fixed deposit rates, they just cannot see how they can cash out of this company at a fair price.  The buyers have indicated that they are always available for those who wish to cash out, but the price offered is about half that of the net book value.   This state of affair existed for many years and continues till today.


Are there similarities we can observe in some of the listed companies who are deemed value traps too?

Thursday 4 January 2024

Dutch Lady: Investment returns

Dutch Lady

Year

DPS (sen)

EPS (sen)

MR Pr (RM)

LPr (RM)

HPr (RM)

2002

5.8

23.7

6.10

3.85

8.35

2003

12.8

24.2

4.13

3.76

4.50

2004

56

26.6

4.84

3.98

5.70

2005

63.2

42.4

5.56

4.56

6.55

2006

63.2

67.3

10.05

6.10

14.00

2007

63.2

73.8

11.65

10.00

13.30

2008

42.1

66.6

10.55

8.10

13.00

2009

65.5

94.38

10.93

8.85

13.00

2010

72.5

119.05

15.70

11.30

20.10

2011

72.5

172

23.14

15.28

31.00

2012

260

192.78

37.10

23.40

50.80

2013

260

216.04

45.44

41.40

49.50

2014

220

171.63

44.67

40.36

48.98

2015

220

220.28

45.45

41.80

49.10

2016

220

232.93

56.33

46.68

65.98

2017

280

188.08

58.00

54.00

62.00

2018

200

198.07

67.18

57.38

76.98

2019

100

159.41

55.20

45.62

64.78

2020

80

113.99

41.95

34.00

49.90

2021

50

146.25

34.71

31.92

37.50

2022

50

159.64

32.30

30.00

34.60

2023

50

110

25.26

20.22

30.30

Investing period from starting year to now

(RM)

Year

Total DPS

Pr 4/1/24

MR Pr

Pr change

Total returns

2002

25.07

25.00

6.10

18.90

19.15

2007

23.06

25.00

11.65

13.35

13.58

2012

19.90

25.00

37.10

-12.10

-11.90

2017

8.10

25.00

58.00

-33.00

-32.92

2022

1.00

25.00

32.30

-7.30

-7.29


How to read a balance sheet like a CFO: A risk-based approach


https://www.youtube.com/watch?v=DMv9JC_K37Y


Wednesday 3 January 2024

Returns to shareholders of Petronas Dagangan over the last 10 years and 5 years

Petronas Dagangan

Dividends (sens)  per share received each year: 

2014  55.50

2015  62.00

2016  62.00

2017  78.00

2018  94.00

2019  70.00

2020  61.00

2021  40.00

2022  40.00

2023  NA


Year end share price of PBB

Year 2013 RM 31.44

Year 2018  RM 26.50

Year 2023  RM 23.00


Returns to shareholders of Petdag

10 year period from end of 2013 to end of 2023

Capital depreciation  = RM 23.00 - RM 31.44 = - RM 8.44

Total dividends received =  RM 5.625

Total loss = - RM 8.44  +  RM 5.625  = - RM 2.815  

Loss % = - RM 2.815 / RM 31.44 = - 8.95% 

The loss of capital was attenuated by the dividends received over the last 10 years.


5 year period from end of 2018 to end of 2023

Capital loss =  RM 23.00 - RM 26.50  = - RM 3.50

Total dividends received =  RM 2.11

Total loss  =  - RM 3.50 + RM 2.11 = - RM 1.39

Gain % = - RM 1.39 / RM 26.50 =  - 5.24%

The loss of capital was attenuated by the dividends received over the last 5 years.

Returns to shareholders of Public Bank Berhad over the last 10 years and last 5 years

Public Bank Berhad

Dividends (sens)  per share received each year: 

2014  10.41

2015  11.00

2016  11.60

2017  11.80

2018  13.20

2019   14.00

2020  8.00

2021  20.50

2022  19.70

2023  14.00


Year end share price of PBB

Year 2013 RM 3.76

Year 2018  RM 4.95

Year 2023  RM 4.25


Returns to shareholders of PBB

10 year period from end of 2013 to end of 2023

Capital appreciation  = RM 4.25 - RM 3.76 = RM 0.49

Total dividends received =  RM 1.34

Total gains = RM 0.49 +  RM 1.34  = RM 1.83  

Gain % = RM 1.83 / RM 3.76 = 48.7% 

Dividends provided the bulk of the returns to shareholders over the last 10 years.


5 year period from end of 2018 to end of 2023

Capital loss =  RM 4.25 - RM 4.95  = - RM 0.70

Total dividends received =  RM 0.762

Total gain  =  - RM 0.70 + RM 0.762 = RM 0.062

Gain % = RM 0.062 / RM 4.95 =  1.25%

The loss of capital was attenuated by the dividends received over the last 5 years.

Friday 24 November 2023

HOW TO VALUE A COMPANY: 6 METHODS


1. Book Value

2. Discounted Cash Flows

3. Market Capitalization

4. Enterprise Value

5. EBITDA

6. Present Value of a Growing Perpetuity Formula


Additional notes:

Value of a Growing Perpetuity = Cash Flow / (Cost of Capital - Growth Rate)

In finance, growth is powerful.


https://online.hbs.edu/blog/post/how-to-value-a-company

Thursday 26 October 2023

Monday 23 October 2023

How Warren Buffett Made His First $1,000,000


Timestamps: 00:00 Intro 01:53 Buffett the Grinder (1936-) 03:00 Buffett the Detective (1936-) 03:57 Buffett the Math Wiz (1936-) 04:34 Buffett the Bookworm (1936-) 05:59 Buffett’s First Investment (1942) 08:02 Buffett’s Motivation (1943) 09:09 Buffett the Newspaper Boy (1944-1947) 10:43 Buffett the Bodybuilder? (1944-1945) 11:23 Buffett the Farm(own)er (1945-1950) 12:15 Buffett the Entrepreneur (1946-) 14:04 Buffett’s High School Promise (1947) 14:22 Buffett and College (1947-1950) 16:25 Buffett the Intelligent Investor (1949-) 19:03 Buffett: The A+ Student (1950-1951) 22:15 Buffett the Insurance King (1951) 24:34 Buffett and Susie (1951-2004) 26:50 Buffett the Stockbroker (1951-1954) 27:59 Buffett & Public Speaking (1952-1958) 29:33 Buffett & His Dream Job (1954-1956) 30:16 Buffett’s First Partnerships (1956-1961) 33:31 Buffett and the Cigar Butts (1956-1972) 37:39 Buffett: Completely Focused (1956-) 38:36 Buffett and Charlie Munger (1959-) 39:48 Buffett: Becoming a Millionaire (1961)

https://www.youtube.com/watch?v=M5i_YYAXsAM

The Swedish Investor