Demand-pull inflation
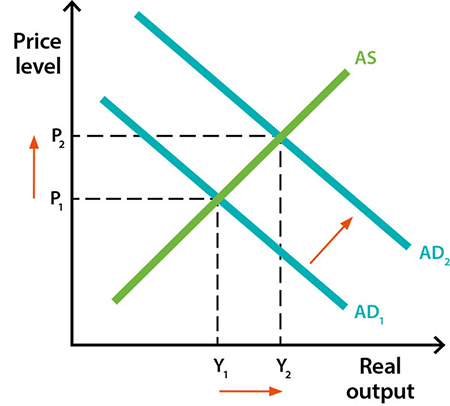
Demand-pull inflation arises when the total demand for goods and services (i.e. ‘aggregate demand’) increases to exceed the supply of goods and services (i.e. ‘aggregate supply’) that can be sustainably produced. The excess demand puts upward pressure on prices across a broad range of goods and services and ultimately leads to an increase in inflation – that is, it ‘pulls’ inflation higher.
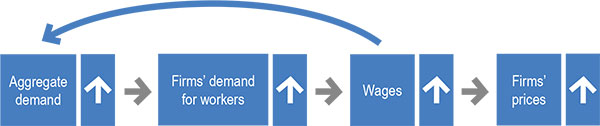
Aggregate demand might increase because there is an increase in spending by consumers, businesses or government, or an increase in net exports. As a result, demand for goods and services will increase relative to their supply, providing scope for firms to increase prices (and their margins – which is their mark-up on costs). At the same time, firms will seek to employ more workers to meet this extra demand. With increased demand for labour, firms may have to offer higher wages to attract new staff and retain their existing employees. Firms may also increase the prices of their goods and services to cover their higher labour costs.[2] More jobs and higher wages increase household incomes and lead to a rise in consumer spending, further increasing aggregate demand and the scope for firms to increase the prices of their goods and services. When this happens across a large number of businesses and sectors, this leads to an increase in inflation.
The opposite will happen when aggregate demand decreases; firms facing lower demand will either pause hiring or make staff redundant which means that fewer staff are required. This puts upward pressure on the unemployment rate. More workers searching for jobs means that firms can offer lower wages, putting downward pressure on household incomes, consumer spending and the prices of their goods and services. As a result, inflation will decrease.
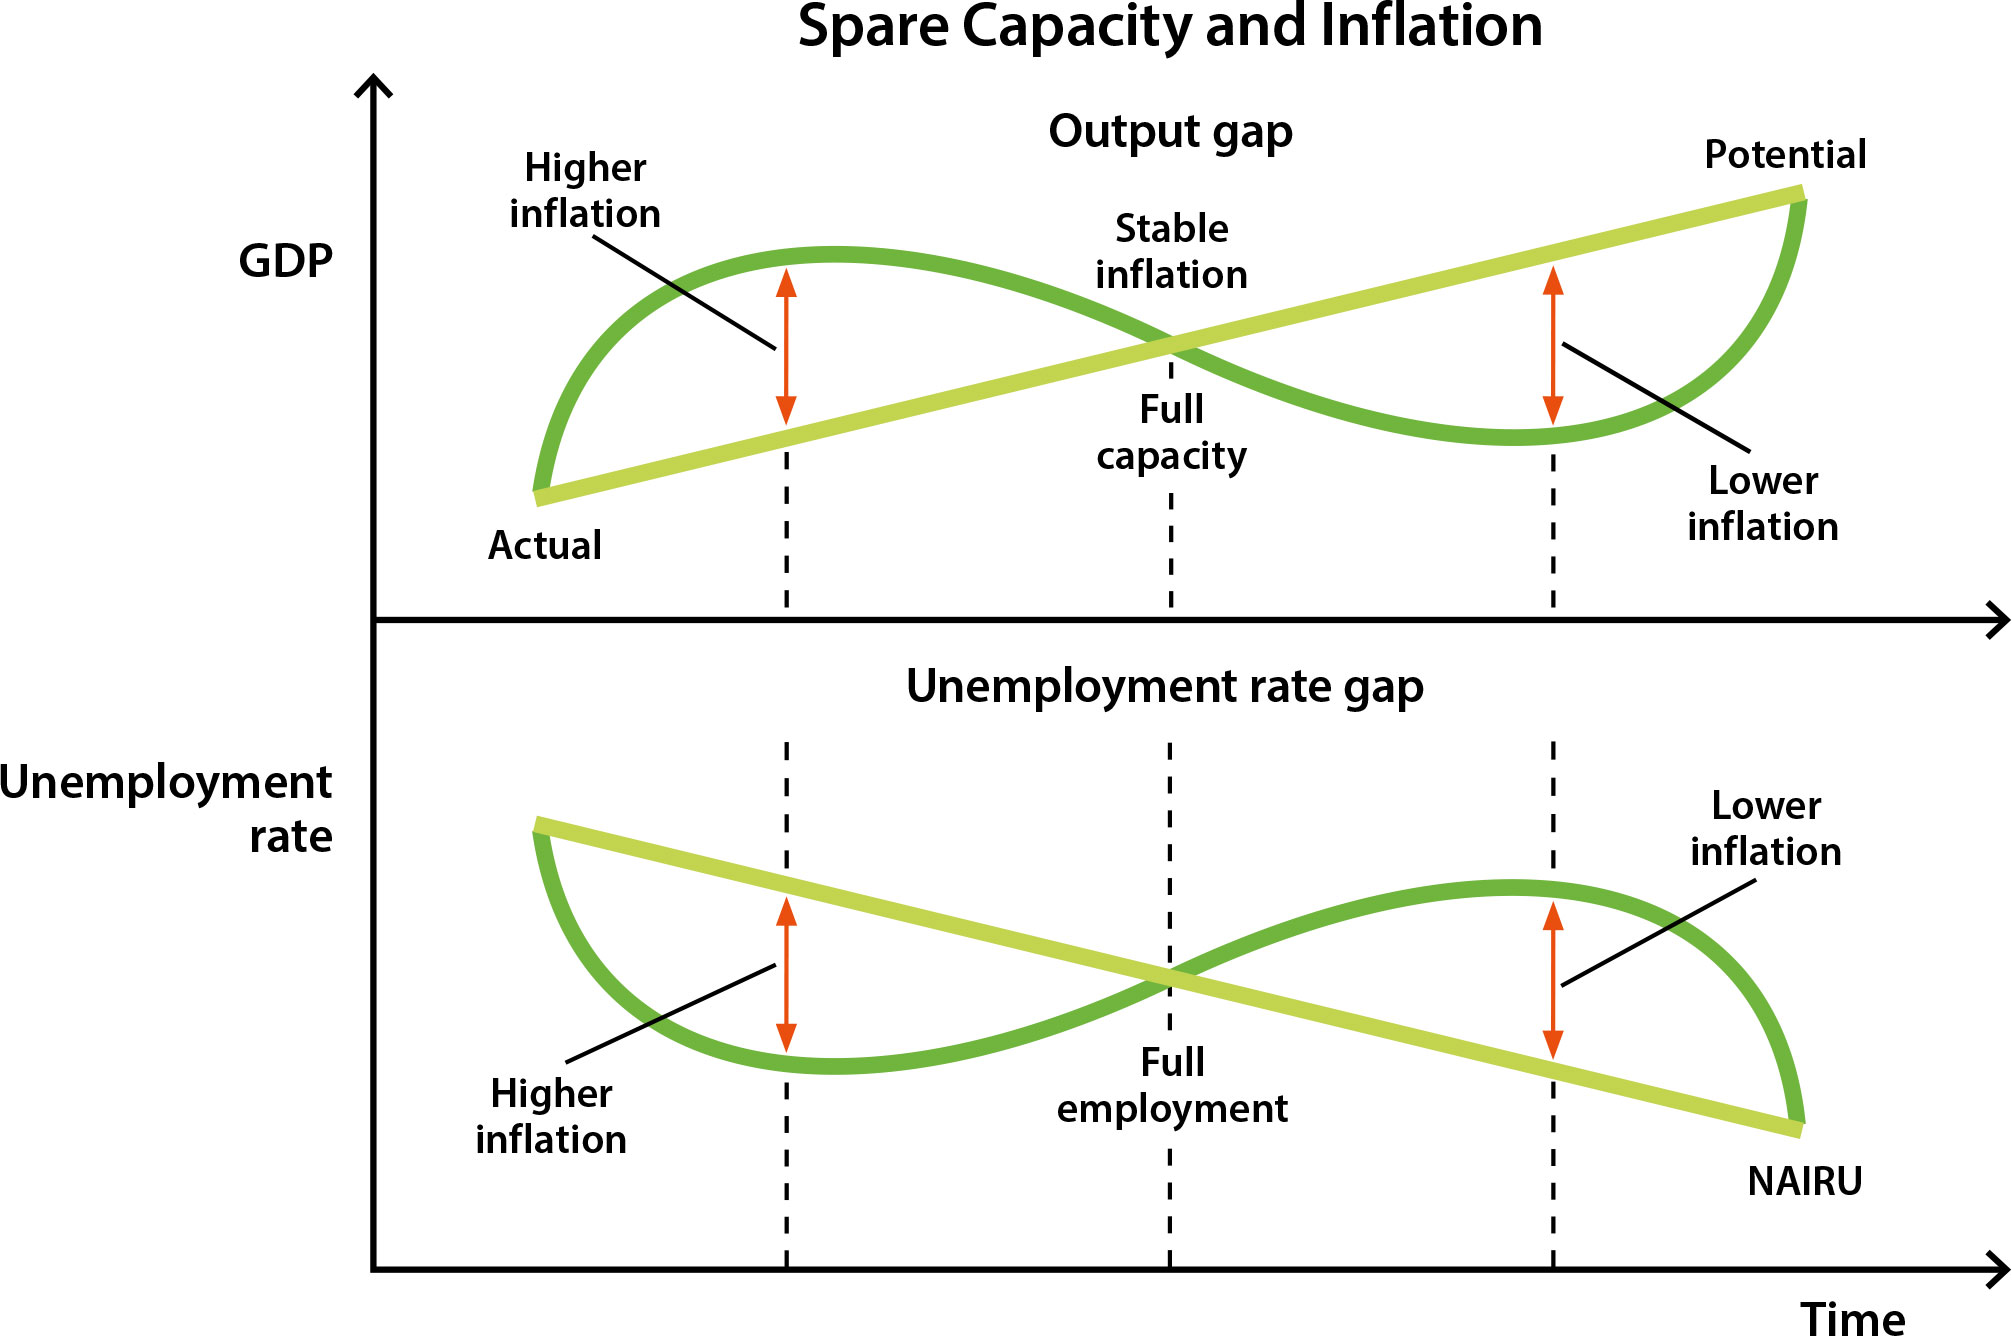
The supply of goods and services that can be sustainably produced is also known as the economy's potential output or full capacity. At this level of output, factors of production, such as labour and capital (which includes the machines and equipment firms use to produce their goods and services) are being used as intensively as possible without putting upward pressure on inflation. When aggregate demand exceeds the economy's potential output, this will put upward pressure on prices. When aggregate demand is below potential output, this will put downward pressure on prices.
So how can we measure how far the economy is from its potential output (or full capacity) and what does this mean for inflation? While we can fairly accurately measure aggregate demand on a quarter to quarter basis using gross domestic product (GDP) data from the national accounts (see Explainer: Economic Growth), potential output is not directly observable − that is, we have to infer it from other evidence about the behaviour of the economy. For instance, just as there is a level of output where inflation is stable, there is also a level of the unemployment rate that is consistent with stable inflation. It is known as the Non-Accelerating Inflation Rate of Unemployment or NAIRU for short (see Explainer: The Non-Accelerating Inflation Rate of Unemployment (NAIRU)). When unemployment is below the NAIRU, inflation will increase and when it is above the NAIRU inflation will decrease.
No comments:
Post a Comment