Sunday 6 May 2018

What I’ve Learned After Making More Than 5-Figures In Dividends

What I’ve Learned After Making More Than 5-Figures In Dividends

By The Fifth Person on December 28, 2015

As investors, we all love dividends. Other than the thrill of seeing a stock you own rise higher and higher in the stock market, receiving passive dividend income from your investments every year is something we all look forward to.

So if you’re more of an income investor and looking to invest for dividends, your stock portfolio will be markedly different from someone who’s investing for high growth and capital gain. The stocks that will give good, consistent dividends may not necessarily be the kind that will grow by 20-50% a year and vice versa.

So if you investing for dividends, you have to invest accordingly and only pick the best stocks that will give the passive dividend income you want. The question is: How?

Over the years, our investments have received more than 5-figures in dividends. So if you’re slightly lost and looking for some direction, here are 7 quick steps that we personally use to pick the best dividend stocks around: (Hint: You can’t just look at dividend yield alone!)


#1 Look for Mid-Large Cap Stocks

The best dividend stocks are usually large, mature companies with stable revenue, profits and cash flow. These companies have little growth left in them. Because these companies are no longer expanding aggressively, the majority of their earnings can be returned to shareholders as dividends.

On the other hand, a smaller, high-growth company needs more cash and resources to grow and expand its business, leaving less money to pay shareholders dividends (if any).


#2 Dividend Payout Ratio is 50% or More

If a company is large, stable and isn’t seeking to grow aggressively any more, then the majority of the profits it makes should be returned to shareholders. So look for a company with a dividend payout ratio of at least 50% or more. For example, NestlĂ© (Malaysia) returns over 90% of its earnings to shareholders as dividends.

If a company has a low payout ratio, ask yourself why the company is holding on to the cash. Unless they have a good reason to do so or have a way to generate exceptional returns for shareholders, the majority of profits should be paid out as dividends.


#3 Track Record of Paying Consistent Dividends

The company should have a long and stable track record of paying consistent/growing dividends to shareholders. No point if a company is large and successful and has profits to distribute as dividends, but chooses to pay them out inconsistently.

The best track record is to see a company pay a consistently growing dividend over the last 5-10 years. This shows that as the company grows more and more successful, the management is also willing to share the fruits of its labour with its shareholders.


#4 Company’s Fundamentals Must Be Sustainable

Many dividend investors tend to ignore the overall aspects of a company’s fundamentals and primarily focus on the amount of dividends they can receive from an investment. While dividend yield is obviously important for someone seeking dividends, it is also important to consider the overall health of the company.

A company with deteriorating fundamentals (e.g. falling revenue, profits, cash flow, fading economic moat, etc.) cannot sustain its dividend payout in the long term. The less revenue and profit it makes, the less dividends it can pay.

Furthermore, a company with falling revenues and profits will see its stock price fall in tandem over time as investors start to realize the company is no longer performing as well. This fall in value will eat into any dividend gains you might have had at the start — leaving you back at square one.

So always make sure the dividend company you want to invest in will remain fundamentally strong and robust for many years to come.


#5 Company has Low CAPEX

As a dividend investor, you prefer to invest in a company with low capital expenditure (CAPEX). A company with high CAPEX means that it has to continually reinvest its profits in maintaining its business operations, leaving less to distribute as dividends.

For example, airlines have very high CAPEX as they need to continually maintain their aircraft and upgrade them to newer models after a certain amount of years.

So look for a company that’s able to maintain/grow its business with minimal CAPEX.

If you want help, you can always kick start the idea by downloading our watchlist of dividend paying stocks below:


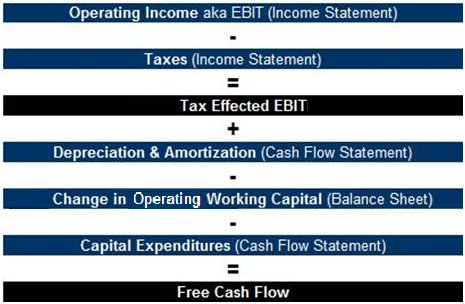
#6 Company has Stable Free Cash Flow

Ultimately, a company must have real cash (not just profits) to be able to pay dividends to its shareholders. Even if a company is profitable but has negative or inconsistent free cash flow, it will have trouble paying stable dividends.

A smaller company that is seeking to grow might have negative free cash flow as it expands its business. But a large, stable company that dominates its industry should be producing high amounts of free cash flow year after year.


#7 Yield Must Beat Risk-Free Rate

The dividend yield you receive from a stock should beat the risk-free rate of the country you reside in. The risk-free rate is the lowest return you can theoretically get “risk-free”over a period of time.

In the US, if you plan to invest your money for ten years, then the risk-free rate is usually based on the return of the 10-year US Treasury note which is currently around 2.30%. In Malaysia, the risk-free rate is usually based on the guaranteed interest your EPF gives you which is 2.5%. However, since 2000, EPF has been able to give out between 4.25% to 6.75%, which is more than the minimal guaranteed.

If your dividend yield can’t beat your risk-free rate, you might as well put your money with the US Treasury / EPF since you face less risk investing in a US Treasury note / EPF than investing in a stock to generate the same returns.


The Fifth’s Perspective

There you have it! Seven quick steps to help you pick the best dividend stocks to invest in. As you can see, there are lots more items to consider other than just dividend yield!

So remember to check these seven criteria whenever you’re looking to invest for dividends.


https://fifthperson.com/what-ive-learned-after-making-more-than-5-figures-in-dividends/

Wednesday 18 April 2018

Is an oil refinery a good business to own for the long term?

Is a refinery a good business to own for the long term? 

1. In the oil refining business, the cost of inputs 
(crude oil) and the price of outputs (refined products) are 
both highly volatile, influenced by global, regional, and local 
supply and demand changes. Refineries must find the sweet 
spot against a backdrop of changing environmental regulation, 
changing demand patterns and increased global competition 
among refiners in order to be profitable. 

2. Oil refining is a capital-intensive business.  P
lanning, designing,
permitting and building a new medium-sized refinery is a 5-7 year process,
and costs $7-10 billion, not counting acquiring the land. The cost varies
depending on the location (which determines land and construction costs† ),
the type of crude to be processed and the range of outputs (both of the latter
affect the configuration and complexity of the refinery), the size of the plant
and local environmental regulations.

3. After the refinery is built, it is expensive to operate. Fixed 
costs include personnel, maintenance, insurance, administration 
and depreciation. Variable costs include crude feedstock, 
chemicals and additives, catalysts, maintenance, utilities and 
purchased energy (such as natural gas and electricity). To be 
economically viable, the refinery must keep operating costs 
such as energy, labour and maintenance to a minimum. 

4. Like most other commodity processors (such as food, lumber and 
metals), oil refiners are price takers: in setting their individual 
prices, they adapt to market prices. 

5. Since refineries have little or no influence over the price of 
their input or their output, they must rely on operational 
efficiency for their competitive edge.
Because refining is caught 
between the volatile market segments of cost and price, it is 

exposed to significant risks. 

6. “Crack” Spreads 
The term “crack” comes from how a refinery makes money 
by breaking (or ‘cracking’) the long chain of hydrocarbons 
that make up crude oil into shorter-chain petroleum products. 
The crack spread, therefore, is the difference between 
crude oil prices and wholesale petroleum product prices 
(mostly gasoline and distillate fuels). Like most manufacturers, 
a refinery straddles the raw materials it buys and the finished 
products it sells. In the case of oil refining, both prices 
can fluctuate independently for short periods due to supply, 
demand, transportation and other factors. Such short-term volatility 
puts refiners at considerable risk when the price of one or the 
other rises or falls, narrowing profit margins and squeezing 
the crack spread. The crack spread is a good approximation 
of the margin a refinery earns. Crack spreads are negative if 
the price of refined products falls below that of crude oil. 
A major determinant of a crack spread is the ratio of how 
much crude oil is processed into different refined petroleum 
products, because each type of crude more easily yields a 
different product, and each product has a different value. 
Some crude inherently produces more diesel or gasoline 
due to its composition. 


Summary: 

Refining is “low return, low growth,capital intensive, politically sensitive and environmentally uncertain.” A refinery will close 

if it cannot sustain its profitability.


[The 3 Cs = Capital Intensive, Commodity Pricing and Cyclicality (volatile earnings).]

http://www.canadianfuels.ca/website/media/PDF/Publications/Economics-fundamentals-of-Refining-December-2013-Final-English.pdf

Sunday 15 April 2018

Free Cash Flow to Equity

Free cash flow to equity

From Wikipedia, the free encyclopedia
In corporate financefree cash flow to equity (FCFE) is a metric of how much cash can be distributed to the equity shareholders of the company as dividends or stock buybacks—after all expenses, reinvestments, and debt repayments are taken care of. Whereas dividends are the cash flows actually paid to shareholders, the FCFE is the cash flow simply available to shareholders. The FCFE is usually calculated as a part of DCF or LBO modelling and valuation. The FCFE is also called the levered free cash flow.

Basic formulae[edit]

Assuming there is no preferred stock* outstanding:
where:
or
or

where:
  • NI is the firm's net income;
  • D&A is the depreciation and amortisation;
  • b is the debt ratio;
  • Capex is the capital expenditure;
  • ΔWC is the change in working capital;
  • Net Borrowing is the difference between debt principals paid and raised;
  • In this case, it is important not to include interest expense, as this is already figured into net income.

FCFF vs. FCFE[edit]

  • Free cash flow to firm (FCFF) is the cash flow available to all the firm's providers of capital once the firm pays all operating expenses (including taxes) and expenditures needed to support the firm's productive capacity. The providers of capital include common stockholders, bondholders, preferred stockholders, and other claimholders.
  • Free cash flow to equity (FCFE) is the cash flow available to the firm’s common stockholders only.
  • If the firm is all-equity financed, its FCFF is equal to FCFE.

Negative FCFE[edit]

Like FCFF, the free cash flow to equity can be negative. If FCFE is negative, it is a sign that the firm will need to raise or earn new equity, not necessarily immediately. Some examples include:
  • Large negative net income may result in the negative FCFE;
  • Reinvestment needs, such as large capex, may overwhelm net income, which is often the case for growth companies, especially early in the life cycle.
  • Large debt repayments coming due that have to be funded with equity cash flows can cause negative FCFE; highly levered firms that are trying to bring their debt ratios down can go through years of negative FCFE.
  • The waves of the reinvestment process, when firms invest large amounts of cash in some years and nothing in others, can cause the FCFE to be negative in the big reinvestment years and positive in others;[5]
  • FCFF is a preferred metric for valuation when FCFE is negative or when the firm's capital structure is unstable.

Uses[edit]

There are two ways to estimate the equity value using free cash flows:
  • Discounting free cash flows to firm (FCFF) at the weighted average cost of capital (WACC) yields the enterprise value. The firm’s net debt and the value of other claims are then subtracted from EV to calculate the equity value.
  • If only the free cash flows to equity (FCFE) are discounted, then the relevant discount rate should be the required return on equity. This provides a more direct way of estimating equity value.
  • In theory, both approaches should yield the same equity value if the inputs are consistent.

https://en.wikipedia.org/wiki/Free_cash_flow_to_equity


*Where there are preferred shares and minority interests, the dividends paid to them must be subtracted from the FCFF to get the FCFE.

KEY INPUTS TO FREE CASH FLOW (FCF)

KEY INPUTS TO FREE CASH FLOW (FCF)

Free Cash Flow (FCF) is calculated by taking the Operating Income (EBIT) for a business, minus its Taxes, plus Depreciation & Amortization, minus the Change in Operating Working Capital, and minus the company’s Capital Expenditures for the year. This derives a much more accurate representation of the Cash that a company generates than does pure Net Income:
Free Cash Flow Calculation graphic


FCF = EBIT x (1-tax) + D&A - Changes in Working Capital - Capex

What is the difference between operating cash flow and net income?

Cash flow and net income statements are different in most cases, because there is a time gap between documented sales and actual payments. The situation is under control if the invoiced customers pay in cash during the next period. If the payments are postponed further, there is a larger difference between net income and operative cash flow statements. If the trend does not change, the annual report may demonstrate equally low total cash flow and net income.

Usually, rapidly developing companies report low net income as they invest in improvement and expansion. In the long run, high operating cash flow brings a stable net income raise, though some periods may show net income decreasing tendency.

Constant generation of cash inflow is more important for a company's success than accrual accounting. Cash flow is a better criterion and barometer of a company's financial health. Managers and investors can avoid many traps if they pay more attention to operating cash flow analyses.


Read more: What is the difference between operating cash flow and net income? | Investopedia https://www.investopedia.com/ask/answers/012915/what-difference-between-operating-cash-flow-and-net-income.asp#ixzz5CkS3Obxg
Follow us: Investopedia on Facebook

Reviewing The Cash Flow From Operations

Cash Flow Statement: Reviewing The Cash Flow From Operations
By Michael Schmidt |
Updated March 5, 2018


Operating cash flow is cash that is generated from the normal operating processes of a business. A company's ability to consistently generate positive cash flows from its daily business operations is highly valued by investors. In particular, operating cash flow can uncover a company's true profitability. It’s one of the purest measures of cash sources and uses.

The purpose of drawing up a cash flow statement is to see a company's sources of cash and uses of cash, over a specified time period. The cash flow statement is traditionally considered to be less important than the income statement and the balance sheet, but it can be used to understand the trends of a company's performance that can't be understood through the other two financial statements.

While the cash flow statement is considered the third most important of the three financial statements, investors find the cash flow statement to be the most transparent, so they rely on it more than the other financial statements when making investment decisions.


The Cash Flow Statement

Operating cash flow, or cash flow from operations (CFO), can be found in the cash flow statement, which reports the changes in cash versus its static counterparts: the income statement, balance sheet and shareholders’ equity statement. Specifically, the cash flow statement reports where cash is used and generated over specific time periods and ties the static statements together. By taking net income on the income statement and making adjustments to reflect changes in the working capital accounts on the balance sheet (receivables, payables, inventories), the operating cash flow section shows how cash was generated during the period. It is this translation process from accrual accounting to cash accounting that makes the operating cash flow statement so important.

The cash flow statement is broken down into three categories: cash flow from operating activities, cash flow from investing activities and cash flow from financing activities. In some cases, there is a supplemental activities category as well. These are segregated so that analysts develop a clear idea of all the cash flows generated by a company’s various activities.

1. Operating activities: records a company's operating cash movement, the net of which is where operating cash flow (OCF) is derived.

2. Investing activities: records changes in cash from the purchase or sale of property, plants, equipment or generally long-term investments.

3. Financing activities: reports cash level changes from the purchase of a company’s own stock or issue of bonds, and payments of interest and dividends to shareholders.

4. Supplemental information: basically everything that does not relate to the major categories.


Breakdown of Activities
Operating activities are normal and core activities within a business that generate cash inflows and outflows. They include:

  • total sales of goods and services collected during a period;
  • payments made to suppliers of goods and services used in production settled during a period;
  • payments to employees or other expenses made during a period.


Cash flow from operating activities excludes money that is spent on capital expenditures, cash directed to long-term investments and any cash received from the sale of long-term assets. Also excluded is the amount that is paid out as dividends to stockholders, amounts received through the issuance of bonds and stock, and money used to redeem bonds.

Investing activities consist of payments made to purchase long-term assets, as well as cash received from the sale of long-term assets. Examples of investing activities are the purchase or sale of a fixed asset or property, plant, and equipment, and the purchase or sale of a security issued by another entity.

Financing activities consist of activities that will alter the equity or borrowings of a company. Examples of financing activities include the sale of a company's shares or the repurchase of its shares.


Calculating Cash Flow
To see the importance of changes in operating cash flows, it’s important to understand how cash flow is calculated. Two methods are used to calculate cash flow from operating activities: indirect and direct, which both produce the same result.

Direct Method: This method draws data from the income statement using cash receipts and cash disbursements from operating activities. The net of the two values is the OCF.
Indirect Method: This method starts with net income and converts it to OCF by adjusting for items that were used to calculate net income but did not affect cash.


Direct vs. Indirect Method
The direct method adds up all the various types of cash payments and receipts, including cash paid to suppliers, cash receipts from customers and cash paid out in salaries. These figures are calculated by using the beginning and end balances of a variety of a business accounts and examining the net decrease or increase of the account.


The exact formula used to calculate the inflows and outflows of the various accounts differs based on the type of account. In the most commonly used formulas, accounts receivable are used only for credit sales and all sales are done on credit. If cash sales have also occurred, receipts from cash sales must also be included to develop an accurate figure of cash flow from operating activities. Since the direct method does not include net income, it must also provide a reconciliation of net income to the net cash provided by operations.

In contrast, under the indirect method, cash flow from operating activities is calculated by first taking the net income off of a company's income statement. Because a company’s income statement is prepared on an accrual basis, revenue is only recognized when it is earned and not when it is received. Net income is not a perfectly accurate representation of net cash flow from operating activities, so it becomes necessary to adjust earnings before interest and taxes (EBIT) for items that affect net income, even though no actual cash has yet been received or paid against them. (See What is the difference between EBIT and cash flow from operating activities?) The indirect method also makes adjustments to add back non-operating activities that do not affect a company's operating cash flow.

The direct method for calculating a company's cash flow from operating activities is a more straightforward approach in that it reveals a company's operating cash receipts and payments, but is more challenging to prepare since the information is difficult to assemble. Still, whether you use the direct or indirect method for calculating cash from operations, the same result will be produced.


Operating Cash Flows
OCF is a prized measurement tool as it helps investors gauge what’s going on behind the scenes. For many investors and analysts, OCF is considered the cash version of net income, since it cleans the income statement of non-cash items and non-cash expenditures (depreciation, amortization, non-cash working capital and changes in current assets and liabilities). OCF is a more important gauge of profitability than net income, as there is less opportunity to manipulate OCF to appear more or less profitable. With the passing of strict rules and regulations on how overly creative a company can be with its accounting practices, chronic earnings manipulation can easily be spotted, especially with the use of OCF. It is also a good proxy of a company’s net income; for example, a reported OCF higher than NI is considered positive, as income is actually understated due to the reduction of non-cash items.

AT&T Cash Flow Statement showing cash from operating activities.

AT&T Cash Flow Statement showing cash from operating activities.

Above are the reported cash flow activities for AT&T (T
) for its fiscal year 2012 (in millions). Using the indirect method, each non-cash item is added back to net income to produce cash from operations. In this case, cash from operations is over five times as much as reported net income, making it a valuable tool for investors in evaluating AT&T's financial strength.


The Bottom Line
Operating cash flow is just one component of a company’s cash flow story, but it is also one of the most valuable measures of strength, profitability and the long-term future outlook. It is derived either directly or indirectly and measures money flow in and out of a company over specific periods. Unlike net income, OCF excludes non-cash items like depreciation and amortization which can misrepresent a company's actual financial position. It is a good sign when a company has strong operating cash flows with more cash coming in than going out. Companies with strong growth in OCF most likely have more stable net income, better abilities to pay and increase dividends, and more opportunities to expand and weather downturns in the general economy or their industry.

If you think “cash is king,” strong cash flow from operations is what you should watch for when analyzing a company.


Read more: Cash Flow Statement: Reviewing The Cash Flow From Operations | Investopedia https://www.investopedia.com/articles/investing/102413/cash-flow-statement-reviewing-cash-flow-operations.asp#ixzz5CkNk5dp4
Follow us: Investopedia on Facebook


https://www.investopedia.com/articles/investing/102413/cash-flow-statement-reviewing-cash-flow-operations.asp

Operating Cash Flow: Better Than Net Income?

Operating Cash Flow: Better Than Net Income?
By Rick Wayman
Updated November 16, 2015 —


Operating cash flow is the lifeblood of a company and the most important barometer that investors have. Although many investors gravitate toward net income, operating cash flow is a better metric of a company's financial health for two main reasons. First, cash flow is harder to manipulate under GAAP than net income (although it can be done to a certain degree). Second, "cash is king" and a company that does not generate cash over the long term is on its deathbed.

But operating cash flow doesn't mean EBITDA (earnings before interest taxes depreciation and amortization). While EBITDA is sometimes called "cash flow", it is really earnings before the effects of financing and capital investment decisions. It does not capture the changes in working capital (inventories, receivables, etc.). The real operating cash flow is the number derived in the statement of cash flows.


Overview of the Statement of Cash Flows
The statement of cash flows for non-financial companies consists of three main parts:

Operating flows - The net cash generated from operations (net income and changes in working capital).
Investing flows - The net result of capital expenditures, investments, acquisitions, etc.
Financing flows - The net result of raising cash to fund the other flows or repaying debt.

By taking net income and making adjustments to reflect changes in the working capital accounts on the balance sheet (receivables, payables, inventories) and other current accounts, the operating cash flow section shows how cash was generated during the period. It is this translation process from accrual accounting to cash accounting that makes the operating cash flow statement so important.


Accrual Accounting vs. Cash Flows
The key differences between accrual accounting and real cash flow are demonstrated by the concept of the cash cycle. A company's cash cycle is the process that converts sales (based upon accrual accounting) into cash as follows:

Cash is used to make inventory.
Inventory is sold and converted into accounts receivables (because customers are given 30 days to pay).
Cash is received when the customer pays (which also reduces receivables).
There are many ways that cash from legitimate sales can get trapped on the balance sheet. The two most common are for customers to delay payment (resulting in a build up of receivables) and for inventory levels to rise because the product is not selling or is being returned.

For example, a company may legitimately record a $1 million sale but, because that sale allowed the customer to pay within 30 days, the $1 million in sales does not mean the company made $1 million cash. If the payment date occurs after the close of the end of the quarter, accrued earnings will be greater than operating cash flow because the $1 million is still in accounts receivable.


Harder to Fudge Operating Cash Flows
Not only can accrual accounting give a rather provisional report of a company's profitability, but under GAAP it allows management a range of choices to record transactions. While this flexibility is necessary, it also allows for earnings manipulation. Because managers will generally book business in a way that will help them earn their bonus, it is usually safe to assume that the income statement will overstate profits.


An example of income manipulation is called "stuffing the channel" To increase their sales, a company can provide retailers with incentives such as extended terms or a promise to take back the inventory if it is not sold. Inventories will then move into the distribution channel and sales will be booked. Accrued earnings will increase, but cash may actually never be received, because the inventory may be returned by the customer. While this may increase sales in one quarter, it is a short-term exaggeration and ultimately "steals" sales from the following periods (as inventories are sent back). (Note: While liberal return policies, such as consignment sales, are not allowed to be recorded as sales, companies have been known to do so quite frequently during a market bubble.)

The operating cash flow statement will catch these gimmicks. When operating cash flow is less than net income, there is something wrong with the cash cycle. In extreme cases, a company could have consecutive quarters of negative operating cash flow and, in accordance with GAAP, legitimately report positive EPS. In this situation, investors should determine the source of the cash hemorrhage (inventories, receivables, etc.) and whether this situation is a short-term issue or long-term problem. (For more on cash flow manipulation, see Cash Flow On Steroids: Why Companies Cheat.)


Cash Exaggerations
While the operating cash flow statement is more difficult to manipulate, there are ways for companies to temporarily boost cash flows. Some of the more common techniques include: delaying payment to suppliers (extending payables); selling securities; and reversing charges made in prior quarters (such as restructuring reserves).

Some view the selling of receivables for cash - usually at a discount - as a way for companies to manipulate cash flows. In some cases, this action may be a cash flow manipulation; but I think it is also a legitimate financing strategy. The challenge is being able to determine management's intent.


Cash Is King
A company can only live by EPS alone for a limited time. Eventually, it will need cash to pay the piper, suppliers and, most importantly, the bankers. There are many examples of once-respected companies who went bankrupt because they could not generate enough cash. Strangely, despite all this evidence, investors are consistently hypnotized by EPS and market momentum and ignore the warning signs.


The Bottom Line
Investors can avoid a lot of bad investments if they analyze a company's operating cash flow. It's not hard to do, but you'll need to do it, because the talking heads and analysts are all too often focused on EPS.


Read more: Operating Cash Flow: Better Than Net Income? https://www.investopedia.com/articles/analyst/03/122203.asp#ixzz5CkLd7MuT
Follow us: Investopedia on Facebook

Free Cash Flow For The Firm - FCFF

What is 'Free Cash Flow For The Firm - FCFF'

Free cash flow for the firm (FCFF) is a measure of financial performance that expresses the net amount of cash that is generated for a firm after expenses, taxes and changes in net working capital and investments are deducted. FCFF is essentially a measurement of a company's profitability after all expenses and reinvestments. It's one of the many benchmarks used to compare and analyze financial health.


BREAKING DOWN 'Free Cash Flow For The Firm - FCFF'

FCFF represents the cash available to investors after a company has paid all of its costs of doing business, invests in current assets (such as inventory) and invests in long-term assets (such as equipment). FCFF includes both bondholders and stockholders when considering the money left over for investors.

The FCFF calculation is a good representation of a company's operations and its performance. FCFF takes into account all cash inflows in the form of revenues, all cash outflows in the form of ordinary expenses and all reinvested cash needed to keep the business growing. The money left over after conducting all of these operations represents a company's FCFF.


Calculating FCFF

The calculation for FCFF can take many forms, and it's important to understand each version. The most common equation is shown as:

FCFF = net income + non-cash charges + interest x (1 - tax rate) - long-term investments - investments in working capital

Other equations include:

FCFF = Cash Flow from Operations + Interest Expense x ( 1 - Tax Rate ) - Capex

FCFF = earnings before interest and taxes x (1 - tax rate) + depreciation - long-term investments - investments in working capital

FCFF = earnings before interest, tax, depreciation and amortization x (1 - tax rate) + depreciation x tax rate - long-term investments - investments in working capital


Benefits of Using FCFF

Free cash flow is arguably the most important financial indicator of the value of a company's stock. The value, and therefore the price, of a stock is considered to be the summation of the company's expected future cash flows.

However, stocks are not always accurately priced. Understanding a company's FCFF allows investors to test whether a stock is fairly valued. 

FCFF also represents a company's ability

  • to pay out dividends, 
  • conduct share repurchases or 
  • pay back debt holders. 
Any investor who is looking to invest in a company's corporate bond or public equity should check its FCFF.

A positive FCFF value would indicate that the firm has cash left after expenses.

A negative value indicates that the firm has not generated enough revenue to cover its costs and investment activities.

  • In that instance, an investor should dig deeper to assess why this is happening. 
  • It can be a conscious decision, as in high-growth tech companies that take consistent outside investments, or it could be a signal of financial issues.


https://www.investopedia.com/terms/f/freecashflowfirm.asp


Calculating FCFF

The calculation for FCFF can take many forms, and it's important to understand each version. The most common equation is shown as:

FCFF = net income + non-cash charges + interest x (1 - tax rate) - long-term investments - investments in working capital

Other equations include:

FCFF = Cash Flow from Operations + Interest Expense x ( 1 - Tax Rate ) - Capex

FCFF = earnings before interest and taxes x (1 - tax rate) + depreciation - long-term investments - investments in working capital

FCFF = earnings before interest, tax, depreciation and amortization x (1 - tax rate) + depreciation x tax rate - long-term investments - investments in working capital


Rearranging the equations:

*FCFF = [net income + interest x (1 - tax rate) + non-cash charges  - investments in working capital] - long-term investments.

Other equations include:

FCFF = [Cash Flow from Operations + Interest Expense x ( 1 - Tax Rate )] - Capex

*FCFF = [earnings before interest and taxes x (1 - tax rate) + depreciation  - investments in working capital] - long-term investments.

FCFF = [earnings before interest, tax, depreciation and amortization x (1 - tax rate) + depreciation x tax rate  - investments in working capital] - long-term investments


EBIT x (1-tax rate) 
= PBT x(1-tax rate) + Interest x (1-tax rate) 
= Net income + Interest x (1-tax rate)

Cash Flow from Operation 
= Net income + non-cash charges - investments in working capital

Thursday 5 April 2018

How can you achieve consistent, high-level returns?

How can you achieve consistent, high-level returns?

Students of investing look for a formula.  Many students read both technical works and the retrospective testimonies of high-performing investors.

1.  The technical approaches:  A few good books have been written.  But reported technical investment approaches rarely, if ever, lead to consistent, high-level returns.

2.  The investment memoirs:  They tend to be long on philosophy and short on advice for how to buy particular securities.


Thus, in both areas, the students are largely disappointed.


Investment memoirs of successful investment practitioners

However, as the works of successful investment practitioners, the memoirs do have much to recommend them.  They describe non-specifically, investment approaches that worked in practice.  They capture an important aspect of investment success:  that it depends more on character than on mathematical or technical ability. This is the consistent message of investment memoirs of a group of successful investment practitioners.

The problem is that each memoir presents a unique perspective on the character traits necessary for investment success.  Different authors emphasize different characteristics:

- patience,
- coolness in a crisis,
- wide-ranging curiosity,
- diligence in pursuit of information,
- independent thought, broad qualitative as opposed to detailed quantitative understanding,
- humility,
- a proper appreciation of risk and uncertainty,
- a long time horizon, 
- intellectual rigour and balance in analysis,
- a willingness to live outside the herd, and 
- the ability to maintain a consistently critical perspective.


Unfortunately, an investor with all these qualities is a rare bird indeed.

Tuesday 3 April 2018

Two great revelations that made Warren the richest person in the world

"You have to understand accounting and you have to understand the nuances of accounting. It's the language of business and it's an imperfect language, but unless you are willing to put in the effort to learn accounting how to read and interpret financial statements---you really shouldn't select stocks yourself. "
-WARREN BUFFETT


TWO GREAT REVELATIONS THAT MADE WARREN THE RICHEST PERSON IN THE WORLD

In the mid-sixties Warren began to reexamine Benjamin Graham's investment strategies. In doing so he had two stunning revelations about what kinds of companies would make the best investments and the most money over the long run. As a direct result of these revelations he altered the Graham-based value investment strategy he had used up until that time and in the process created the greatest wealth-investment strategy the world has ever seen.

It is the purpose of this book to explore Warren's two revelations---

1. How do you identify an exceptional company with a durable competitive advantage?
2. How do you value a company with a durable competitive advantage?

---to explain how his unique strategy works, and how he uses financial statements to put his strategy into practice. A practice that has made him the richest man in the world.


http://jameslau88.com/warren_buffett_and_the_interpretation_of_financial_statements_by_mary_buffett_and_david_clark.htm

How Warren determines it is time to sell

HOW WARREN DETERMINES IT IS TIME TO SELL

In Warren's world you would never sell one of these wonderful businesses as long as it maintained its durable competitive advantage. The simple reason is that the longer you hold on to them, the better you do. Also, if at any time you sold one these great investments, you would be inviting the taxman to the party. Inviting the taxman to your party too many times makes it very hard to get superrich. Consider this: Warren's company has about $36 billion in capital gains from his investments in companies that have durable competitive advantages. This is wealth he hasn't yet paid a dime of tax on, and if he has it his way, he never will.

Still, there are times that it is advantageous to sell one of these wonderful businesses. The first is when you need money to make an investment in an even better company at a better price, which occasionally happens.

The second is when the company looks like it is going to lose its durable competitive advantage. This happens periodically, as with newspapers and television stations. Both of them used to be fantastic businesses. But the Internet came along and suddenly the durability of their competitive advantage was called into question. A questionable competitive advantage is not where you want to keep your money long-term.

The third is during bull markets when the stock market, in an insane buying frenzy, sends the prices on these fantastic businesses through the ceiling. In these cases, the current selling price of the company's stock far exceeds the long-term economic realities of the business. And the long-term economic realities of a business are like gravity when stock prices climb up into the outer limits. Eventually they will pull the stock price back down to earth. If they climb too high, the economics of selling and putting the proceeds into another investment may outweigh the benefits afforded by continued ownership of the business. Think of it this way: If we can project that the business we own will earn $10 million over the next twenty years, and someone today offer us $5 million for the entire company, do we take it? If we can only invest the $5 million at a 2% annual compounding rate of return, probably not, since the $5 million invested today at a 2% compounding annual rate of return would he worth only $7.4 million by year twenty. Not a great deal for us. But if we could get an annual compounding rate of return of 8%, our $5 million would have grown to $23 million by year twenty. Suddenly, selling out looks like a real sweet deal.

A simple rule is that when we see P/E ratios of 40 or more on these super companies, and it does occasionally happen, it just might be time to sell. But if we do sell into a raging bull market, then we shouldn't go out and buy something else trading at 40 times earnings. Instead, we should take a break, put our money into U.S. Treasuries and wait for the next bear market. Because there is always another bear market right around the corner, just waiting to give us the golden opportunity to buy into one or more of these amazing durable competitive advantage businesses that will, over the long-term, make us super superrich.

Just like Warren Buffett.

How Warren determines the right time to buy a fantastic business

HOW WARREN DETERMINES THE RIGHT TIME TO BUY A FANTASTIC BUSINESS

In Warren's world the price you pay directly affects the return on your investment. Since he is looking at a company with a durable competitive advantage as being a kind of equity bond, the higher the price he pays, the lower his initial rate of return and the lower the rate of return on the company's earnings in ten years. Let's look at an example: In the late 1980s, Warren started buying Coca-Cola for an average price of $6.50 a share against earnings of a $.46 a share, which in Warren's world equates to an initial rate of return of 7% [$.46 / $6.5 = 7%]. By 2007 Coca-Cola was earning $2.57 a share. This means that Warren can argue that his Coca-Cola equity bond was now paying him $2.57 a share on his original investment of $6.50, which equates to a return of 39.9% [$2.57 / $6.50 = 39.53%]. But if he had paid $21 a share for his Coca-Cola stock back in the late 1980s, his initial rate of return would have been 2.2%[$.46/ $21= 2.2%]. By 2007 this would have grown only to 12% ($2.57 / $21 = 12%), which is definitely not as attractive a number as 39.9%.

Thus the lower the price you pay for a company with a durable competitive advantage, the better you are going to do over the long-term, and Warren is all about the long-term. However, these companies seldom, if ever, sell at a bargain price from an old-school Grahamian perspective. This is why investment managers who follow the value doctrine that Graham preached never own super businesses, because to them these businesses are too expensive.

So when do you buy in to them? In bear markets for startersThough they might still seem high priced compared with other "bear market bargains," in the long run they are actually the better deal. And occasionally even a company with a durable competitive advantage can screw up and do something stupid, which will send its stock price downward over the short-term. Think New Coke. Warren has said that a wonderful buying opportunity can present itself when a great business confronts a one-time solvable problem. The key here is that the problem is solvable.

When do you want to stay away from these super businesses? At the height of bull markets, when these super businesses trade at historically high price-to-earnings ratiosEven a company that benefits from having a durable competitive advantage can't unmoor itself from producing mediocre results for investors if they pay too steep a price for admission.