Saturday 16 September 2023

Hua Yang


Certain businesses are not easy to manage.  This company is in real estate development.   The business was doing well from 2009 to 2016.  From 2016 to now, it had done so poorly.

Look for businesses with durable competitive advantage, selling unique products and services.  These businesses should have earnings that are consistent and growing over the long term.  

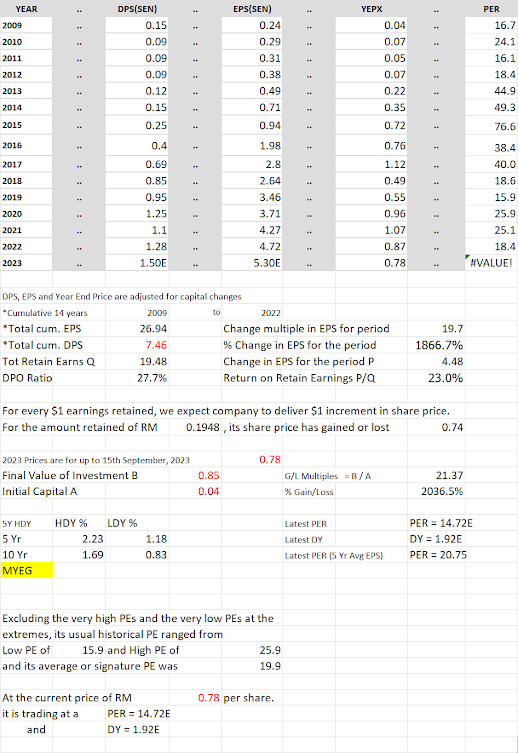
I briefly looked at this company in past and was impressed by its performance.  Look at the increasing EPS and DPS from 2009 to 2016.   

Perhaps, a lesson here is 5 years is probably a business cycle for many businesses and looking at 10 years or even 15 years results may offer one a better understanding of the long term sustainability of a business.


Boilermech


UNITED PLANTATION


British American Tobacco


Maybulk


KEY STOCK DATA

  • P/E Ratio (TTM)
    11.82(09/15/23)
  • EPS (TTM)
    RM0.03
  • Market Cap
    RM320.00 M
  • Shares Outstanding
    N/A
  • Public Float
    655.39 M
  • Yield
    5077 is not currently paying a regular dividend.
  • Latest Dividend
    RM0.00999999978(06/18/15)
  • Ex-Dividend Date
    05/28/15


Will need to take a deeper look into this company?  
At best, a turnaround stock.
Study its balance sheet for better understanding.


KEY STOCK DATA

  • P/E Ratio (TTM)
    11.82(09/15/23)
  • EPS (TTM)
    RM0.03
  • Market Cap
    RM320.00 M
  • Shares Outstanding
    N/A
  • Public Float
    655.39 M
  • Yield
    5077 is not currently paying a regular dividend.
  • Latest Dividend
    RM0.00999999978(06/18/15)
  • Ex-Dividend Date
    05/28/15

Parkson


Quality:  Poor
Management:  -
Valuation:  -

Look for another counter to invest.
At best a turnaround stock.  
Most turnarounds turn slowly, if at all.

Fraser & Neave


Petronas Dagangan


KEY STOCK DATA

  • P/E Ratio (TTM)
    22.56(09/15/23)
  • EPS (TTM)
    RM1.00
  • Market Cap
    RM22.65 B
  • Shares Outstanding
    N/A
  • Public Float
    216.04 M
  • Yield
    3.49%(09/15/23)
  • Latest Dividend
    RM0.180000007(09/26/23)
  • Ex-Dividend Date
    09/12/23


Friday 15 September 2023

Nestle


Dutch Lady


Aeon Credit


Excluding the very high PEs and very low PEs at the extremes, its usual historical PE ranged from low PE of 8.3 to high PE of 11.9 and its average or signature PE was 9.8.

At the current price of RM 11.40 per share, it is trading at a PE of 7.08x and its DY is 4.34%.  


Hong Leong Bank


2009 to 2022

It EPS grew from 58.28 sen in 2009 to 157.64 sen in 2022.  It has grown its EPS 2.7x.

Its EPS grew at a faster rate from 2009 to 2015 (doubling over 6 years) and grew at a slower rate from 2016 to 2022 (EPS increased by about 50%),

Excluding the very high PEs and very low PEs at the extremes, its usual historical PE ranged from low PE of 11.2 to high PE of 16.5 and its average or signature PE was 14.1.

It paid out 35% of its earnings as dividends and grew its earnings by 99.36 sen (157.64 - 58.28 sen).  It retained 957.61 sen (1473.01 sen - 515.4 sen).  The return on its retained earnings (RORE) is thus, 10.4% (99.36 sen / 1473.01 sen).

Its usual DY ranged from low DY of 2.38% to high DY of 3.12%.   

At the current price of RM 19.90 per share, it is trading at a PE of 11.06x and its DY is 2.96%.  


MYEG


2009 to 2022

It EPS grew from 0.24 sen in 2009 to 4.72 sen in 2022.  It had grown its EPS 19.7x.

Its EPS grew 11.7x, at a fast rate from 0.24 sen in 2009 to 2.8 sen in 2017.  Its EPS dropped from 2.8 sen inn 2017 to 2.64 sen in 2018.  From 2018, its EPS grew from 2.64 sen to 4,72 sen in 2022; it grew 1.8x.  

Its PE expanded from PE of 16.1 in 2009 to PE of 76.6 in 2015.  From 2015/16, its PE contracted from this highest PE to PE of 18.4 in 2022. 

Excluding the extremely high PEs and extremely low PEs,  the usual historical PE for MYEG ranged from low PE of 15.9 to high PE of 25.9 and its average or signature PE was 19.9.

It paid out 27.7% of its earnings as dividends and grew its earnings by 4.72 sen - 0.24 sen = 4.48 sen.  It retained 26.94 sen - 7.46 sen =  19.48 sen.  The return on its retained earnings is thus, 4.48 sen / 19.48 sen = 23%.

Its usual DY ranged from low DY of 0.83% to high DY of 2.23%.   

At the current price of RM 0.79 per share, it is trading at a PE of 14.8x and its DY is 1.91%.  


HEIM

From 2009 to 2022, it has grown its earnings per share 2.9 times, from 47 sen to 136.65 sen.  

It paid out 99% of its earnings as dividends and despite retaining only 1% of its earnings, it was able to grow its earnings 2.9 times.

At the price of RM 23.56 per share, it is trading at a PE of 18.12x.  

Excluding the extremely high PEs and extremely low PEs,  the usual historical PE for Heim ranged from 14.8 to high PE of 25.6 and its average PE was 20.5.

Its usual DY ranges 3.33% to 5.26%.   At RM 23.56 per share, its DY is 5.86%.   

Thursday 14 September 2023

Apollo


Bonia


Public Bank Berhad


From 2009 to 2022, it has grown its earnings per share 2.26 times, from 13.93 sen to 31.5 sen.  

It paid out 48.2% of its earnings as dividends and grew its earnings by 31.5 sen - 13.93 sen = 17.57 sen.  It retained 340.44 sen - 164.03 sen = 176.41 sen.  The return on its retained earnings is thus, 17.57 sen / 176.41 sen = 9.96%.

At the price of RM 4.14 per share, it is trading at a PE of 12.07x and its DY is 4.35%.  

Excluding the extremely high PEs and extremely low PEs,  the usual historical PE for PBB ranged from low PE of 13.4 to high PE of 15.7 and its average or signature PE was 14.5.

Its usual DY ranged from low DY of 3.04% to high DY of 4.35%.   


IOI


Southern Acid Berhad


Elk-Desa